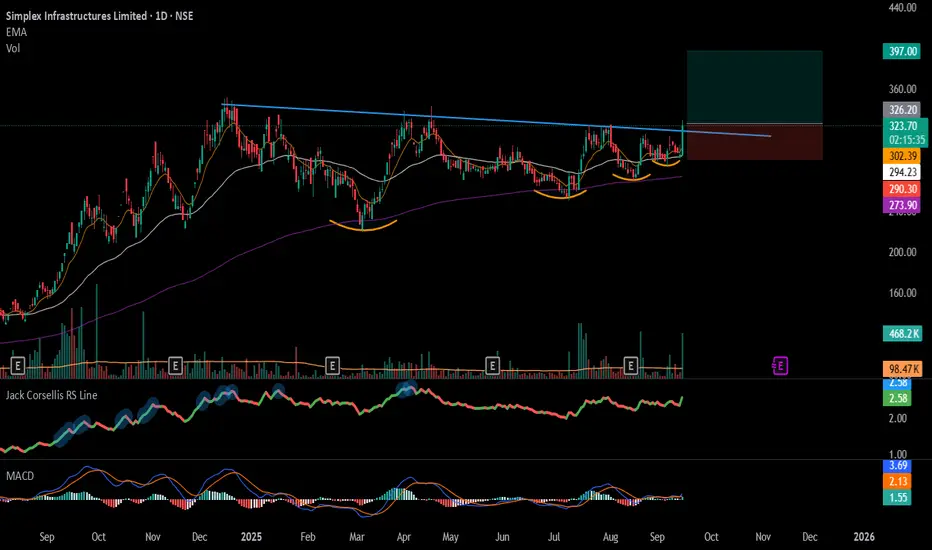
#SIMPLEXINF - TrendLine Breakout in Daily Time FrameScript: SIMPLEXINF
Key highlights: 💡⚡
📈 TrendLine Breakout in Daily Time Frame
📈 Volume spike during Breakout
📈 MACD Bounce
📈 Can go for a swing trade
BUY ONLY ABOVE 325 DCB
⏱️ C.M.P 📑💰- 322.25
🟢 Target 🎯🏆 – 22%
⚠️ Stoploss ☠️🚫 – 11%
⚠️ Important: Market conditions are Okish, Position size 50% per Trade. Protect Capital Always
⚠️ Important: Always Exit the trade before any Event.
⚠️ Important: Always maintain your Risk:Reward Ratio as 1:2, with this RR, you only need a 33% win rate to Breakeven.
✅Like and follow to never miss a new idea!✅
Disclaimer: I am not SEBI Registered Advisor. My posts are purely for training and educational purposes.
Eat🍜 Sleep😴 TradingView📈 Repeat 🔁
Happy learning with MMT. Cheers!🥂
Community ideas
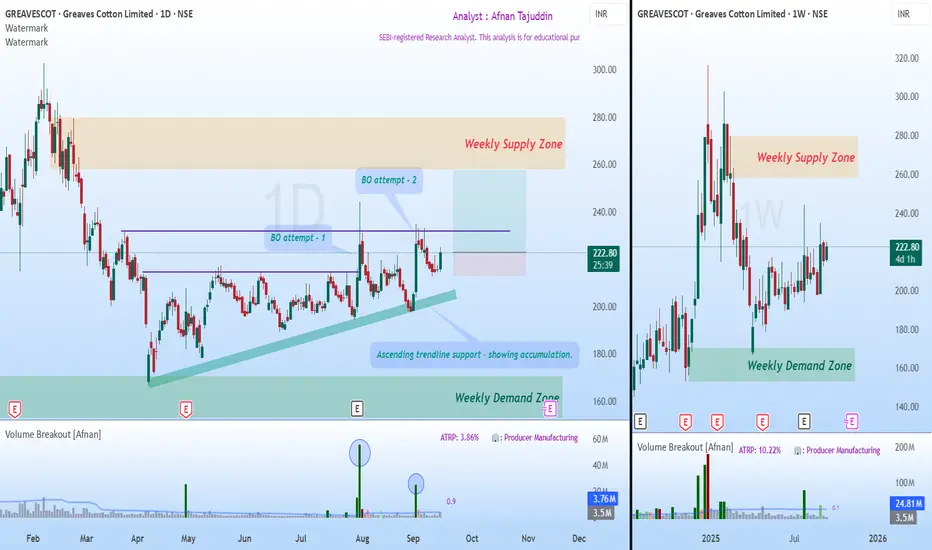
Accumulation and a Possible Breakout Towards Weekly Supply📈 Market Trend and Structure 📈
After forming an all-time high, price began its decline and developed a weekly supply zone . This supply zone now stands as the major target area for buyers.
Following the decline, price touched the weekly demand zone , which acted as a powerful reversal point . As supply-demand traders, this gave us a strong indication of the probable bottom.
From there, price recovered and moved into a phase of sideways consolidation , reflecting the tug of war between buyers and sellers.
⚡ Breakout Attempts and Trendline Support ⚡
During this consolidation, price attempted two breakouts with strong volumes . Both times, sellers stepped in aggressively at the horizontal resistance line.
Buyers, however, showed resilience by consistently defending an ascending trendline . This steady support is a sign of accumulation and growing demand.
Recently, price and volume contracted , forming an inside candle —a balance between buyers and sellers.
Today, this inside candle was broken to the upside, which could make this third breakout attempt successful.
🎯 Trading Plan 🎯
Bias: Bullish continuation.
Entry Trigger: Two previous breakout attempts + today’s breakout of the inside candle.
Target: Weekly supply zone.
Stop Loss: Below the previous swing low.
Risk-to-Reward: Approximately 1:3, a favorable setup.
✨ In Short : Sellers are still active near horizontal resistance, but buyers are showing greater strength at higher lows. The breakout of today’s inside candle tilts the balance towards buyers, making this the most promising pre-breakout setup so far.
🚀💡 “In trading, patience to wait and courage to act make all the difference.”
Lastly, Thank you for your support, your likes & comments. Feel free to ask if you have questions.
⚡ Stay disciplined, trade smart, and let the charts guide your story! 📊✨
This analysis is purely for educational purposes and is not intended as a trading or investment recommendation. I am not a SEBI registered Analyst.
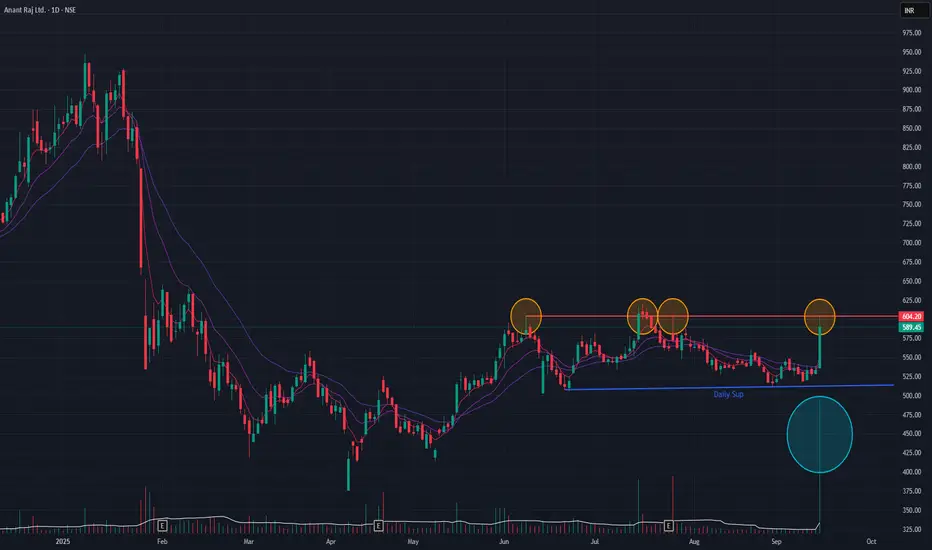
Anant Raj (Daily Timeframe) - Potential BreakOut candidate ??Following a downtrend that began in January 2025, Anant Raj has been in a sideways consolidation phase since May 2025. After several failed breakout attempts from this range, the stock demonstrated significant buying interest today, surging +10.53% on substantial volume.
While this move is positive, a cautious approach is recommended as the short-term Exponential Moving Averages (EMAs) have not yet registered a bullish positive crossover. The price action in the coming sessions will be critical for confirmation.
A sustained breakout above the consolidation channel could pave the way for further upside, with a potential short-term target of ₹667.
bankniftyI feel that bank nifty and axis bank has shown good recovery in the past two weeks. With axis bank closing over 200 dma and with strong gains for last three days, the momemtum should continue. Good time to buy for investors and traders as one can go positionally long here with targets of 1140 and 1220 on axis bank. no stoploss for nifty large cap stocks for investors.

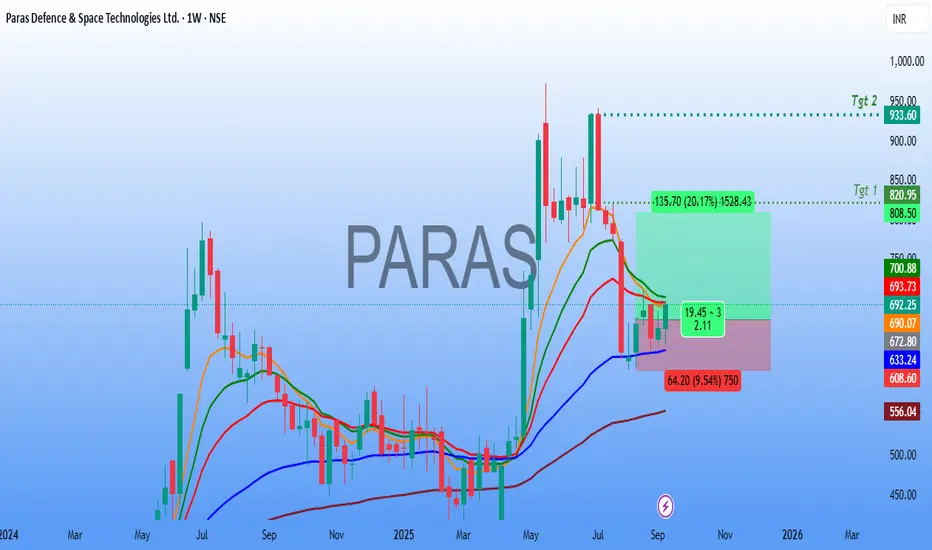
Paras Defence Technical Analysis🚀 Paras Defence & Space Technologies Ltd – Weekly Chart Analysis
The stock is showing signs of a potential reversal after consolidating near key support zones.
🔎 Technical Observations
Price Action:
After a prolonged decline from the highs, the stock has stabilized around the ₹640–660 support region. The recent weekly candle indicates buying interest, with bulls defending key support levels.
Sustained strength above the ₹700 zone can accelerate momentum towards higher levels.
Risk–Reward Setup:
The chart shows a favorable long setup with a potential upside of 20–35%.
📌 Trading Plan
Entry Zone: ₹680 – ₹700
Stop-Loss: ₹640 (weekly close basis)
Target 1: ₹820 – ₹825
Target 2: ₹930 – ₹950
⚠️ Key Notes
The ₹640–650 zone is acting as a strong support; holding this level is crucial for the bullish setup.
A breakout above ₹700 with volume confirmation will strengthen the momentum towards Target 1.
📢 Conclusion
Paras Defence is forming a bullish setup on the weekly timeframe with a good risk-to-reward ratio. If the stock sustains above ₹700, a strong move towards ₹820 and later ₹930+ looks possible. Traders should keep a strict stop-loss at ₹640 to protect capital.
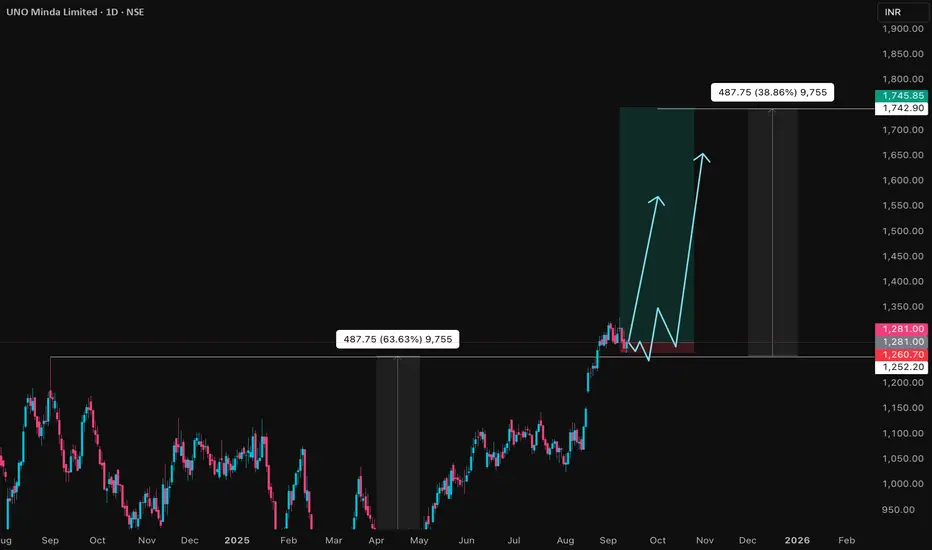
UNOMINDA Price ActionUNO Minda Ltd is trading at ₹1,282 as of September 12, 2025, delivering consistent financial and operational outperformance. For FY25, the company posted consolidated revenue of ₹16,775 crore, up 20% year-on-year, with net profit rising 9% to ₹936 crore. EBITDA grew 18% to ₹1,800 crore, and operating margins remain stable at 10.7%. Recent quarterly profit after tax is ₹289 crore, and EPS for the last twelve months stands at ₹13.97.
Expansion in premium switches, alloy wheels, lighting, sensors, sunroof products, and emerging EV technologies has bolstered top-line growth. Strategic projects—including new capacities for four-wheeler EV components and ADAS products—support a robust future pipeline, while strong cash flows enable ongoing fundraising and project commissioning.
Valuation remains at a premium to the sector, with trailing P/E around 79, price-to-book of 13, and price-to-sales ratio of 4.2, reflecting leadership in innovation and rapid growth. Return on capital employed is healthy at 15.7%, and debt remains modest, sustaining investor and institutional confidence. Technically, the stock is just below its 52-week high and continues to outperform broad market indices, maintaining an upward momentum trend.
Promoter and institutional holding are stable, affirming long-term commitment, and a final dividend of ₹1.50 per share was declared for FY25, rewarding shareholders alongside growth investments. UNO Minda’s medium- and long-term outlook remains highly constructive, anchored by strong financials, prudent capital allocation, innovative leadership, and a resilient growth trajectory.
EMA vs SMA vs WMA: Which Moving Average Should You Use?🔎 Intro / Overview
Moving Averages remain one of the most trusted tools in technical analysis. They smooth price action, highlight the trend, and often act as dynamic support or resistance.
In this post, we compare the 20-period SMA, EMA, and WMA on BTCUSD 4H to show how each reacts differently to market moves.
___________________________________________________________
📔 Concept
SMA (Simple Moving Average): Every candle in the lookback is weighted equally → smooth but slower to react.
EMA (Exponential Moving Average): Recent candles carry more weight → reacts faster, hugs price closely.
WMA (Weighted Moving Average): Linear weighting → a balance between SMA’s stability and EMA’s sensitivity.
The difference lies in responsiveness. Faster averages react early but risk false signals, slower averages confirm trends but lag.
___________________________________________________________
📌 How to Use
1️⃣ Plot the 20-period SMA, EMA, and WMA together.
2️⃣ Watch how each responds during pullbacks, rallies, and consolidations.
3️⃣ Use EMA for quicker signals, SMA for smoother long-term view, and WMA if you prefer a middle ground.
4️⃣ Combine with price action or RSI to avoid relying on moving averages alone.
___________________________________________________________
🎯 Trading Plan
Intraday traders: EMA crossovers (e.g., 9 vs 21 EMA) for faster entries and exits.
Swing traders: SMA for identifying trend direction and major support/resistance.
Balanced traders: WMA for medium-term setups where stability and responsiveness matter equally.
Always align the moving average with your trading style and risk appetite.
___________________________________________________________
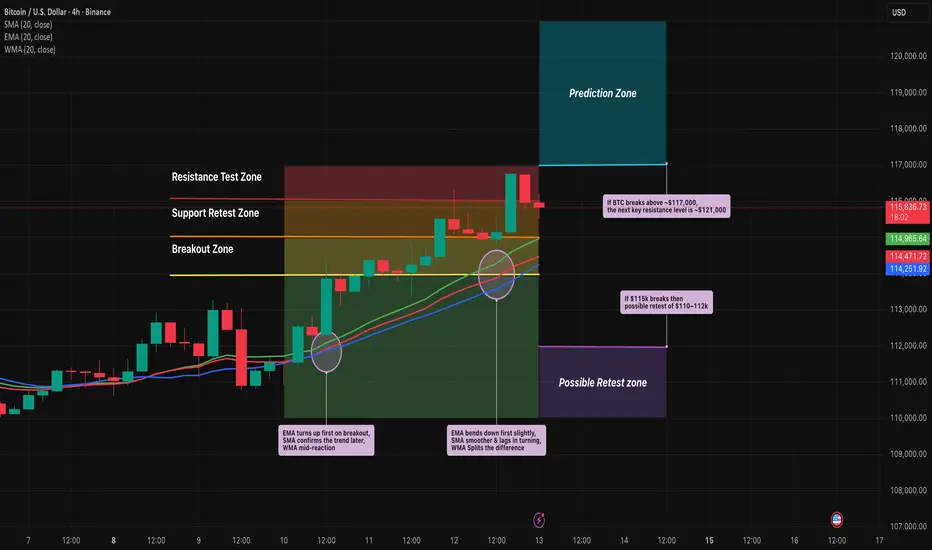
📊 Chart Explanation
On BTCUSD 4H:
EMA (red) bent upward first during the $114k breakout, SMA (blue) confirmed later, and WMA (green) sat between them.
At the $115k retest, EMA dipped first, while SMA lagged.
At $116.5–117k resistance, EMA whipsawed but SMA stayed smoother.
Notice how these differences become clear during sharp pullbacks, quick rallies, and sideways ranges.
___________________________________________________________
👀 Observation
EMA is quick but noisy ⚡, SMA is calm but late 🕰️, WMA strikes a middle ground ⚖️.
___________________________________________________________
❗ Why It Matters?
Choosing the right moving average impacts how quickly you spot entries, confirm trends, and manage stop-losses. Understanding the differences helps traders adapt strategies to both trending and sideways markets.
___________________________________________________________
🎯 Conclusion
No single moving average is “best.” Each serves a purpose depending on the timeframe and style of trading. The key is consistency — choose one that aligns with your plan, test it, and apply it with discipline.
👉 Which one do you prefer in your trading — EMA, SMA, or WMA?
___________________________________________________________
⚠️ Disclaimer
📘 For educational purposes only ·
🙅 Not SEBI registered ·
❌ Not a buy/sell recommendation ·
🧠 Purely a learning resource ·
📊 Not Financial Advice
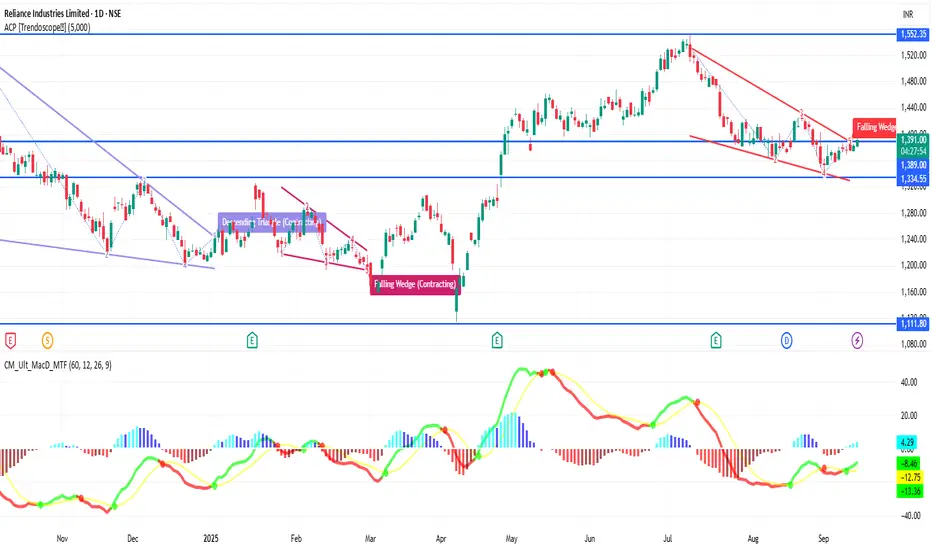
RELIANCE 1D Time frame🔢 Current Level
RELIANCE is trading around ₹1,391 – ₹1,392
🔑 Key Resistance & Support Levels
Resistance Zones:
₹1,392 – ₹1,396 (near-term resistance; breakout above this may lead to further upside)
₹1,400 (psychological resistance)
₹1,427 (stronger resistance above)
Support Zones:
₹1,380 – ₹1,385 (immediate support)
₹1,370 (short-term support; break below may indicate weakness)
₹1,350 (deeper support zone if selling pressure continues)
📉 Outlook
Bullish Scenario: If RELIANCE holds above ₹1,385, upward momentum may continue. Break above ₹1,396 can open the way toward ₹1,400+.
Bearish Scenario: If it falls below ₹1,370, risk increases toward ₹1,350.
Neutral / Range: Between ₹1,385 – ₹1,396, RELIANCE may consolidate before a directional move.
Small Account Challenge1. Introduction to the Small Account Challenge
The world of trading often fascinates people because of the possibility of turning small sums of money into significant wealth. But in reality, most aspiring traders don’t begin with huge capital. They usually start with a small account—sometimes $100, $500, or $1,000. That’s where the concept of the Small Account Challenge comes in.
The Small Account Challenge is a structured attempt to grow a limited trading account into something much larger by following disciplined strategies, strict risk management, and consistency. It’s not just about making money—it’s about proving that with knowledge and discipline, even small amounts of capital can generate meaningful results.
The challenge is extremely popular on platforms like YouTube, Twitter (X), and Instagram, where traders showcase their journey from “$500 to $5,000” or “$1,000 to $10,000.” While some of these are genuine and inspiring, others are exaggerated or misleading. The reality lies somewhere in the middle: growing a small account is possible, but it requires patience, risk control, and realistic expectations.
For beginners, the small account challenge is appealing because:
It lowers the financial barrier to entry.
It provides a structured learning curve.
It forces traders to master risk management.
It builds trading discipline early on.
In short, the challenge is about mindset and strategy as much as it is about profit.
2. The Psychology Behind the Challenge
When trading with a small account, psychology plays a massive role. Unlike institutional traders with deep pockets, small-account traders face unique pressures.
2.1 The Motivation
Many traders start the challenge because they want financial independence, to prove their skill, or simply to test their strategies without risking too much. The thrill of seeing a $500 account grow to $1,000 is powerful motivation.
2.2 Emotional Control
The smaller the account, the higher the temptation to “double up” quickly. Unfortunately, that often leads to over-leverage and account blow-ups. To succeed, traders need to control emotions like greed, fear, and revenge trading.
2.3 Patience & Discipline
The hardest part of growing a small account isn’t making money—it’s sticking to small, consistent gains. Many traders expect 100% returns overnight, but the reality is more like 2–5% gains per week (still huge compared to banks).
A disciplined trader understands:
Consistency beats luck.
Risk management is survival.
Patience compounds growth.
3. Risk Management for Small Accounts
This is the foundation of the Small Account Challenge. Without proper risk management, no strategy will work long-term.
3.1 Position Sizing
With a small account, risking too much on one trade can wipe you out. The rule of thumb is risk only 1–2% of the account per trade.
For example, in a $500 account:
Risk per trade = $5–$10.
If stop-loss is $0.50 per share, you can only trade 10–20 shares.
3.2 Stop-Loss Discipline
Small accounts can’t afford deep losses. A strict stop-loss ensures that even a string of losing trades doesn’t kill the account.
3.3 Surviving Losing Streaks
Even the best traders face losing streaks. Risk management ensures survival during bad phases so you can capitalize during good ones.
A trader with a $500 account risking $50 per trade may survive only 10 bad trades. A trader risking $5 can survive 100 trades. Survival is everything.
4. Strategies for Small Account Challenges
Different traders use different approaches. Let’s explore the most common ones:
4.1 Scalping & Day Trading
Definition: Quick trades aiming for small profits.
Why it works: Small accounts benefit from fast turnover. A few cents of movement can yield decent percentage returns.
Risk: Requires speed, discipline, and often leverage.
4.2 Swing Trading
Definition: Holding trades for days or weeks.
Why it works: Less stressful than scalping, suitable for those with jobs.
Risk: Requires patience and larger stop-losses.
4.3 Options Trading
Definition: Trading contracts based on stock price movement.
Why it works: Provides leverage, allowing small accounts to control large positions.
Risk: Options can expire worthless quickly. Requires advanced knowledge.
4.4 Futures and Forex
Definition: Trading global currencies or commodity futures.
Why it works: High leverage, 24-hour markets, low capital required.
Risk: Leverage cuts both ways; easy to blow up accounts.
4.5 Copy-Trading / Social Trading
Definition: Copying professional traders’ trades via platforms.
Why it works: Beginners learn while following experienced traders.
Risk: Success depends on who you follow.
5. Compounding & Growth
The magic of the small account challenge lies in compounding.
5.1 The Power of Reinvestment
Instead of withdrawing profits, traders reinvest them. Even small percentage gains grow exponentially.
Example:
Start: $500
Gain 5% weekly → $25 first week
After 52 weeks → Over $6,000 (if compounded).
5.2 Realistic Expectations
Social media may glamorize turning $500 into $100,000 in months, but that’s rare. A disciplined trader focuses on sustainable growth, like doubling or tripling the account in a year.
6. Tools & Platforms for Small Accounts
6.1 Brokers
Robinhood, Webull, Zerodha, Upstox → popular for commission-free trades.
Interactive Brokers → advanced tools, good for scaling later.
6.2 Journaling Tools
Keeping a trading journal is crucial. Tools like TraderSync or Edgewonk help track win rates, risk-reward ratios, and mistakes.
6.3 Charting Platforms
TradingView → easy charts and social features.
Thinkorswim → great for U.S. traders.
MetaTrader 4/5 → standard for forex.
Conclusion
The Small Account Challenge isn’t just about money—it’s about discipline, patience, and skill-building. While social media may glorify turning $100 into $100,000 overnight, the real value of the challenge lies in learning how to manage risk, control emotions, and grow steadily.
A trader who can manage a $500 account with discipline can later manage $50,000 or even $500,000. The challenge is like training for a marathon—you build endurance, habits, and consistency that last for a lifetime.
In the end, success in the Small Account Challenge is less about how much money you make and more about the trader you become through the journey.

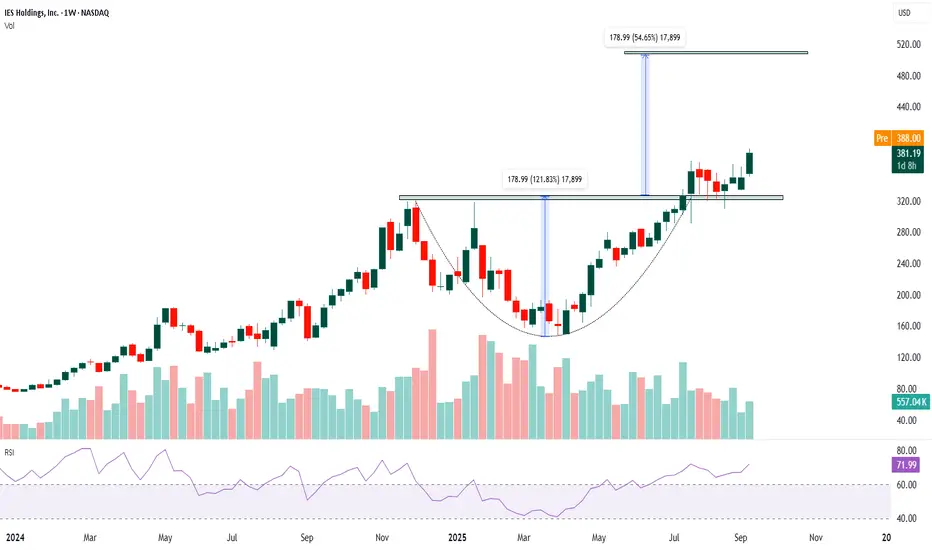
IESC- Long The chart shows a clear uptrend over the past year.
Price formed a rounded bottom (cup-shaped base) and has broken above the neckline near $320–$330, confirming a bullish continuation pattern. Current price around $381 indicates sustained bullish strength.
Volume rose meaningfully during the breakout above $330, confirming the validity of the breakout. Prior to the breakout, volume was lower during consolidation, which is typical before a strong move.
Cup and Handle breakout confirmed above $330 neckline.
Current breakout is clean, backed by momentum and volume.
The stock is in a confirmed uptrend, backed by strong momentum and volume. Best strategy: Buy on dips near $340–$350 or add above $390–$400 with confirmation. Targets: $450 short-term, $500–$520 long-term. Maintain disciplined stop-loss placement to manage risk.
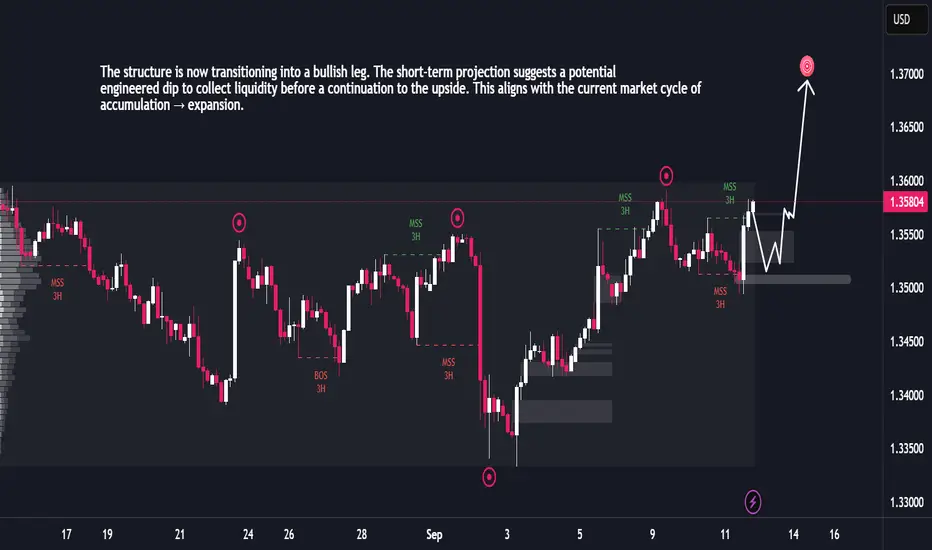
GBPUSD Ready for Expansion After Liquidity GrabThe market has been trading within a broad range, characterized by multiple liquidity grabs on both highs and lows. Each sweep has been followed by sharp reactions, confirming active smart money positioning. Recent price action shows a strong recovery after a downside liquidity sweep, indicating accumulation and rebalancing of orders.
The structure is now transitioning into a bullish leg. The short-term projection suggests a potential engineered dip to collect liquidity before a continuation to the upside. This aligns with the current market cycle of accumulation → expansion.
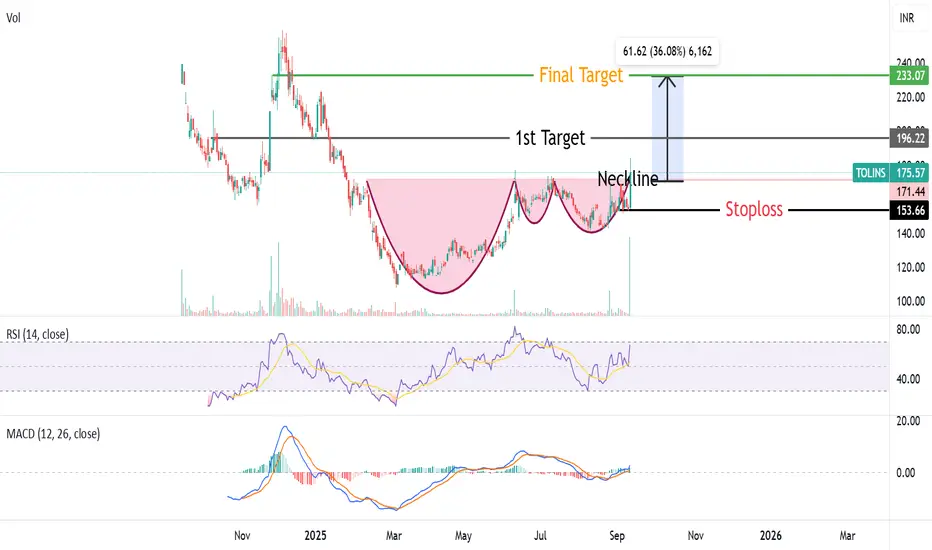
Complex Cup & Handle Pattern Breakout in TOLINS TyresTolins Tyres given Complex Cup & Handle Pattern Breakout from neckline arround 170 level. RSI & MACD also showing positive momentum ,Stock also trading above all important moving averages(50,10,200).Target of this breakout will be 230 Rs ,With a stoploss of 150Rs.
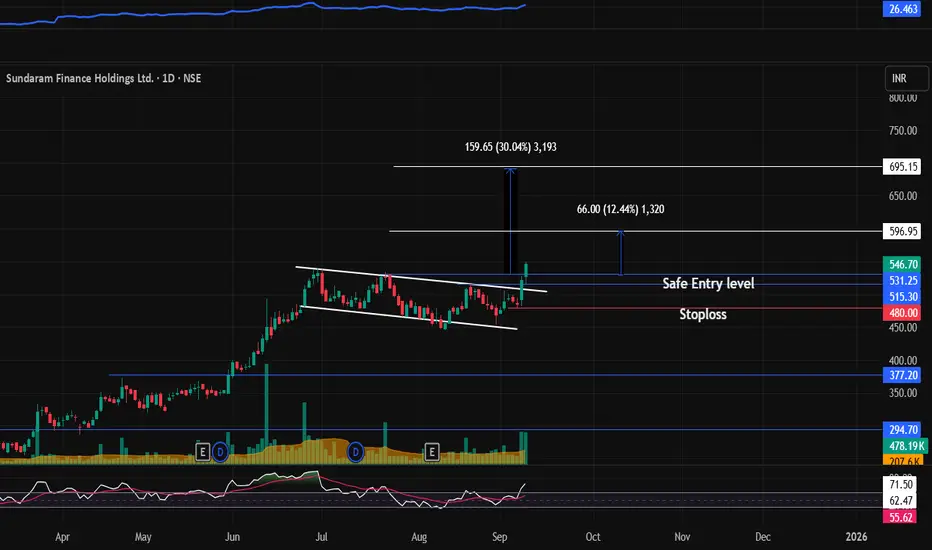
SUNDARMHLD : Breakout stock (Swing pick)#SUNDARMHLD #flagbreakout #breakoutstock #channelbreakout #swingtrading #momentumtrading
SUNDARMHLD : Swing / Short term (1-3 months)
>> Flag Breakout or Channel Breakout
>> Good Strength in stock
>> Volumes picking up
>> Low PE Stock
>> Swing Traders can Look for 10-12% Levels & Short term traders can go for Higher Levels
>> Enter at Retracement
Swing Traders can lock profit at 10% and keep Trailing
Please Boost, comment and follow us for more Learnings
Disc : Charts shared are for learning purpose only, not a Trade recommendation. Do your own research and consult your financial advisor before taking any position.
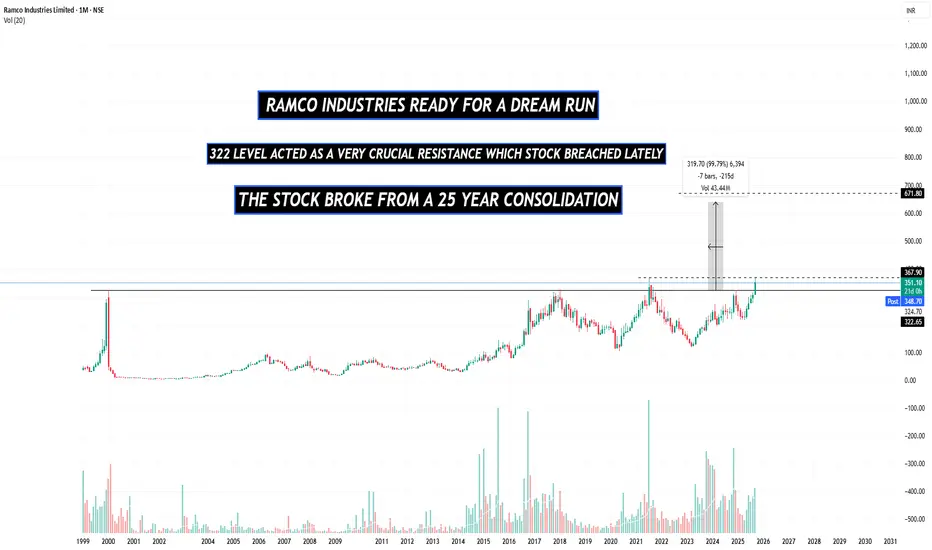
RAMCO INDUSTRIES NEAR MULTIYEAR BREAKOUTThe stock has not been able to breach the crucial resistance of 322 since 1999, pretty strange.
but now the the stock ha rallied past that level with good momentum enforcing further trust in the stock
The stock is also trading below it's book value of 488 again a pretty strange yet interesting opportunity.
It is Part of the Chennai-based Ramco Group;
Ramco Industries Ltd. is engaged in the manufacture of Fiber Cement (FC) sheets and Calcium Silicate Boards (CSBs). Company is also engaged in the spinning of cotton yarn; sale of surplus electricity generated from its windmills and computer software.
The company operates through 10 manufacturing plants for Building Products with a combined production capacity of 10,00,000 TPA
The company's profits and sales have also skyrocketed
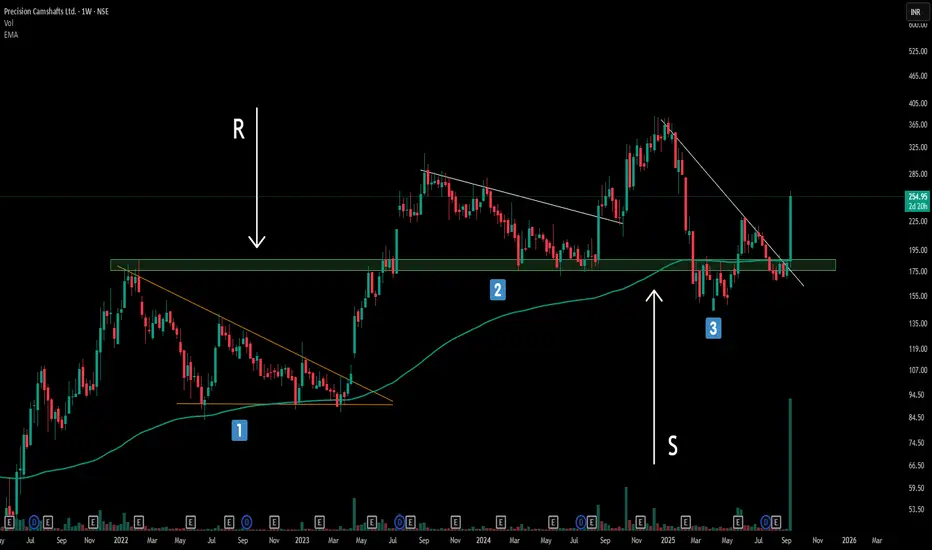
The Power of Trendline Angles : My Full time trading ExperienceBreaking Down Three Critical Trendline Structures - A Complete Analysis
Structure 1: The Power of Steep Angles (Primary Focus)
The first structure showcases what I consider the gold standard of trendline breakouts. Notice how the trendline is significantly tilted/slanted rather than following a gradual 45-degree angle.
Compressed Energy Release: Steep trendlines act like coiled springs, storing tremendous buying/selling pressure that explodes upon breakout
Key Observation: The resistance level (marked as 'R') held price down multiple times before the decisive breakout. Once broken, this level immediately flipped to become strong support (marked as 'S')—a textbook example of polarity flip dynamics.
Structure 2 & 3: Valid but Secondary Setups
While structures 2 and 3 represent legitimate continuation-based trendline breakouts, they pale in comparison to the explosive potential of Structure 1. However, they still qualify as CT (Continuation Trend) based breakout structures and shouldn't be ignored entirely
Remember: Not every trendline break deserves your attention. Focus on steep angles, exceptional volume, and clear flip confirmations for the highest probability setups. The market rewards patience and precision over frequency.
Disclaimer: Trading involves significant risk and is not suitable for all investors. Past performance does not guarantee future results. Always conduct your own research, consider seeking advice from a qualified financial advisor, and trade only with capital you can afford to lose.
Apollo Tyre - SMC AnalysisTechnical Analysis (SMC Method)
Even it is formed bullish choch and trendline breakout in the weekly timeframe, it has to break the crucial resistance zone in daily timeframe (between 488 & 500) for confirmation. Once it's broken in daily timeframe the estimate target price will be 535/540.
== EDUCATIONAL PURPOSE ONLY ==

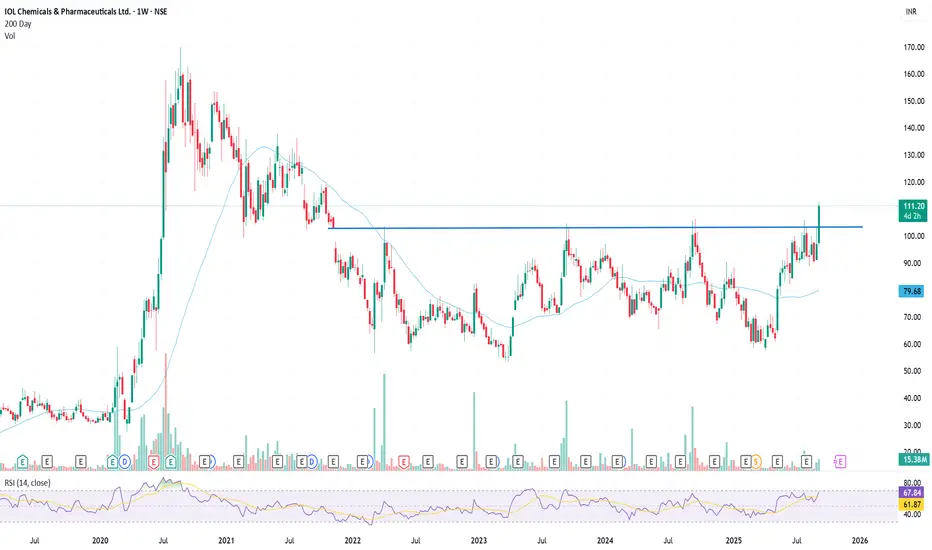
Finally the breakout is done or has it not?Stock has been in long consolidation phase with ibu and para prices making lower lows since over stocking post covid. With the new initiative taken by management and prudent cash allocation from covid times, the volumes speak of more than what the PAT showcases.
Technically on weekly charts on the first day of the week, a good volume is seen. Close at 20% would be essential for the continuous up move.
Lupin LtdDate 08.09.2025
Lupin
Timeframe : Weekly Chart
Brands
(1) Lupin Life
(2) Lupin Diagnostics
(3) Life Atharv Ability
(4) SciFlix
(5) Humrahi
(6) Pharmarack
Leadership
(1) Respiratory
(2) Diabetes Care
(3) Cardiac Care
Lupin has partnered with Amman Pharma for exclusive marketing and
commercialization of Ranibizumab, a biosimilar of Lucentis, in the Middle East region, including select territories of Jordan, Saudi Arabia, UAE, Iraq, Lebanon, and other GCC countries
Sales Mix
(1) India 34%
(2) US 38%
(3) API 5%
(4) EMEA 10%
(5) ROW 4%
(5) Growth markets 9%
Valuations
(1) Market Cap ₹ 89,467 Cr.
(2) Stock P/E 24
(3) ROCE 21%
(4) ROE 20%
(5) OPM 23%
(6) PEG 0.48
(7) Sales Growth 12%
(8) Profit Growth 63%
(9) Promoter 47%
(10) DII 25%
Regards,
Ankur

URJA a worthy penny stock??? detailed analysis - education only!short term speculative trade? - educational purpose
in the past the stock after touching longterm trendline bounces significantly
personally I'm allocation 1-2.5% of my total capital into this speculative trade with 50%+ sl
Momentum in Fundamentals:
FY24 saw total revenue grow from ₹39.58 Cr in FY23 to ₹44.47 Cr (+12.4%), and PBT rise 43.9% to ₹2.85 Cr. Net profit jumped 33.3% to ₹2.04 Cr.
On a nine-month basis (ending December 2023), net profit improved to ₹2.38 Cr from ₹1.89 Cr year-on-year. Margins (PATM) also increased to 7.49% from 6.41%.
Recent Quarterly Jump: In Q3 FY25, revenue surged to ₹14.35 Cr compared to ₹1.16 Cr the previous year. While net profit fell from ₹0.98 Cr to ₹0.36 Cr, the revenue growth was significant. Importantly, this spike triggered a 5% upper-circuit move in the stock.
ROE & ROCE Trends:Urja Global's Return on Equity (ROE) and Return on Capital Employed (ROCE) have been improving over the past two years—indicating increasing efficiency.
Low Leverage: The company maintains low debt and has zero promoter pledge, implying a cleaner balance sheet and lower financial risk relative to highly leveraged peers.
Stock Performance History:
Despite high valuations, its stock has delivered remarkable returns—~175% over one year and ~735% over five years (as of May 2024).

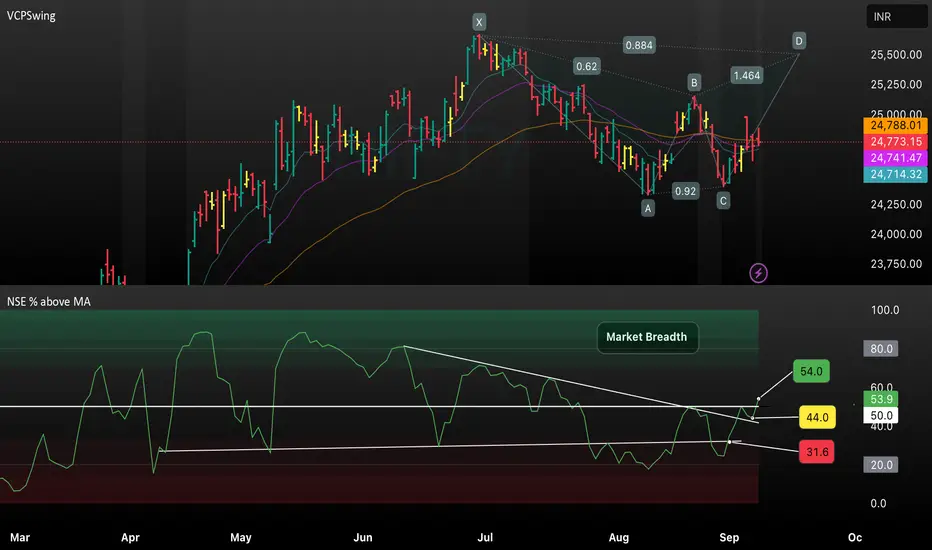
Market Breadth Breakout – Tracking NSE MomentumThis TradingView chart analyzes the NSE Index with a focus on market breadth, highlighting the percentage of stocks above their moving averages. The chart showcases a recent breakout above key breadth levels (44.0 and 50.0), signaling improving momentum and a potential trend reversal. Visual trendlines track advancing participation, offering insight into market strength and possible continuation if breadth values sustain above these thresholds. This setup helps traders identify early signs of bullish sentiment before price confirmation.
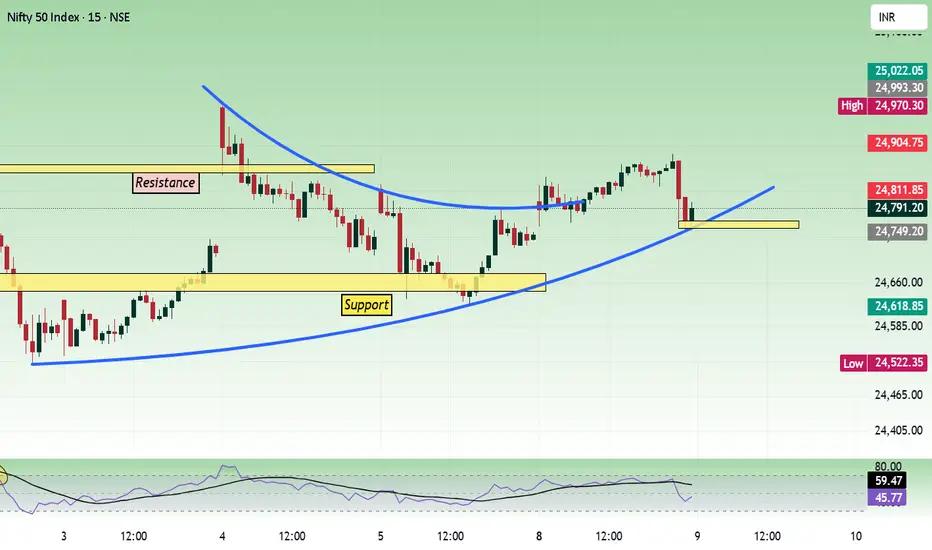
Nifty - Multi time frame analysis Sep 9Today, the price did not gain strength and moved in the range of 24700 to 24900. And 25000 is a psychological level. This type of nearby support/resistance can give choppy movement unless the price shows strength from the opening.
Support levels are 24500, 24600. Resistance levels are 24900, 25000.
We can buy if the price opens at support with bullish strength.
If the opening is flat, buy above 24820 with the stop loss of 24770 for the targets 24860, 24920, 24980, 25020, and 25080.
Sell below 24680 with the stop loss of 24730 for the targets 24640, 24600, 24540, 24500, 24460 and 24420.
As per the daily chart, the price is moving in a range, and it also has nearby trendline resistance.
Strong movement can happen if the trend line is taken with strength.
As per the hour chart, if the price does not gain strength when breaking the range it has formed today, then the expiry will be in range.
Expected expiry day range is 24400 to 24900.
Bullish Iron Condor on Nifty (30th September 2025 expiry)Hello Traders!
Just like we shared the August Iron Condor setup, here comes the fresh plan for September expiry.
Nifty is trading around 24,840 and we are witnessing a defined range between 23,750 – 25,500.
Such ranges are perfect for premium eating strategies like the Iron Condor, where time decay works in our favour as long as the index stays inside the zone.
So here’s the September plan:
Position Details
Sell 2 lots 24,700 PE @ 140.30
Buy 2 lots 24,400 PE @ 71.60
Sell 2 lots 25,500 CE @ 53.95
Buy 2 lots 25,750 CE @ 22.95
We expect Nifty to consolidate between 23,750 – 25,500 as per our technical chart analysis .
200-DEMA is acting as dynamic support
Strong resistance capped near 25,500 – 26,270
Until a breakout happens on either side, premium sellers can stay in control
This Iron Condor gives us a balanced risk-reward setup and benefits from time decay while keeping risk well-defined.
Why I Like This Setup:
Limited loss , defined by hedge positions
High probability of success as long as Nifty remains in the range
Best suited for traders focusing on consistent income from option writing
Rahul’s Tip 👉 Discipline in trade management is always more important than the setup itself.
For income-based option strategies, always check for:
Key events and news (policy, RBI, FED, budgets, etc.)
Breakout signals beyond short strikes
Quick exit or adjustment if market moves out of range
Disclaimer This post is for educational purposes only . Please manage your risk and position sizing wisely.
Avoid large quantities at once – it’s always better to scale in gradually once the range confirms.

COALINDIA-buy for 10 % move bullish points visible on Coal India Ltd (NSE: COALINDIA) 4H chart:
1. Breakout and Retest
Price broke out above a consolidation zone (marked as 1. breakout).
It later came back and successfully retested the breakout level (point 2), confirming it as support.
2. Positive Divergence
The RSI shows higher lows while price made equal/lower lows (point 3).
This indicates bullish divergence → momentum is shifting upward despite price weakness.
3. Moving Average Signals
Inside bar above 18 EMA (point 4): This shows strength and trend continuation potential.
Price action is currently defending the 200 EMA (point 6), meaning the long-term trend support is holding.
4. Bullish Candlestick Patterns
Bullish engulfing bar (point 5): A strong reversal candle pattern after consolidation.
Inside bar breakout above EMA: Suggests accumulation before an upward push.
5. Flag Pattern
After the bullish engulfing bar, price formed a flag pattern near the 200 EMA (point 6).
Flags are typically continuation patterns, suggesting further upside.
6. Volume Support
On the retest and engulfing bar, volumes are elevated, confirming genuine buying interest.
✅ Summary:
Breakout + successful retests
Positive divergence
Bullish engulfing + inside bar above EMA
Price holding above 200 EMA with a flag pattern
All these are strong bullish confluences pointing to potential continuation toward the marked target zone (~₹429).
