UBL (United Breweries) – Weekly Swing Trading PlanUBL (United Breweries) – Weekly Swing Trading Plan (Educational)
Structure overview
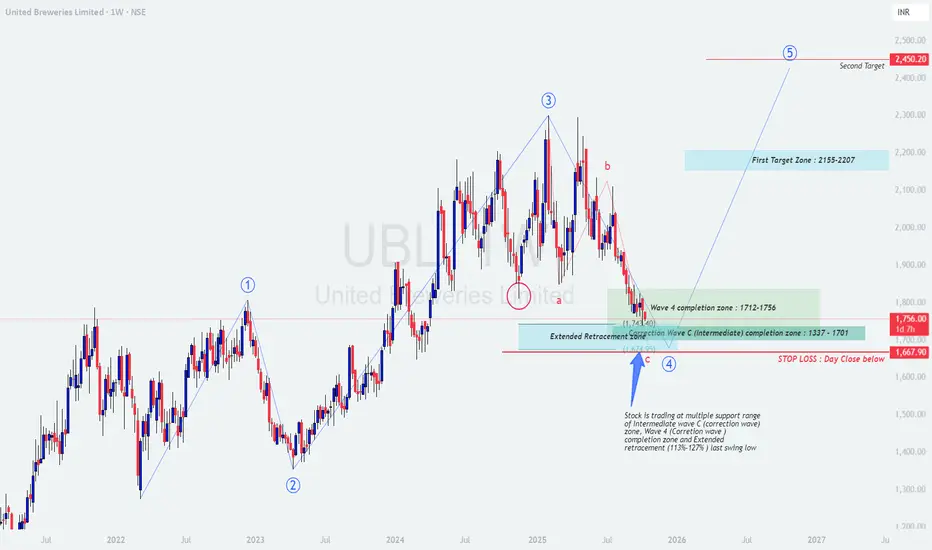
Price has completed a multi‑month corrective leg into a confluence support cluster: Wave‑4 completion zone 1712–1756 overlaps with the projected Wave‑C (intermediate) completion band 1701–1337 and the extended retracement window from the last swing 113%–127%. The market is attempting to base near this cluster with downside risk defined by the recent swing low.
Bias is accumulation-to-reversal as long as price holds above the invalidation level; confirmation improves on weekly higher low and break of the prior supply shelf.
Levels and plan
Buy zone (staggered): 1712–1756 for initial probes; add on confirmation above 1785–1800 on daily close.
Invalidation / Stop: Weekly or daily close below 1668 (recent low zone). If that fails, expect deeper extension into 1630/1600; stand aside and reassess.
Trigger confirmation: Bullish weekly candle with RSI/MACD positive cross or a daily structure break above 1825–1850 accompanied by rising volume.
First target zone: 2155–2207 (prior supply/FE confluence). Scale out 50–70% in this band.
Second target: 2450 area (projected Wave‑5/FE 1.0–1.272). Trail remainder using weekly higher‑low method.
Risk‑to‑reward: From a 1735 midpoint entry with 1668 stop, risk ≈ 67 points; to T1 midpoint 2180, reward ≈ 445 points (R≈6.6). Adjust to your execution.
Execution notes
Start with partial size in the zone; add only on strength (close back above broken EMAs or structure).
If price spikes into 1712–1756 and rejects with long lower wicks, use the next day’s high break as the tactical trigger.
If price closes below 1710 but recovers the next session and re‑enters the band, treat it as a bear trap only with clear momentum confirmation.
Trail stops to breakeven after a daily close above 1850; shift below each higher swing low on the way to T1.
Option tactics (if using derivatives)
Bull call spread when cash closes above 1825–1850: e.g., buy ATM call, sell +200 to +300 OTM to cap cost and decay.
For accumulation within 1712–1756, consider a calendar call to benefit from time if expecting a slower turn.
Exit or roll if price loses 1710 decisively; do not hold naked longs through invalidation.
Risk management
Position sizing : Risk a fixed % of equity per idea (commonly 0.5–1%) based on the distance to 1668.
Staggered entries reduce timing risk; never add if invalidation is threatened.
Respect weekly closes; a weekly close below 1668 cancels the bullish thesis until a fresh base forms.
Summary
Thesis: Corrective Wave‑C likely terminating around 1712–1756, setting up a potential Wave‑5 advance if 1668 holds.
Plan: Accumulate in 1712–1756, confirm above 1825–1850, aim T1 2155–2207 and T2 ~2450, with invalidation on a daily/weekly close below 1668.
Disclaimer: This post is for education, not investment advice or a trade recommendation; I am not a SEBI registered analyst .
Community ideas
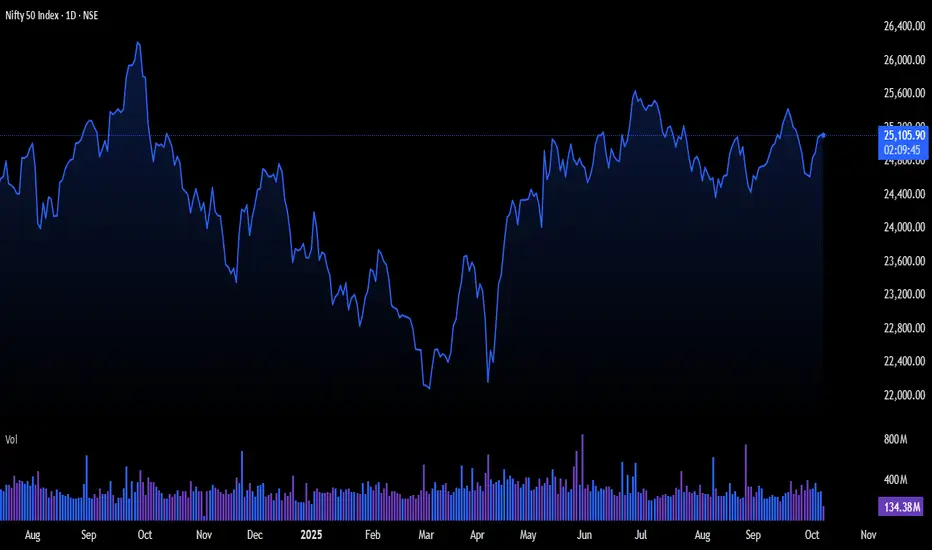
Bulls coming in on the Nifty50 indexHello,
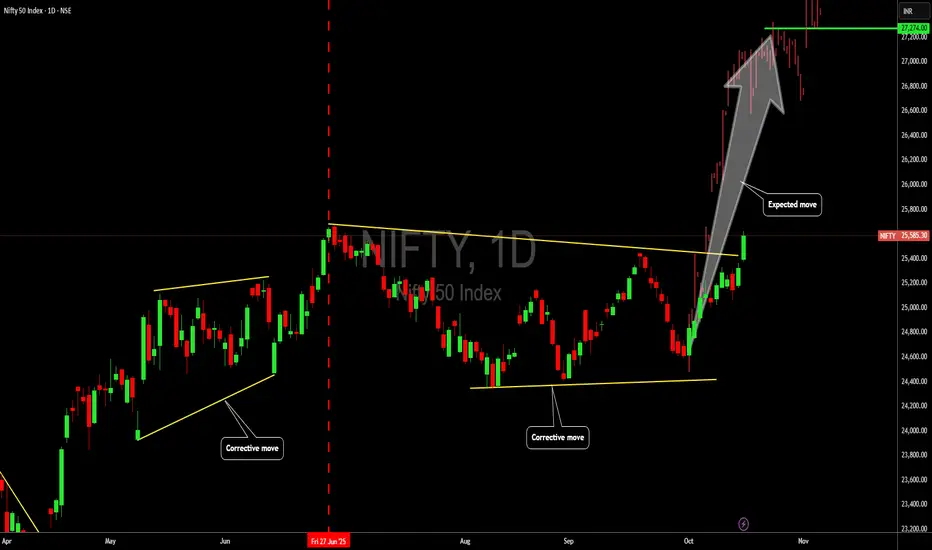
Since June 27th, 2025, the Nifty 50 index has been undergoing a correction phase, reflecting a temporary pause in the market's strong upward trend. Recent market data, however, indicates that this corrective phase is likely behind us, paving the way for renewed bullish momentum. This development offers a timely opportunity for investors to consider entering the market.
The correction served as a healthy consolidation, allowing for the market to digest previous gains and set a firmer foundation for the next upward move. The index has stabilized at attractive levels, making the current price point an excellent entry for risk-averse investors seeking upside potential with a favorable risk-reward balance.
Our technical analysis suggests that the Nifty 50 is poised to advance toward and potentially exceed the 27,000 mark in the near term.
Good luck & happy investing
Cup and Handle & Inverse Head and Shoulder in Adani Ports.The Stock Had Formed Cup And Handle & Inverse Head and Shoulder. It seems to breaks out of the Neckline, it may hit the IHNS target of 1662 approximately. And than Target of Cup & Handle. Lets see how it unfolds .Rest targets will be updated as chart unfolds. All Targets mention are Approximate. Good luck. TY .
ITS JUST PURELY FOR LEARNING AND EDUCATIONAL PURPOSE. Please Consult your financial advisor before trading or investing. I am not responsible for any kinds of your profits and your losses. THANK YOU.. JMK

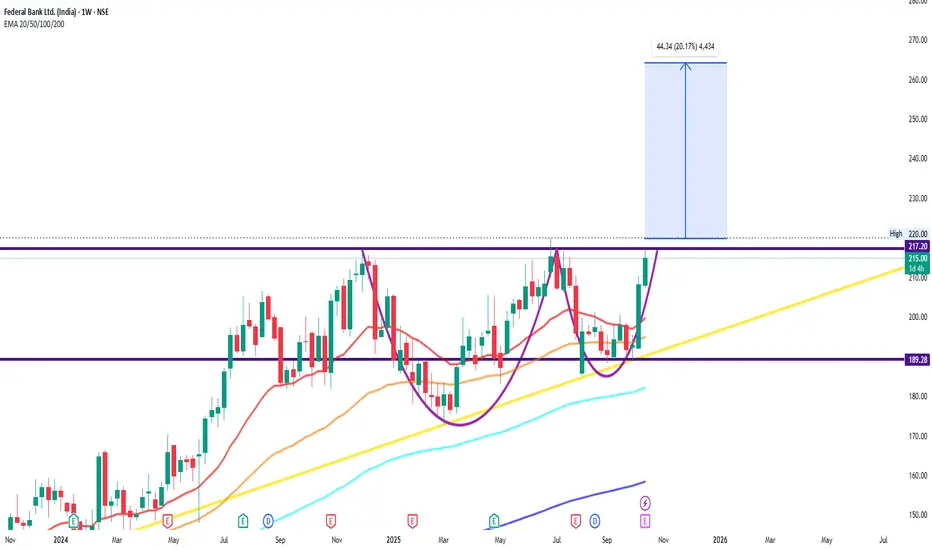
FEDERALBNKFEDERALBNK
bullish trend is Showing on the chart.
buy signals in
technical indicators and
cup with handle chart pattern.
Watch for a breakout above 215/220 to sustain the bullish trend. If the resistance holds, there could be a retest towards 180/190 and an uptrend from here.
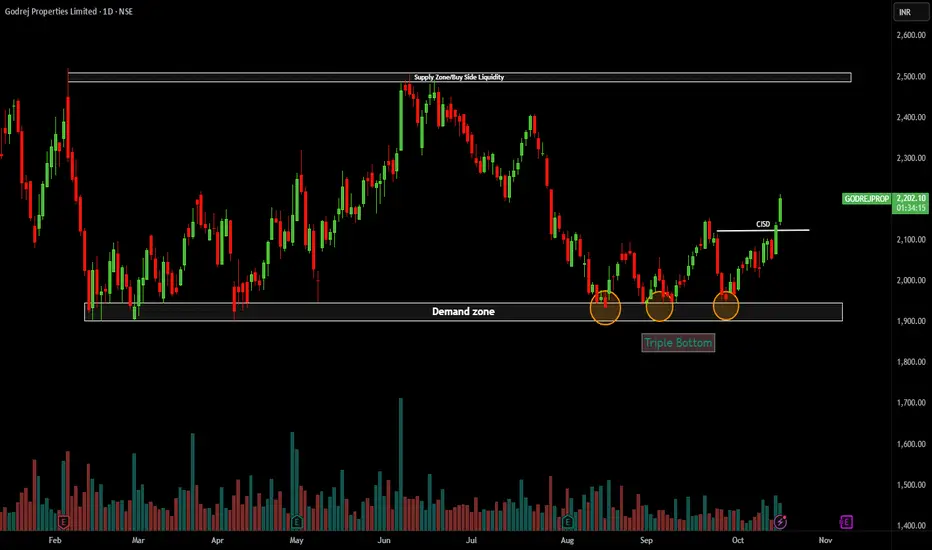
Goderaj Properties Technical analysisGodrej Properties has formed a triple bottom pattern at the demand zone (₹1,850–1,900), signaling strong accumulation and reversal from support. Price has broken above the CISD neckline (~₹2,100) with strong bullish candles and volume confirmation — indicating breakout strength.
Outlook:
Momentum remains bullish; next resistance lies near the supply zone ₹2,450–₹2,500.
Support: ₹2,080
Target: ₹2,400–₹2,500
Bias: Bullish above ₹2,100
Deepak Nitrite Ltd: At a Crossroad After a Decade-long Rally🔍 Technical Analysis
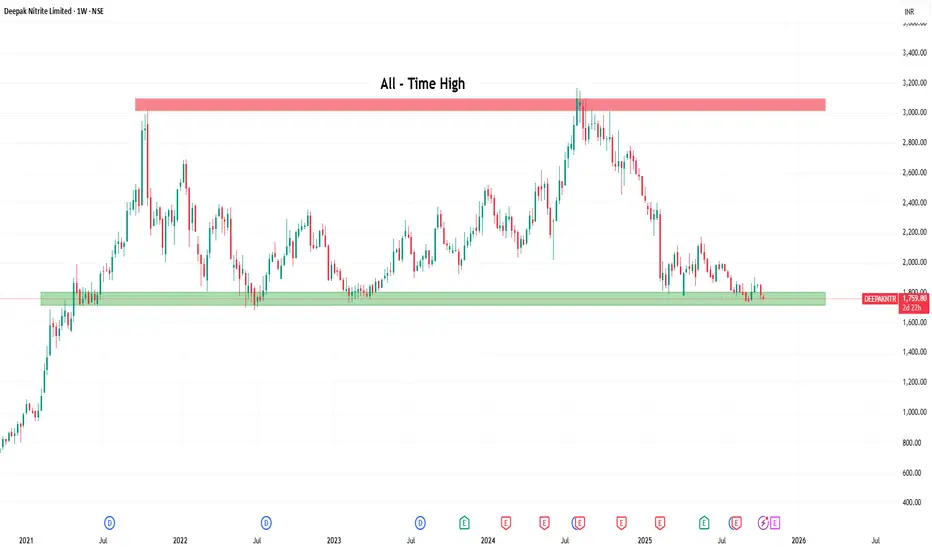
Deepak Nitrite has experienced an extraordinary rally over the past decade—from below ₹100 to a peak near ₹3,000 in October 2021. The ₹3,000–₹3,200 zone has repeatedly acted as resistance, while the ₹1,700–₹1,800 range has served as a strong support zone. Currently, the stock trades around ₹1,760, hovering near that support.
Lately, fundamentals have decelerated: after years of strong growth until ~2022, the company has faced negative year-on-year profits in recent periods. This makes the current technical zone even more critical: any push above ₹2,000 could reignite a rally, but entry should be confirmed with improving financials.
Targets:
Target 1: ₹2,300
Target 2: ₹2,600
Target 3: ₹3,000
If the ₹1,700–₹1,800 zone fails to hold, the bullish thesis would be invalidated—expect limited upside in that case.
💰 FY25 Financial Highlights (vs FY24 & FY23)
Total Income: ₹8,282 Cr (↑ ~7.8% vs ₹7,682 Cr; ↑ ~8% vs ₹7,972 Cr)
Total Expenses: ₹7,682 Cr (essentially flat vs FY24; declined vs FY23)
Profit Before Tax: ₹953 Cr (↓ vs ₹1,102 Cr in FY24; ↓ vs ₹1,146 Cr in FY23)
Profit After Tax: ₹697 Cr (↓ from ₹811 Cr in FY24 and ₹852 Cr in FY23)
EPS: ₹51.12 (down from ₹59.45 in FY24 and ₹62.47 in FY23)
📌 Despite revenue growth, margins and net profits have contracted, under pressure from rising costs and operating inefficiencies.
🧠 Fundamental Highlights
The company has committed to a ₹8,500 Cr investment in PC resin/phenol capacity, aiming to vertically integrate and reduce dependency on external suppliers.
FY25 saw an 8% rise in revenue, reaching ₹8,366 Cr. However, net profit dropped ~14% to ₹697 Cr due to cost pressures.
Margins under stress: Gross margins compressed as input costs increased—impacting profitability despite revenue gains.
Valuation & Sentiment: JM Financial continues to rate Deepak Nitrite as a Buy, keeping the target at ₹2,305 amid expectations of turnaround.
Dividend & Financial Position: The company retains modest dividend payouts (~0.4% yield) with a payout ratio around 13%.
Balance Sheet: In FY25, a significant jump in long-term debt to ₹1,267 Cr raised leverage risks vs prior years.
✅ Conclusion
Deepak Nitrite is perched at a pivotal level. While its long-term technical setup still holds promise, recent financial trends introduce caution. A break above ₹2,000 with improving fundamentals could trigger new upside, but a failure of the ₹1,700–₹1,800 support zone would cast doubt on future growth.
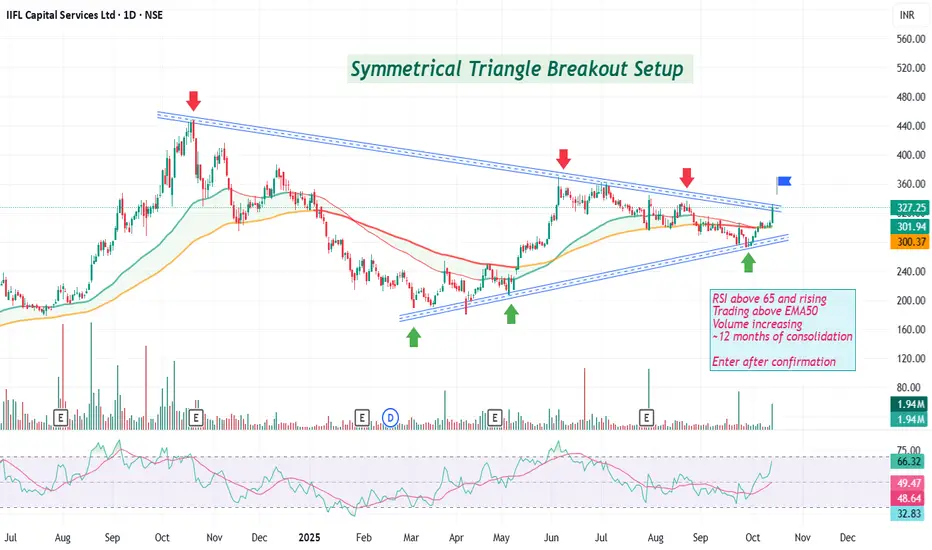
Keep IIFL Capital Service on your watchlist Symmetrical Triangle Breakout Setup
RSI above 65 and rising
Trading above EMA50
Volume increasing
~12 months of consolidation
Enter after confirmation
Disc: For study, not a recommendation. DYOR
Daily Analysis NIFTY: 13/10/25The range of 25220 to 25185 is the range where bulls and bears will decide the next set of plans.
I have explained in detail how and why prices will take a turn; hence, it will be more of a casual analysis with in-depth levels of Nifty.

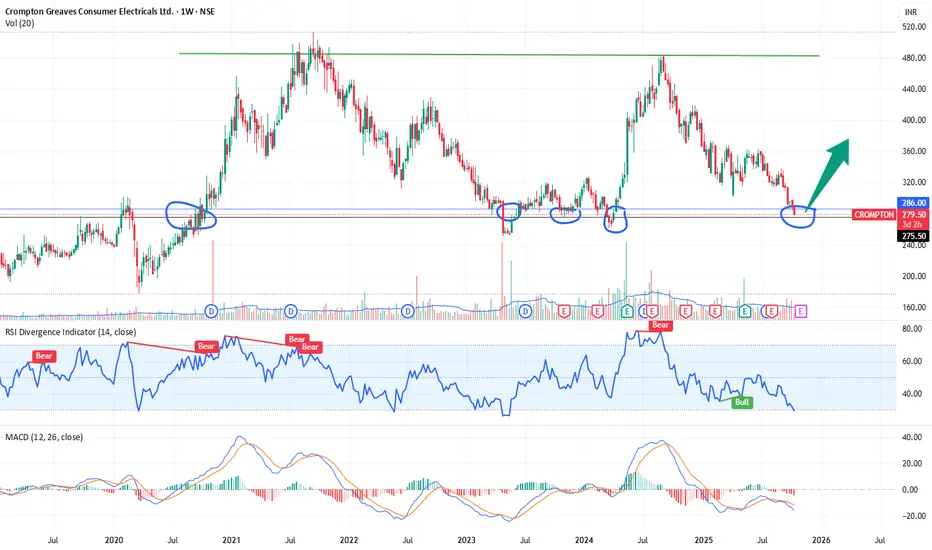
Crompton 52-Week Low Reversal Setup – Oversold Swing Trade1. Price Action
The stock is trading around ₹279–₹286, which is exactly at its 52-week low and a historical support zone from mid-2022.
Previous rebounds from this same area have led to 30–40% upside swings, indicating it’s a well-tested demand zone.
2. RSI (Relative Strength Index)
RSI at 23.8 → clearly oversold, near the lower extreme of its historical range.
In past instances (see mid-2022, mid-2023), RSI below 30 at this price level resulted in strong upward bounces — a potential bullish divergence may soon form.
3. MACD
MACD lines are deeply negative and starting to flatten out, which often precedes a momentum reversal.
If the MACD signal line crosses upward, that could confirm the beginning of a bullish swing.
4. Volume
The recent decline shows moderate-to-low volume, suggesting selling exhaustion rather than aggressive breakdown pressure.
5. Support and Resistance
Immediate support: ₹275–₹278 (current zone).
Upside swing targets: ₹305 → ₹325 → ₹350 (previous resistance and Fibonacci retracement zones).
Stop-loss: Below ₹272 (daily close).
Confirmation to Watch For
Bullish candle with volume > average on daily chart.
RSI rising above 30.
MACD crossover confirmation.
Price closing back above ₹285–₹290 (key trigger zone).
Note: This chart is for study and educational purposes only. Not a trade recommendation. Please do your own research and risk assessment before taking any position.
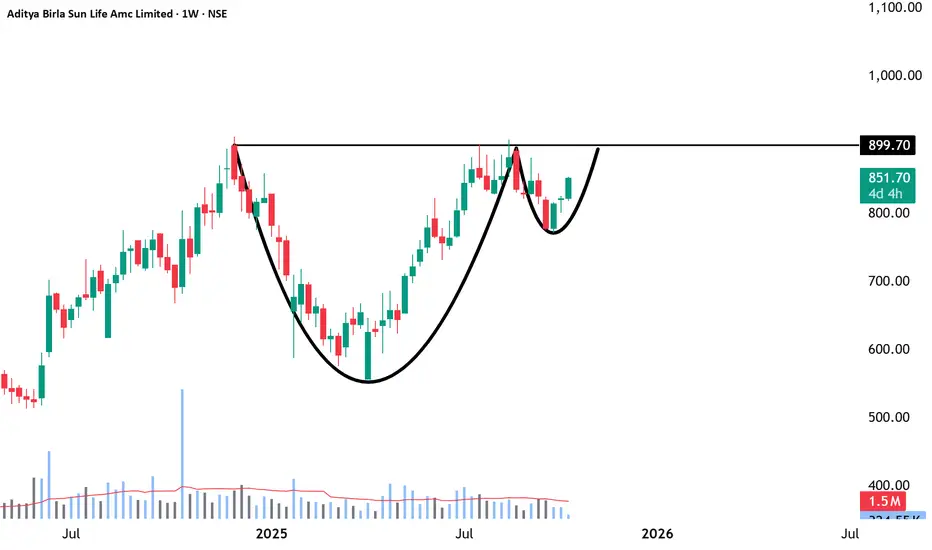
Aditya Birla Sun Life AMC-Built to Compound, Poised to BreakoutNSE:ABSLAMC
🔹 Fundamental Overview
Business Strength—One of India’s leading asset management companies, part of the Aditya Birla Group; operates across mutual funds, PMS, and AIF segments.
Financial Health – Debt-free balance sheet with excellent profitability and high cash reserves.
Profitability Metrics – ROE around 28%, ROA near 25%, and net margins above 50%, indicating strong operational efficiency.
Growth Trend – Revenue and net profit are both growing at ~20–25% YoY, supported by rising AUM and stable fee income.
Valuation—Trades near 24× P/E and 6–7× P/B; premium valuation justified by brand strength and consistency, but limits margin of safety.
Dividend Policy – Moderate yield (~1.5–1.7%) with regular payouts; good for long-term income seekers.
Key Positives—Strong parentage, scalable business, high ROE, and steady market share gains.
Key Risks—Market-linked revenues, fee compression risk, and competition from passive products and fintechs.
🔹 Technical Overview
Trend Bias—The long-term trend remains bullish, with the price comfortably above the 50-DMA (₹838) and 200-DMA (₹748).
Momentum – RSI around 55–60, neutral to mildly positive; no overbought signs.
Trend Strength – ADX below 20 shows consolidation; potential for trend expansion if volume picks up.
Crucial Support Zone – ₹ 815 – ₹ 830; strong base for accumulation.
Resistance Zone – ₹ 854 – ₹ 860; a breakout above this range may trigger a sustained rally.
Long-Term Projection – 2,500+++ possible over 3–5 years in favorable market conditions.
Risk Control – Maintain stop-loss below ₹ 810 for long positions; trail profits once above ₹ 900.
🔹 Investor Takeaway
Outlook—Fundamentally robust, financially sound, and technically poised for breakout after consolidation.
Strategy—Ideal for gradual accumulation on dips and adding on confirmed breakouts above ₹ 860.
Time Horizon – Best suited for 1–5 year investors seeking stable compounding from a high-quality financial business.
========================
========================
⚠️ Disclaimer:
This analysis is for educational and informational purposes only.
We are not SEBI-registered analysts or advisors.
This is our personal view based on available data and market trends.
Please consult your SEBI-registered investment advisor before making any investment or trading decisions.
You are solely responsible for any financial decisions you make based on this content.
========================
Trade Secrets By Pratik
========================
VBL Looking Bearish??!!!VBL - On Weekly timeframe,
Inverted cup&handle pattern and a breakdown visible!!! (shown below)
On Dailytimeframe,
VBL is travelling inside a Descending channel pattern making highs and lowerhighs...lows and lowerlows...
SL & Target levels shown @ chart!!!
Let's wait & watch!!!
Thank you!!!
Just my view...not a tip nor advice!!!!

PGEL: Suggest Momentum ShiftPG Electroplast Ltd. (PGEL) has recently shown signs of emerging strength after a prolonged phase of consolidation. Over the last two trading sessions, the stock has demonstrated upward momentum, suggesting a possible attempt to break out of its range-bound structure. This observation is supported by several technical factors:
1. Moving Averages & Volume Dynamics
The stock has successfully closed above the 20-day EMA, indicating short-term bullish sentiment.
It is currently trading near the 50-day EMA, although it has not yet closed above this level. The recent price movement has been accompanied by increased trading volume, which may reflect growing market participation.
2. Change of Character (CHOCH)
The break above the 20-day EMA, despite the price not closing above the 50-day EMA, may signal a CHOCH. This is often interpreted by technical analysts as a potential shift in trend direction, particularly from bearish to neutral or bullish.
3. RSI Momentum
The RSI has moved above the 60 level, suggesting strengthening momentum. This level is typically viewed as a transition zone between neutral and bullish conditions.
4. MACD Signal
A bullish crossover on the MACD indicator has occurred on the daily timeframe. This crossover may indicate a potential shift in momentum, especially when supported by price structure and volume.
Breakout Confirmation Level:
A sustained close above ₹597 could be interpreted as a breakout from the consolidation zone. If this level is cleared with volume support, the next potential resistance may lie near ₹712 , based on historical price action. The lower boundary of the recent consolidation zone, around ₹494 , may act as a support level. This area could be monitored for potential retests or invalidation of the breakout attempt.
Disclaimer: This analysis is intended for educational and informational purposes only. It does not constitute investment advice or a recommendation to buy, sell, or hold any financial instrument. Market participants are encouraged to conduct their own research and consult with a licensed financial advisor before making any investment decisions.

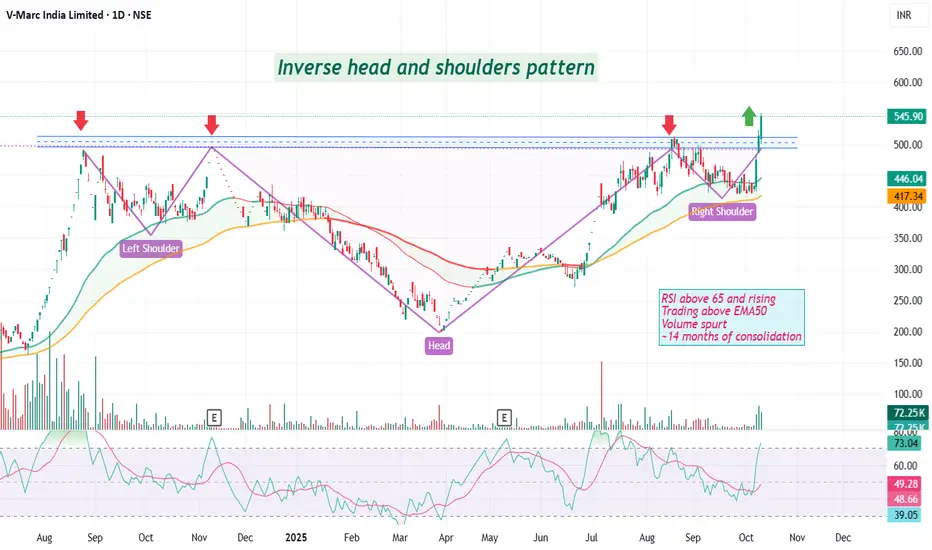
Breakout in V-Marc IndiaInverse head and shoulders pattern
RSI above 65 and rising
Trading above EMA50
Volume spurt
near14 months of consolidation
Disc: for study, not a recommendation. DYOR
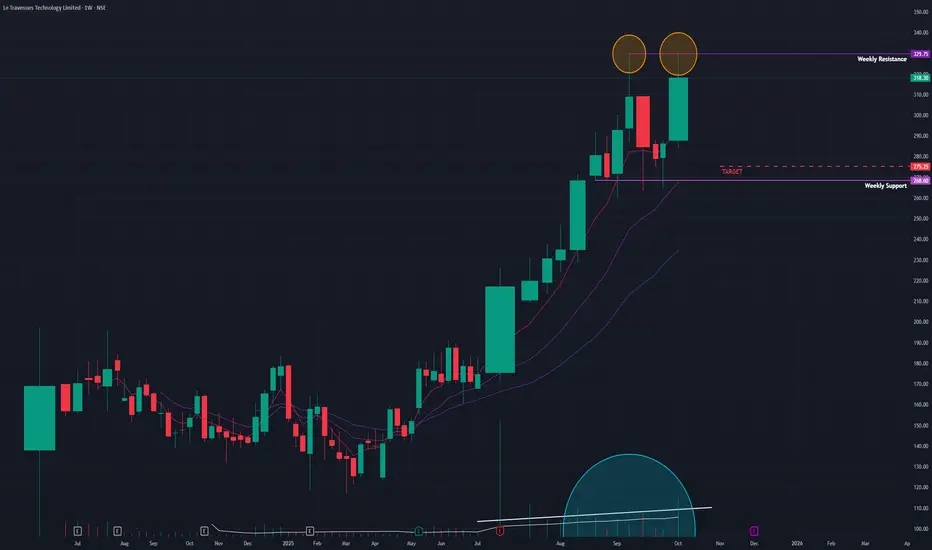
Ixigo (W) - At a Crossroad: Bullish Trend vs. Bearish PatternAfter a spectacular run-up, Ixigo (Le Travenues Technology Ltd) has entered a sideways consolidation phase. The current price action presents conflicting technical signals, placing the stock at a critical inflection point where it could either be pausing before another surge or forming a major top.
The Powerful Backdrop
Since April 2025, Ixigo has been in a powerful bull market, delivering an extraordinary gain of approximately 166% in just a few months. Following this rapid ascent, the stock's strong momentum has paused since August 2025, with the price now trading within a well-defined horizontal range.
The Current Dilemma: Two Competing Scenarios
The technical picture offers two distinct and competing interpretations:
1. The Bullish Case (A Healthy Consolidation):
This perspective views the current phase as a normal and healthy pause, where the stock is building energy for its next advance. This argument is supported by:
- Strong Underlying Momentum: Key indicators like the short-term Exponential Moving Averages (EMAs) remain in a bullish positive crossover state, and the Relative Strength Index (RSI) is still rising, suggesting the primary uptrend remains intact.
2. The Bearish Warning (A Potential Reversal):
Conversely, there are clear warning signs that the rally could be losing steam:
- Potential Double-Top: A Double-Top pattern , a classic bearish reversal signal, appears to be forming at the upper boundary of the trading range.
- Elevated Volume: Typically in a bullish consolidation, volume tends to decrease. However, volume has remained relatively high during this phase, which at a potential peak, can be a sign of distribution (selling) rather than accumulation.
Conclusion and Key Triggers to Watch
Ixigo is currently in a state of equilibrium, and a breakout from the current range is required for confirmation of the next directional move.
- Bullish Trigger: A decisive close above the range's resistance would invalidate the Double-Top pattern and signal a continuation of the uptrend. This would open a path towards the ₹380 level.
- Bearish Trigger: A decisive close below the range's support would confirm the Double-Top pattern, suggesting the bullish momentum has faded and a correction towards the ₹275 level could be imminent.
Until either of these levels is breached, patience is warranted. The direction of the break from this consolidation will be the key to identifying the stock's next major trend.
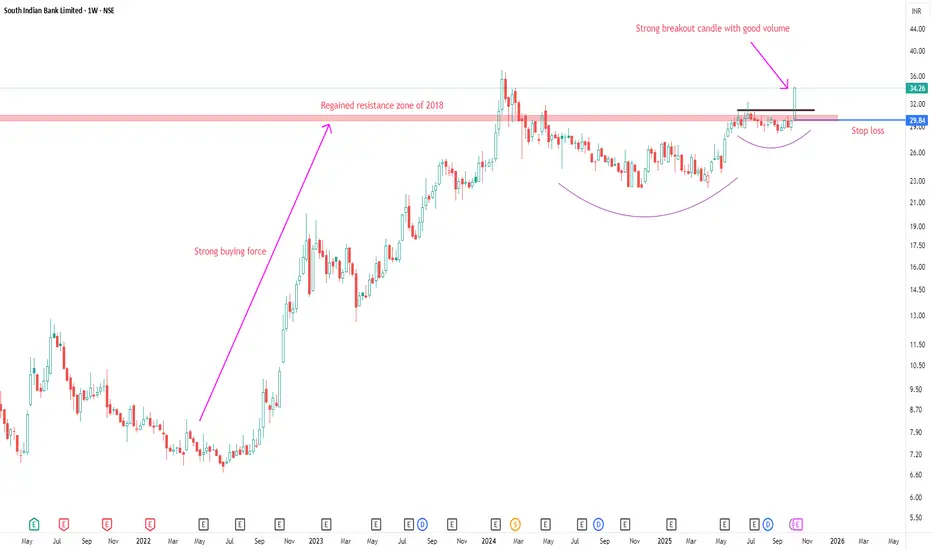
SOUTH INDIAN BANK LTD ANALYSISFOR LEARNING PURPOSE
SOUTH INDIAN BANK LTD- The current price of SOUTH INDIAN BANK is 34.26 rupees
I am going to buy this stock because of the reasons as follows-
1. Its making 52W high with some good volume (sign of strength)
2. It got a great buying force and moved up by 440% in 2022-2023 (which shows smart money)
3. It is showing better relative strength as it stood strong in volatile times including last few weeks.
4. The risk and reward is favourable. The good part- The stock is not extended.
5. The stock can be a good turnaround story if it does great in coming time.
6. The stock has got a good catalyst and that is- Mutual Funds and FIIs have increased their stake in this stock.
They have gone aggressive in that.
7. Another good part- The sector is looking bullish. Private Bank sector is getting better and things go well, we can see ATH soon in this sector.
I am expecting more from this in coming weeks
I will buy it with minimum target of 35-40% and then will trail after that.
My SL is at 29.80 rupees
I will be managing my risk.
ICICI Bank – Low-Risk Investment OpportunityFor positional investments , I prefer analyzing the weekly chart to filter out short-term noise and whipsaws.
The price has been consistently respecting the 50-week moving average (50 MA) since 2023 - a strong sign of trend stability.
The stock is currently trading near a demand zone, which also aligns with a previous resistance turned support area.
There’s a confluence of bullish factors - 50 MA support, horizontal demand zone, and a hidden bullish RSI divergence - all pointing to a potential reversal with a favorable risk–reward setup.
Overall, this setup presents a low-risk entry opportunity for medium- to long-term investors looking to ride the broader uptrend.

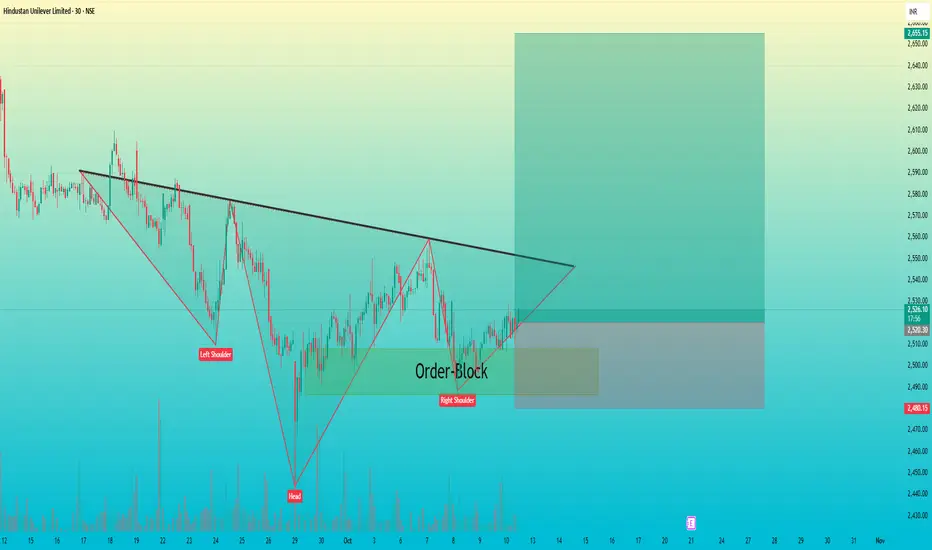
HINDUNILVR : Inverse Head & Shoulders + Order-Block setup Technical Analysis: Hindustan Unilever Ltd
Timeframe: 30-Minute
Pattern: Inverse Head & Shoulders with Order Block Confluence
Pattern Insight
The market has created a clear inverse head and shoulders structure —
showing potential trend reversal from a short-term downtrend to an uptrend.
The neckline is acting as dynamic resistance.
Price is consolidating inside a bullish order block, confirming demand presence.
Order Block Zone
The highlighted green zone around ₹2,485–₹2,505 represents an institutional order block.
Price respected this zone on the right shoulder, showing strong accumulation by buyers.
Trade Plan
Entry: CMP
Stop Loss: ₹2,480
Target: ₹2,650
Risk–Reward Ratio: 1:3
USDCHF - TREND REVERSAL CONFIRMEDSymbol - USDCHF
USDCHF is confirming a reversal of its prior downtrend and appears poised to transition into a distribution phase, supported by strength in the US Dollar Index.
The dollar is currently breaking through resistance and may continue its bullish correction within the broader long-term downtrend. Against this backdrop, the Swiss franc is gradually losing momentum.
The currency pair is exhibiting signs of a local trend breakout, with the breach of the ascending triangle’s resistance level reinforcing bullish sentiment. Within this developing distribution phase, the price may attempt to retest recent local highs.
Resistance levels: 0.8071, 0.8132
Support levels: 0.8000
A sustained consolidation above 0.8000 could establish an intermediate base, offering additional support for bullish continuation in the next upward movement.

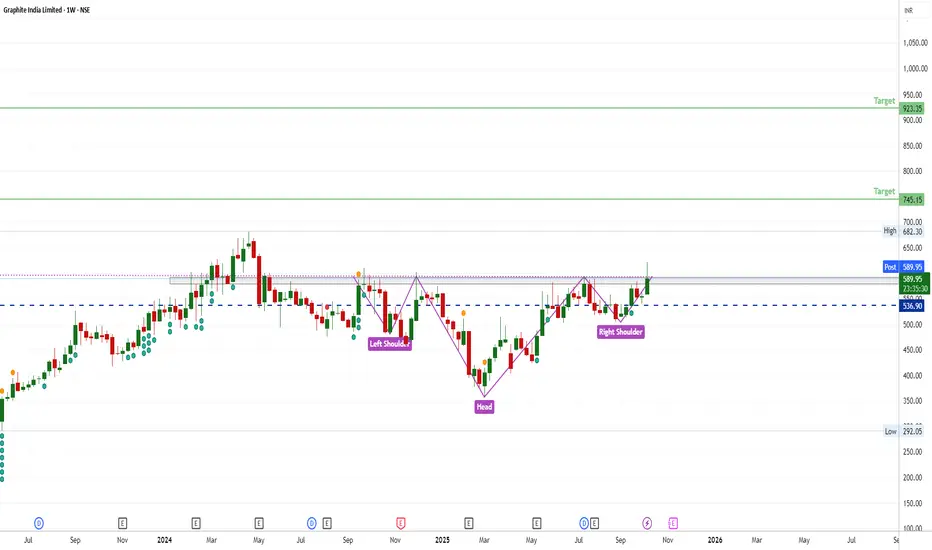
Long time Breakout Head and Shoulder🧩 Pattern Overview
Left Shoulder: Formed when price fell from around ₹620 to ₹500, then bounced back.
Head: A deeper decline down to around ₹420 before recovering — marking the lowest point of the pattern.
Right Shoulder: A smaller dip to around ₹500 before price rose again.
Neckline: The resistance zone connecting the peaks between the shoulders (around ₹590–₹600).
📈 Current Situation
The price has just broken above the neckline (~₹590) — this confirms a bullish breakout of the inverse H&S pattern.
The breakout candle shows strong buying interest.
🎯 Target Projections
Target 1: ₹745 — conservative, measured from the neckline to head distance projected upward.
Target 2: ₹923 — extended target if momentum sustains.
🧠 Interpretation
The breakout suggests a shift from bearish to bullish trend.
Ideally, watch for a retest of neckline (₹590 zone). If it holds and price bounces, it strengthens the move.
Volume confirmation is key — strong volume on breakout adds reliability.
Only You can make you ProfitableThose who have been in the trading world for some time must have realized by now that Profitable trading isn’t just about charts and indicators, it’s mostly about Yourself.
We may have the cleanest setup, perfect RSI levels, and all your EMAs aligned like planets, and still lose money😢
Because charts do not control your hand on the mouse or keyboard buttons, only you do.
The real problem usually is not the entry or the indicators.
It’s
Impatience,
Overconfidence,
Revengeful trading,
Need more confirmation
before hitting the buy button.
These habits grow over time if not realized and controlled at the very beginning, lead to more and more losses.
Indicators can give you an edge. But they can’t stop you from cutting winners too soon or holding losers too long. You need to first plan and then execute it religiously.
Trading doesn’t test your strategy; it tests your discipline.
And honestly, that’s what makes it both frustrating and fascinating.
What do you think?
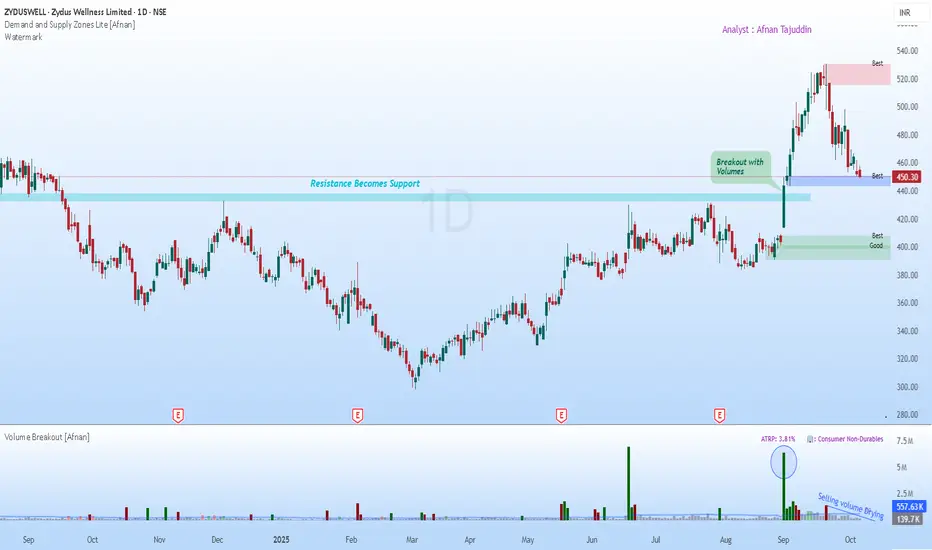
Powerful Setup & Art of the Pullback: Supply & Demand Concept📊 Supply & Demand View 📊
When you look closely, supply and demand zones are essentially the fingerprints of institutional activity. Big players rarely dump or buy entire positions in one shot—they stagger their trades, leaving behind identifiable imbalances on the charts. Every time price revisits these zones, it tends to react sharply.
Take Zydus Wellness as a clear example of this dynamic. After an impressive rally to a fresh all-time high, a predictable wave of profit-taking emerged, carving out a new supply zone at the top. This is the moment where sellers stepped in decisively, nudging prices down in a healthy correction. These zones aren’t just lines or boxes on a chart—they mark areas where significant buying or selling has historically occurred, often foreshadowing price reversals.
Now here’s where it gets interesting: price is at strong demand zone, And this isn’t just any support level—this is the very origin of the rally that shattered all previous resistance and propelled the stock to its highs. Areas like this tend to hold clusters of unfilled buy orders, meaning a return to this level often triggers a meaningful bounce as buyers re-enter the fray.
🚀 Classical Chart View 🚀
From a more traditional technical lens, the story remains bullish. The chart highlights a key resistance that had capped price for some time. When this level finally broke, it wasn’t subtle—volume spiked, signaling strong conviction from major market participants.
This is a textbook “resistance becomes support” scenario. The price is now retesting this old barrier. What makes this retest particularly noteworthy is the noticeable drop in selling volume during the pullback. This drying of volume suggests sellers are losing momentum, making it more likely that the pause is temporary rather than a reversal. The convergence of this retested resistance with a high-quality demand zone creates a compelling setup for the next move higher.
✨ Final Takeaway ✨
Both perspectives are telling a consistent story. Supply and demand analysis highlights a prime zone for buyers to re-engage, while classical technical confirm the strength of the underlying trend. The price has already found a foothold at the Best Quality Demand Zone, which could very well act as the springboard for the next leg of the rally. For anyone considering a position, a stop-loss below 430 provides a sensible buffer beneath this structural support.
💡 Risk Management Reminder 💡
Even the cleanest setups aren’t guarantees. Stick to your risk rules, size positions carefully, and maintain a disciplined stop-loss. Remember—the goal is to protect capital, not to perfectly predict the market.
“The art of trading is not about being right all the time, but about losing less when you are wrong.”
🔄 Patience and discipline win more often than bold predictions. 🔄
This analysis is for educational purposes only and should not be interpreted as trading advice. I’m not a SEBI-registered analyst.
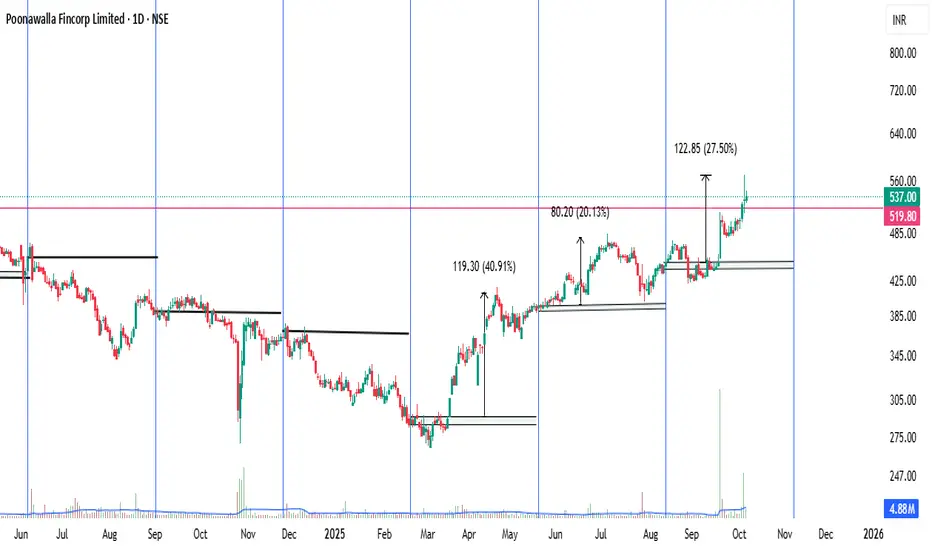
Poonawalla Fincorp (POONAWALLA)Poonawalla Fincorp Limited (NSE: POONAWALLA), a non-banking financial company (NBFC) under the Cyrus Poonawalla Group, focuses on consumer and MSME lending, including personal loans, vehicle finance, and supply chain financing. As of October 7, 2025, the stock trades around ₹565, up ~8% in the last session and ~76% year-to-date (YTD), significantly outperforming the Sensex's ~4% gain. This momentum stems from robust operational growth, promoter confidence, and technical strength. Below, I'll outline key reasons to consider it, based on recent financials, market analysis, and sentiment. Note: This is not financial advice—always conduct your own due diligence, as NBFC stocks can be volatile due to interest rate sensitivity and credit risks.
Explosive Growth: AUM up 67.7% YoY to ₹47,625 Cr, with 35-40% growth expected in FY26.
Promoter Confidence: ₹1,500 Cr infusion, promoter holding at 62.5%.
Strong Financials: ₹6,200 Cr liquidity, 11% NII growth, low credit costs.
Bullish Technicals: Breakout above ₹480, targets ₹620-₹650, RSI at 73.
Market Edge: Retail credit boom, AI-driven lending, positive X sentiment.
Risks: Profit dip (one-off), rate sensitivity, high valuation. Watch Q2 results (Oct 17).
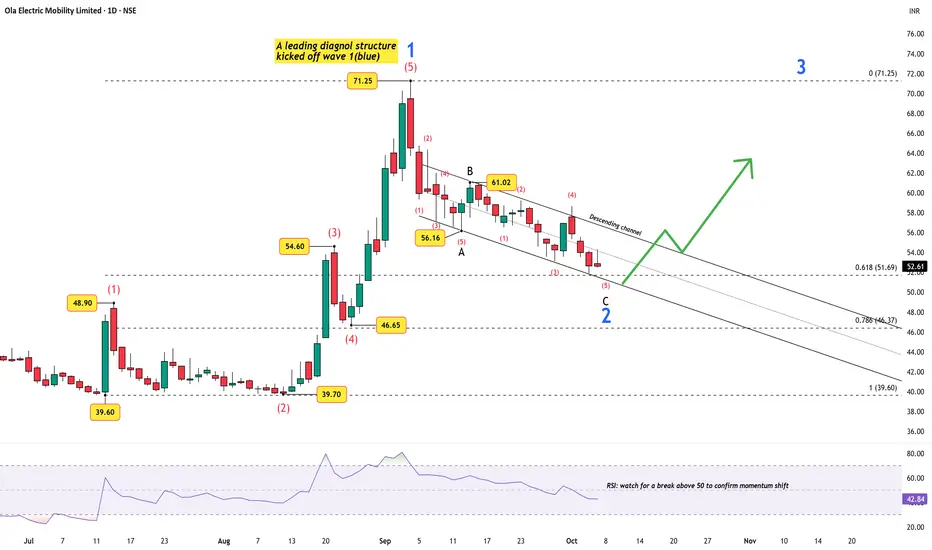
Charging Up for Wave 3 — Ola’s Motor Just Got Certified!The electric vehicle (EV) space in India is heating up again — and Ola Electric seems to be quietly positioning itself for the next leg of growth. The company’s recent government certification for its in-house ferrite motor marks an important milestone: a domestically designed motor that avoids costly rare-earth materials, potentially boosting margins and cutting import dependence.
This development strengthens Ola’s role in India’s push toward self-reliant, cost-efficient electric mobility, just as the market eyes the next growth phase in EV adoption.
Technically, the stock appears to be cooling off after its first strong impulse. The chart reveals a leading diagonal structure kicking off Wave 1, followed by a Wave 2 correction unfolding as a 5-3-5 zigzag inside a descending channel . Price now hovers near the 0.618 to 0.786 Fibonacci retracement zone (₹51–₹46) — historically a prime setup area before a potential Wave 3 expansion.
The RSI near 43 suggests downside momentum is fading, but the confirmation cue will be a break above 50 , signaling a shift in control to buyers.
In short: fundamentals are recharging while the technical battery is nearly full. Accumulation makes sense only once either
price dips toward ₹46–₹47 (deep retracement pocket), or
A breakout from the descending channel confirms that Wave 3 is ready to drive the next rally.
For now, Ola’s story is less about “if” and more about “when.”
Disclaimer: This analysis is for educational purposes only and does not constitute investment advice. Please do your own research (DYOR) before making any trading decisions.