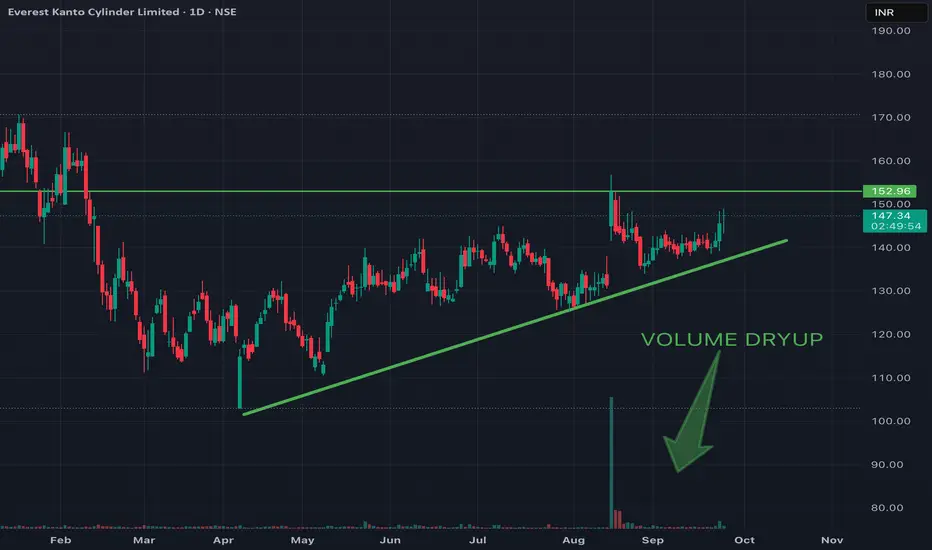
EKC LOOKING GOOD FOR 10-20% MOVE1. Volume dry-up near breakout zone.
2. Trendline Support.
3. Price sustaining at above levels and ready to move upwards from demand zone.
4. Easy 10-20% move possible.
Community ideas
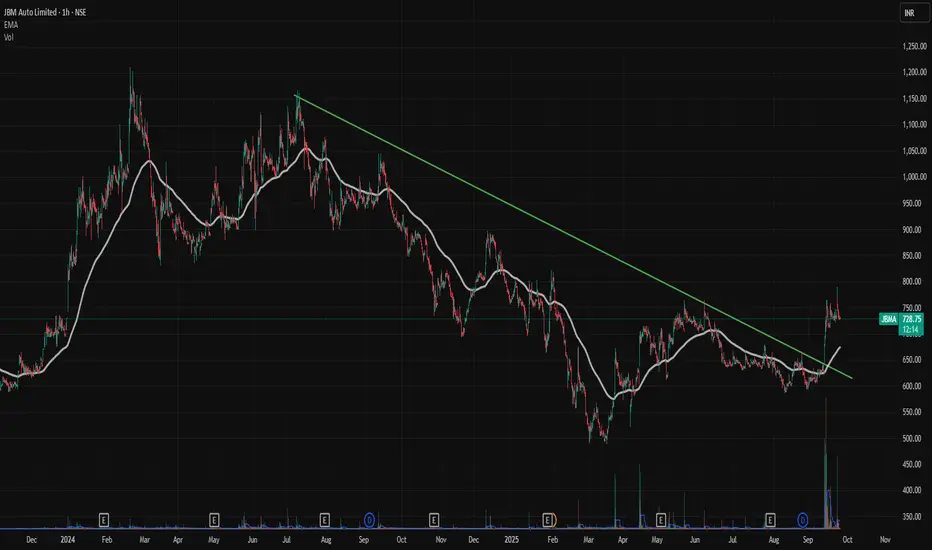
Gapup breakout in JBMAA good good gap up in JBMA.
Very healthy volumes showing up.
Very good time to enter as consolidating after gapup
Trendline breakout also.
good setup
can enter on 1 hr time frame
Risk to Reward ratio 1:2 or higher .
Thank u
Abdul Maajid Gouri
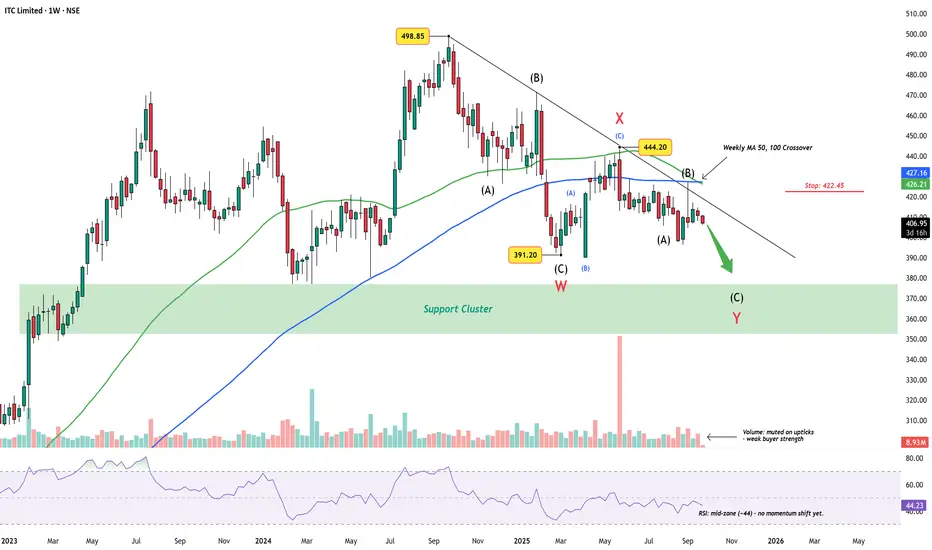
ITC Limited Weekly Chart – Wave Y Targets Support ClusterITC has been trending lower since the ₹498.85 peak, carving out what appears to be a complex W-X-Y correction. The first leg (W) found support near ₹391.20, followed by a corrective bounce into X at ₹444.20. The decline since then has kept price under a descending trendline, respecting the larger corrective rhythm.
Wave Count
Wave W: Completed into the ₹391.20 low.
Wave X: Counter-trend rally capped at 444.20.
Wave Y: Now unfolding, with sub-wave (C) still incomplete.
The broader structure hints that ITC may continue toward the support cluster (₹350–375) before this correction runs its course.
Indicators
Volume : Muted on upticks – rallies lack buying strength.
RSI (~44) : Mid-zone, leaving space for further downside before oversold conditions.
Weekly 50/100 MA crossover : Adds weight to the ongoing corrective bias.
Invalidation
A decisive break above ₹422.45 and sustained strength beyond 427 would question this bearish view, hinting at a possible shift back to bullish sequences.
Summary
Unless ITC reclaims higher ground above 422.45, the bias stays toward a Wave Y completion in the support cluster zone.
Disclaimer: This analysis is for educational purposes only and does not constitute investment advice. Please do your own research (DYOR) before making any trading decisions.
Tanla Platforms : Inverted Head & Shoulder in making Tanla Platforms is forming a inverted head and Shoulder pattern right shoulder . On Friday last week , the stock is just around the neckline .
The Stock just started holding above 50 and 200 DMA.
RSI daily reading is above 70 indicating a positive momentum.
Need to be watchful in next week , if the stock sustains above 760 could fuel price up move.

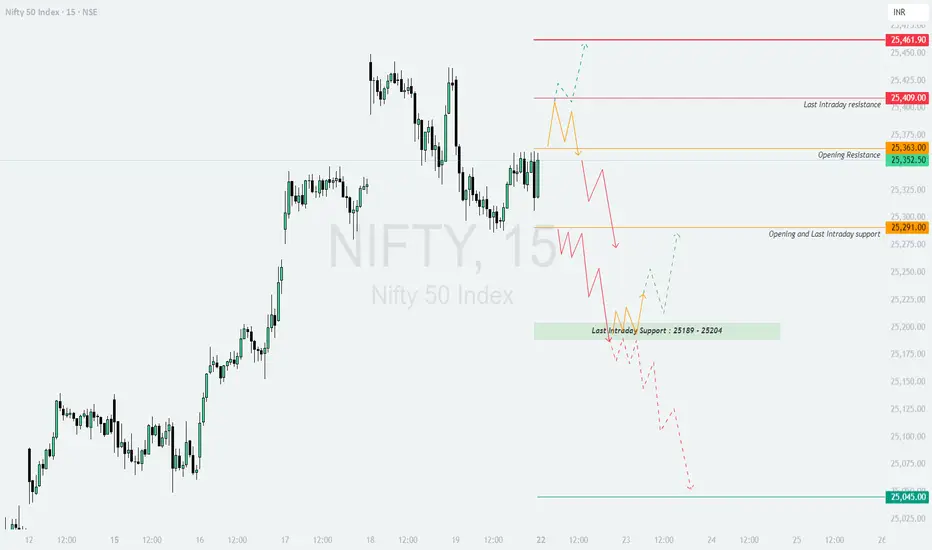
NIFTY : Trading levels and Plan for 22-Sep-2025NIFTY TRADING PLAN – 22-Sep-2025
The index closed around 25,352, with immediate opening resistance at 25,363, and higher hurdles near 25,409 (last intraday resistance) and 25,461. On the downside, supports are placed at 25,291 (opening/last intraday support) and the 25,189–25,204 zone. The critical lower support is seen at 25,045.
Considering a gap opening threshold of 100+ points, let’s break down the intraday scenarios:
🚀 Gap Up Opening (100+ points above previous close)
If Nifty opens strongly above 25,450–25,461, it will enter a bullish zone.
Sustaining above 25,461 can fuel momentum towards 25,525–25,600. Option traders can look for call buying opportunities with strict stop-losses.
However, if rejection candles appear near 25,461, profit booking may drag Nifty back towards 25,409–25,363. This would offer a counter-trade opportunity for cautious intraday shorting.
Risk control is essential here: wait for 15–30 minutes confirmation after gap-ups to avoid false breakouts.
⚖️ Flat Opening (near 25,300–25,350 zone)
If Nifty opens flat, then 25,363 (resistance) and 25,291 (support) become immediate reference points.
A decisive breakout above 25,363 can push prices towards 25,409 and further to 25,461. Sustaining beyond this level confirms bullish continuation.
On the other hand, if Nifty fails to cross 25,363 and slips below 25,291, then weakness may extend towards 25,189–25,204 zone.
This setup is best suited for breakout traders who can wait for price confirmation before entering directional trades.
📉 Gap Down Opening (100+ points below previous close)
If Nifty opens sharply below 25,200, it will test the last intraday support zone of 25,189–25,204.
A bounce from this zone can trigger a quick pullback rally towards 25,291–25,363.
But if the index sustains below 25,189, then deeper downside towards 25,045 becomes highly probable. In such a case, put options could provide high reward trades, but strict stop-loss is a must since sharp pullbacks often occur at key supports.
🛡️ Risk Management & Option Trading Tips
Always allow the first 15–30 minutes to set direction before entering.
Use hourly candle close as confirmation for breakout trades.
In gap scenarios, avoid aggressive chasing; instead, wait for retests of key levels.
Maintain at least a 1:2 risk-reward ratio for consistency.
Limit position sizing in options as premiums erode quickly due to time decay.
📌 Summary & Conclusion
Above 25,461, Nifty may head towards 25,525–25,600 🚀.
Flat openings will keep focus on 25,363 (resistance) and 25,291 (support) ⚖️.
Below 25,189, bearish momentum may extend towards 25,045 📉.
Patience and disciplined execution around these levels can provide the best trading opportunities.
⚠️ Disclaimer
I am not a SEBI-registered analyst. This analysis is purely for educational purposes. Please consult with your financial advisor before making any trading decisions.
Positive moves on beaten down stock(Adani Green)Posititive news has come for the adani group from higher court. Adani Green is beaten down stock(may be not because of news flows but because of valuation). But now buying is there from the lower levels.
Valuations have come down in last 2-3 years(however still expensive valuation). But may be this much high valuation can be sustainable because of the big brand house.

Sigachi’s Technical Surge: Next Resistance in SightOver the past month, Sigachi traded within a well-defined consolidation range, reflecting a period of equilibrium between buyers and sellers. However, in the most recent week, the stock decisively broke out above this consolidation zone on increased trading volume a classic signal of renewed bullish momentum and heightened market interest.
From a trend perspective, the stock has managed to close above all key daily EMAs. Notably, a bullish crossover between the 20-day and 50-day EMAs has emerged, which is often interpreted by technical analysts as a sign of strengthening upward momentum.
Momentum indicators further reinforce this view. The RSI is currently above 75, placing the stock firmly in the overbought territory. While such elevated RSI levels can sometimes precede short-term corrections, they also reflect strong underlying demand during robust uptrends. This bullish sentiment is further supported by a MACD crossover on the weekly chart, which typically signals a continuation of upward price action.
At present, the stock is encountering a minor supply zone (as marked on the chart), which may serve as a near-term resistance. Should the price retrace and find support at the previously identified demand zone, the next potential resistance level is observed around ₹56 .
Disclaimer: This analysis is intended solely for educational and informational purposes. It does not constitute investment advice or a recommendation to buy, sell, or hold any financial instrument. Market conditions are dynamic, and trading decisions should be made based on individual research, risk tolerance, and consultation with a licensed financial advisor.

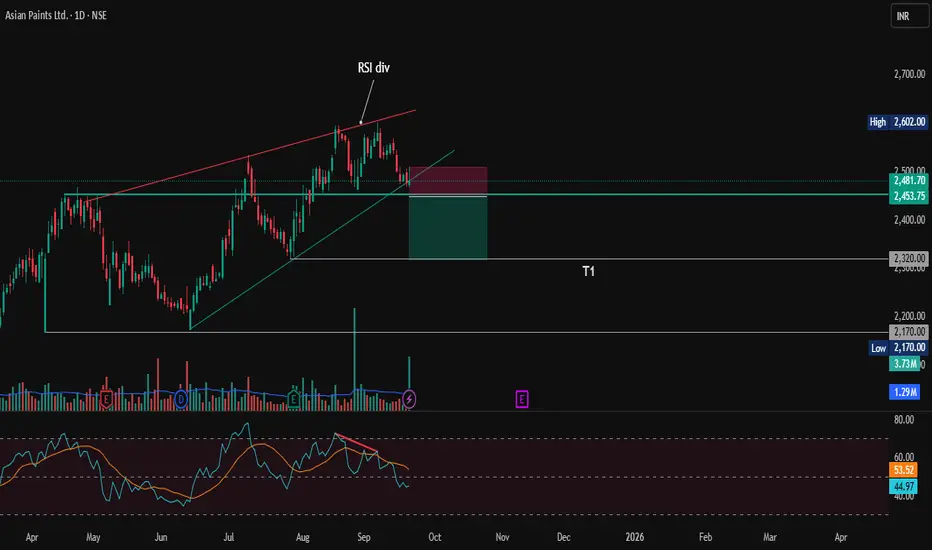
Asian Paints: Short Setup — Bearish Reversal SignalAsian Paints shows signs of a potential short opportunity after forming a bearish reversal pattern (Rising wedge) on the daily chart. The stock failed to sustain above the resistance near 2600, Formed a Double top pattern. The RSI is showing bearish divergence, signaling weakening momentum. hinting at a possible downtrend initiation.
Key Levels to Watch:
Immediate support at 2450 (swing low)
Further downside target around 2320 if support breaks decisively
Trade Plan:
Enter short below 2450 on confirmation of bearish candle close.
Stop loss above 2500 to limit risk from false breakdown.
Target 2320 for conservative exit or trail stop as price moves lower.
Disclaimer: Risk management is crucial in this volatile market, so keep position sizing appropriate. This analysis is intended for educational purposes and not financial advice.
Market Cycles I have made efforts in Explaining How Markets work in cyclical basis
once The bull Run completes , Market ideally enters in Price & Time Corrections
which enter in one of two know phases
01) Deep Price Corrections
02) Bracketed Market Price corrections
This is education content if you have any Questions Please feel free to comment I will try to address them
Thanks

JSWSTEEL TRENDLINE BREAKOUTJSWsteel breaking trendline resistance weekly basis
good volume last few weeks
bullish RSI above 60
trading at al time high
can reach to target 1250 soon
NO BUY/SELL RECOMENDATION

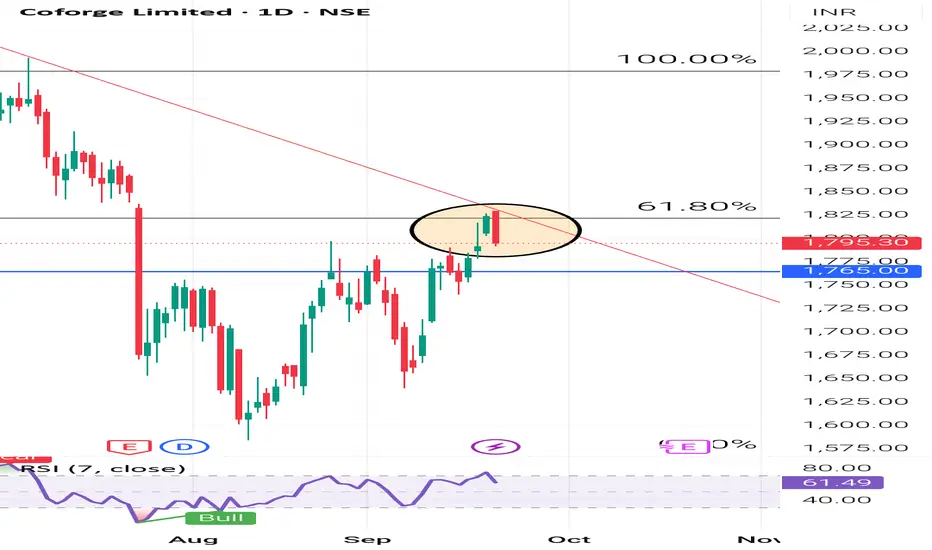
COFORGE LIMITED ( 1D ) 🔑 KEY LEVELS 🔑
✔ Fibonacci Retracement 61.80%
✔ Trend Line Act As Resistance.
✔ RSI Also Overbought Zone.
🎯 TRADING PLAN 🎯
✔ Near the key levels , Bearish Engulfing
Candlestick Pattern has formed.
✔ The Entry Point is Below @ 1792.10
✔ The Stoploss Point is @ 1830.00
✔ The First Target is @ 1681.00
✔ The Second Target is @ 1601.00
💡 Never, ever argue with your trading
System.
Disclaimer : Educational & Informational
Purpose Only. Not a Buy / Sell
Recommendation.
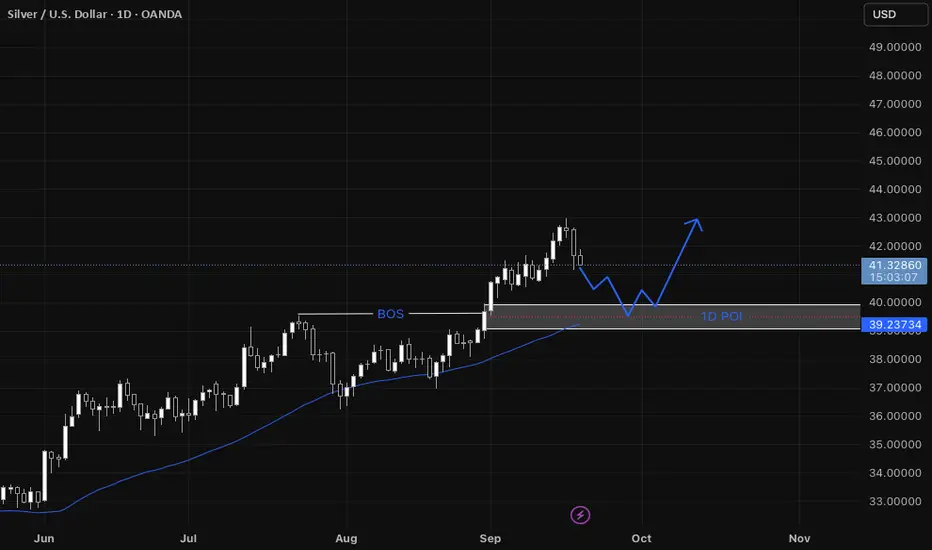
XAGUSD Step-by-step entry plan for XAGUSD
1. We have our Daily Point of Interest (POI)
- On the daily a zone that contains:
* a fair value gap (FVG),
* a break of structure (BOS) that previously acted as resistance and is now expected to act as support, and
* support from the 44 SMA.
2. Wait for price to return to the Daily POI
- Only consider the setup if price actually comes back into that daily POI zone.
3. Switch to the 1-hour timeframe to refine the entry
- Look for a shift in structure on the 1-hour (i.e., evidence that momentum is shifting bullish: BOS to the upside, higher highs/higher lows).
4. Confirm a 1-hour fair value gap forms
- The structure shift on 1-hour should create a 1-hour FVG (a short intraday imbalance).
5. Wait for the 1-hour FVG to be filled
- Let price fill that 1-hour FVG (price moves into/through the gap).
6. Look for a bullish confirmation on the filled 1-hour FVG
- After the fill, require a clear bullish formation on 1-hour (examples: bullish engulfing candle, strong demand candle, a higher-low + rejection wick).
7. Enter on the 1-hour bullish confirmation
- Enter when price breaks the confirmation level (e.g., breaks above the local 1-hour high formed by the bullish setup) or on a confirmed bullish candle close per your entry rules.
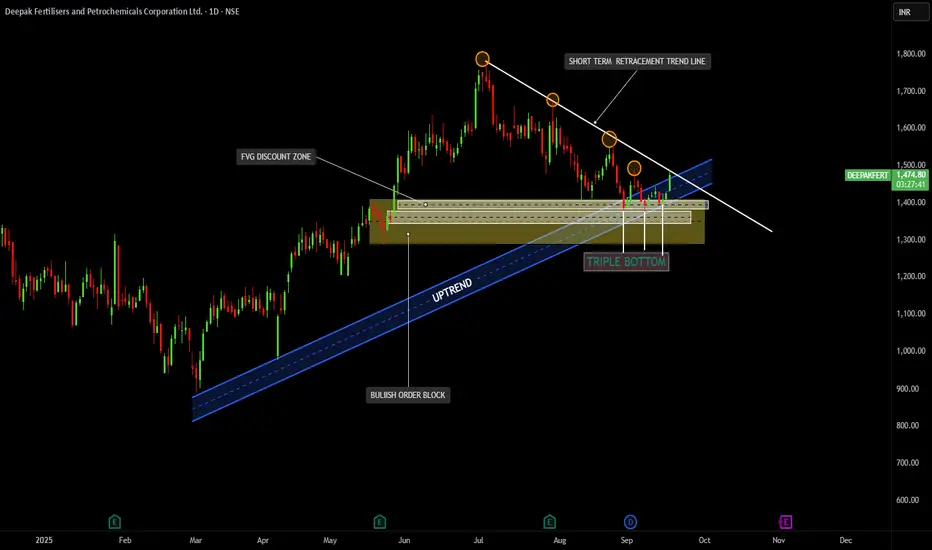
DEEPAK FERTILIZERTrend Structure:
The stock has been in a primary uptrend (marked with the blue ascending channel).
Recently, it went into a short-term retracement with a downward sloping trendline (white).
Support & Demand Zones:
Strong Bullish Order Block and FVG Discount Zone around the ₹1350 – ₹1400 level, where buyers are stepping in.
Price formed a Triple Bottom at this support, indicating strong demand and rejection of lower prices.
Pattern & Candlestick Structure:
Triple Bottom is a reversal pattern confirming that sellers are unable to push below ₹1350.
Current candles show bullish momentum, reclaiming above the retracement trendline.
Breakout:
Price has broken the short-term retracement trendline on the upside, signaling a potential end to the correction.
Fresh momentum is visible with today’s +3.70% rise, closing near ₹1478.
Volume:
Breakout accompanied with decent volume (296K), strengthening the bullish signal.
🔹 Technical Outlook:
Bullish Bias: The combination of triple bottom support, order block demand zone, and trendline breakout suggests bullish continuation.
Immediate Resistance Levels: ₹1520 – ₹1560 (near-term supply zone).
Major Resistance: ₹1650 – ₹1700 (previous swing highs).
Support Levels: ₹1400 (strong demand zone), followed by ₹1320 if broken.
🔹 Trading View:
Aggressive Traders: Can look for long entries near ₹1450–₹1470 with a stop loss below ₹1400.
Conservative Traders: Wait for a daily close above ₹1520 to confirm strength before entering.
Targets: First target ₹1560, second target ₹1650–₹1700
HFCL BY KRS CHARTS17th September 2025 / 9:21 AM
Why HFCL?
1. First of all, its second time it's in my radar, previously we had more than 40% Return on this one and still long-term Target has been still loading 225 Rs.
2. 1M TF is making Higher High with current price level previously it breaks from flag pattern and gave upside move.
3. As we cand see in chart i have mentioned FVG range for 1M tf which was expected fall to be fill that FVG and it did.
4. Further, along with FVG filling 1W & 1D tfs is showing bullish divergence within range.
5. Volume is above avg with Morning Star Candle Breakout showing more bullish signs.
SL & Target is mentioned ‼️
** Attached Previous View on HFCL also go check it out**

Bharat Electronics Ltd. - Stock AnalysisDate : 16-Sep-2025
LTP : Rs. 402.90
Technical View:
• NSE:BEL is in primary uptrend since Apr 2025 and was recently going through it's secondary downtrend within primary uptrend.
• From it's all time high of 436 on 1-Jul-2025, it has retraced 17% to 361.20 on 28-Aug-2025 which is also close to Fibonacci retracement level 0.382 placed at 367.00.
• NSE:BEL has breakout from it's secondary downtrend with higher than average volume on 10-Sep-2025. Volume has also increased in last few sessions.
• NSE:BEL has closed above 20 DEMA and 50 DEMA on 10-Sep-2025 and is trading above 20 DEMA and 50 DEMA since last few sessions. 20 DEMA has also crossed over 50 DEMA on 16-Sep-2025.
• MACD has crossed over 0 and entered into bullish zone. It is trading at 2.58.
• RSI has crossed over 50 and trading in buy zone at 66.02.
• Looking good to start a new swing from here.
• Resistance Levels : (R1) Rs. 436 --> (R2) Rs. 480
• Support Level : Rs. 361
If you have liked this analysis, please Like/Boost this idea and follow me for more ideas.
Disclaimer : I am not a SEBI registered analyst/consultant and not recommending anyone to take any BUY or SELL position in stock market. Investing in stock market is risky and one should do a self analysis and validation before investing in stock market. My ideas are published for learning purpose only and are available to everyone at no cost/charge.

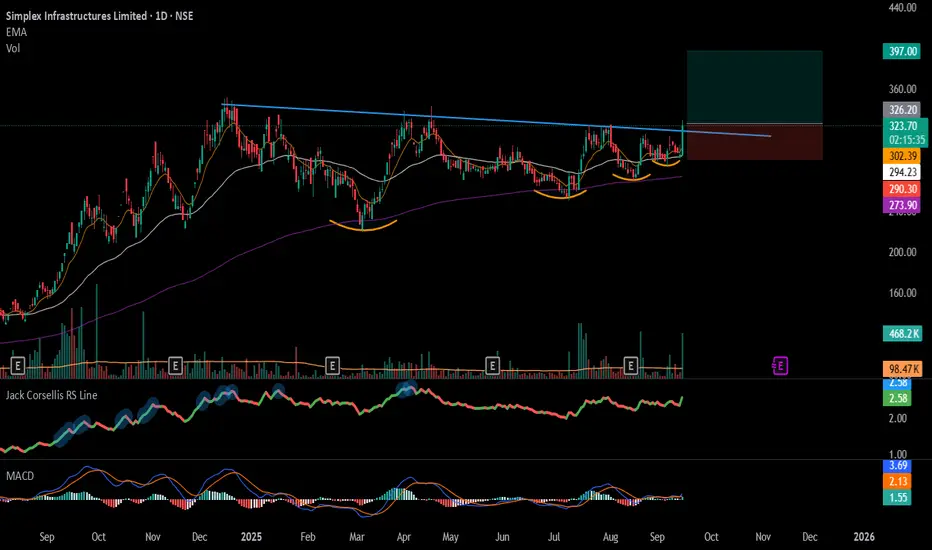
#SIMPLEXINF - TrendLine Breakout in Daily Time FrameScript: SIMPLEXINF
Key highlights: 💡⚡
📈 TrendLine Breakout in Daily Time Frame
📈 Volume spike during Breakout
📈 MACD Bounce
📈 Can go for a swing trade
BUY ONLY ABOVE 325 DCB
⏱️ C.M.P 📑💰- 322.25
🟢 Target 🎯🏆 – 22%
⚠️ Stoploss ☠️🚫 – 11%
⚠️ Important: Market conditions are Okish, Position size 50% per Trade. Protect Capital Always
⚠️ Important: Always Exit the trade before any Event.
⚠️ Important: Always maintain your Risk:Reward Ratio as 1:2, with this RR, you only need a 33% win rate to Breakeven.
✅Like and follow to never miss a new idea!✅
Disclaimer: I am not SEBI Registered Advisor. My posts are purely for training and educational purposes.
Eat🍜 Sleep😴 TradingView📈 Repeat 🔁
Happy learning with MMT. Cheers!🥂
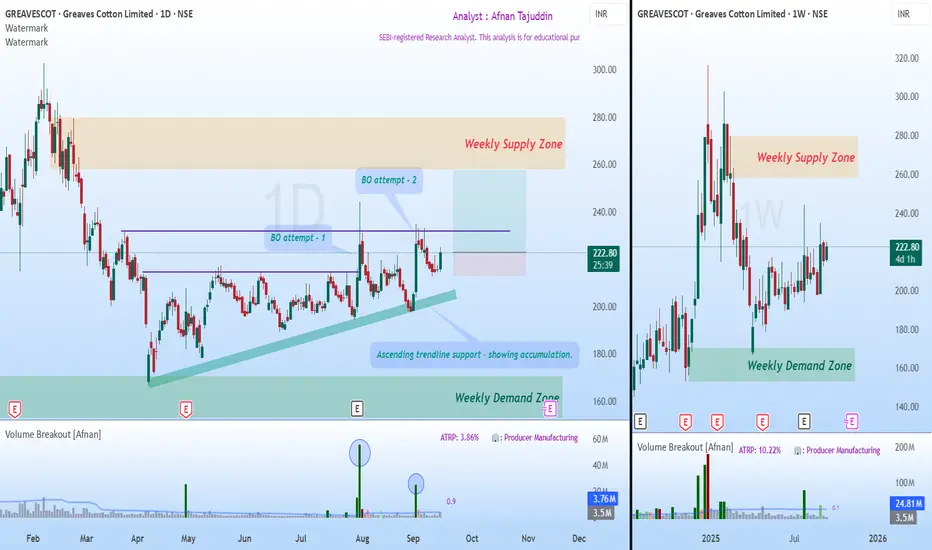
Accumulation and a Possible Breakout Towards Weekly Supply📈 Market Trend and Structure 📈
After forming an all-time high, price began its decline and developed a weekly supply zone . This supply zone now stands as the major target area for buyers.
Following the decline, price touched the weekly demand zone , which acted as a powerful reversal point . As supply-demand traders, this gave us a strong indication of the probable bottom.
From there, price recovered and moved into a phase of sideways consolidation , reflecting the tug of war between buyers and sellers.
⚡ Breakout Attempts and Trendline Support ⚡
During this consolidation, price attempted two breakouts with strong volumes . Both times, sellers stepped in aggressively at the horizontal resistance line.
Buyers, however, showed resilience by consistently defending an ascending trendline . This steady support is a sign of accumulation and growing demand.
Recently, price and volume contracted , forming an inside candle —a balance between buyers and sellers.
Today, this inside candle was broken to the upside, which could make this third breakout attempt successful.
🎯 Trading Plan 🎯
Bias: Bullish continuation.
Entry Trigger: Two previous breakout attempts + today’s breakout of the inside candle.
Target: Weekly supply zone.
Stop Loss: Below the previous swing low.
Risk-to-Reward: Approximately 1:3, a favorable setup.
✨ In Short : Sellers are still active near horizontal resistance, but buyers are showing greater strength at higher lows. The breakout of today’s inside candle tilts the balance towards buyers, making this the most promising pre-breakout setup so far.
🚀💡 “In trading, patience to wait and courage to act make all the difference.”
Lastly, Thank you for your support, your likes & comments. Feel free to ask if you have questions.
⚡ Stay disciplined, trade smart, and let the charts guide your story! 📊✨
This analysis is purely for educational purposes and is not intended as a trading or investment recommendation. I am not a SEBI registered Analyst.
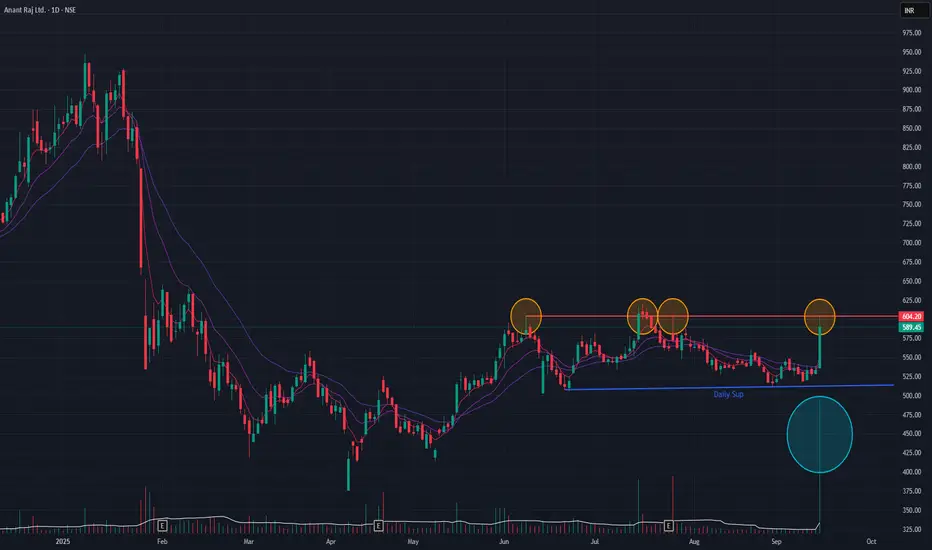
Anant Raj (Daily Timeframe) - Potential BreakOut candidate ??Following a downtrend that began in January 2025, Anant Raj has been in a sideways consolidation phase since May 2025. After several failed breakout attempts from this range, the stock demonstrated significant buying interest today, surging +10.53% on substantial volume.
While this move is positive, a cautious approach is recommended as the short-term Exponential Moving Averages (EMAs) have not yet registered a bullish positive crossover. The price action in the coming sessions will be critical for confirmation.
A sustained breakout above the consolidation channel could pave the way for further upside, with a potential short-term target of ₹667.
bankniftyI feel that bank nifty and axis bank has shown good recovery in the past two weeks. With axis bank closing over 200 dma and with strong gains for last three days, the momemtum should continue. Good time to buy for investors and traders as one can go positionally long here with targets of 1140 and 1220 on axis bank. no stoploss for nifty large cap stocks for investors.

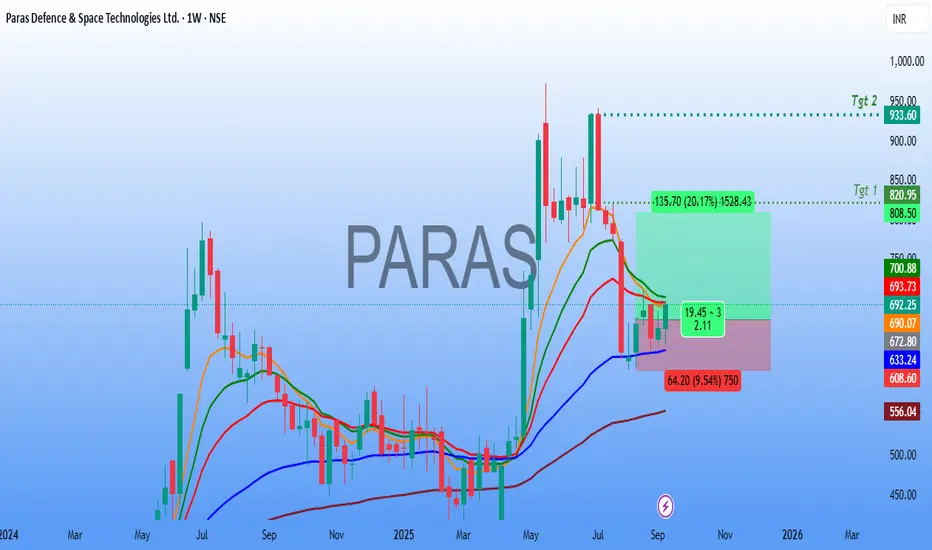
Paras Defence Technical Analysis🚀 Paras Defence & Space Technologies Ltd – Weekly Chart Analysis
The stock is showing signs of a potential reversal after consolidating near key support zones.
🔎 Technical Observations
Price Action:
After a prolonged decline from the highs, the stock has stabilized around the ₹640–660 support region. The recent weekly candle indicates buying interest, with bulls defending key support levels.
Sustained strength above the ₹700 zone can accelerate momentum towards higher levels.
Risk–Reward Setup:
The chart shows a favorable long setup with a potential upside of 20–35%.
📌 Trading Plan
Entry Zone: ₹680 – ₹700
Stop-Loss: ₹640 (weekly close basis)
Target 1: ₹820 – ₹825
Target 2: ₹930 – ₹950
⚠️ Key Notes
The ₹640–650 zone is acting as a strong support; holding this level is crucial for the bullish setup.
A breakout above ₹700 with volume confirmation will strengthen the momentum towards Target 1.
📢 Conclusion
Paras Defence is forming a bullish setup on the weekly timeframe with a good risk-to-reward ratio. If the stock sustains above ₹700, a strong move towards ₹820 and later ₹930+ looks possible. Traders should keep a strict stop-loss at ₹640 to protect capital.
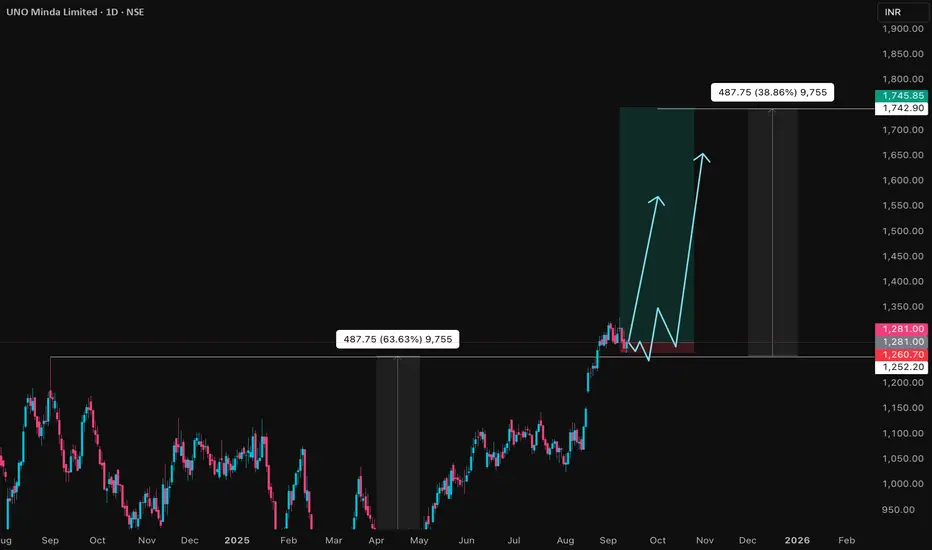
UNOMINDA Price ActionUNO Minda Ltd is trading at ₹1,282 as of September 12, 2025, delivering consistent financial and operational outperformance. For FY25, the company posted consolidated revenue of ₹16,775 crore, up 20% year-on-year, with net profit rising 9% to ₹936 crore. EBITDA grew 18% to ₹1,800 crore, and operating margins remain stable at 10.7%. Recent quarterly profit after tax is ₹289 crore, and EPS for the last twelve months stands at ₹13.97.
Expansion in premium switches, alloy wheels, lighting, sensors, sunroof products, and emerging EV technologies has bolstered top-line growth. Strategic projects—including new capacities for four-wheeler EV components and ADAS products—support a robust future pipeline, while strong cash flows enable ongoing fundraising and project commissioning.
Valuation remains at a premium to the sector, with trailing P/E around 79, price-to-book of 13, and price-to-sales ratio of 4.2, reflecting leadership in innovation and rapid growth. Return on capital employed is healthy at 15.7%, and debt remains modest, sustaining investor and institutional confidence. Technically, the stock is just below its 52-week high and continues to outperform broad market indices, maintaining an upward momentum trend.
Promoter and institutional holding are stable, affirming long-term commitment, and a final dividend of ₹1.50 per share was declared for FY25, rewarding shareholders alongside growth investments. UNO Minda’s medium- and long-term outlook remains highly constructive, anchored by strong financials, prudent capital allocation, innovative leadership, and a resilient growth trajectory.
EMA vs SMA vs WMA: Which Moving Average Should You Use?🔎 Intro / Overview
Moving Averages remain one of the most trusted tools in technical analysis. They smooth price action, highlight the trend, and often act as dynamic support or resistance.
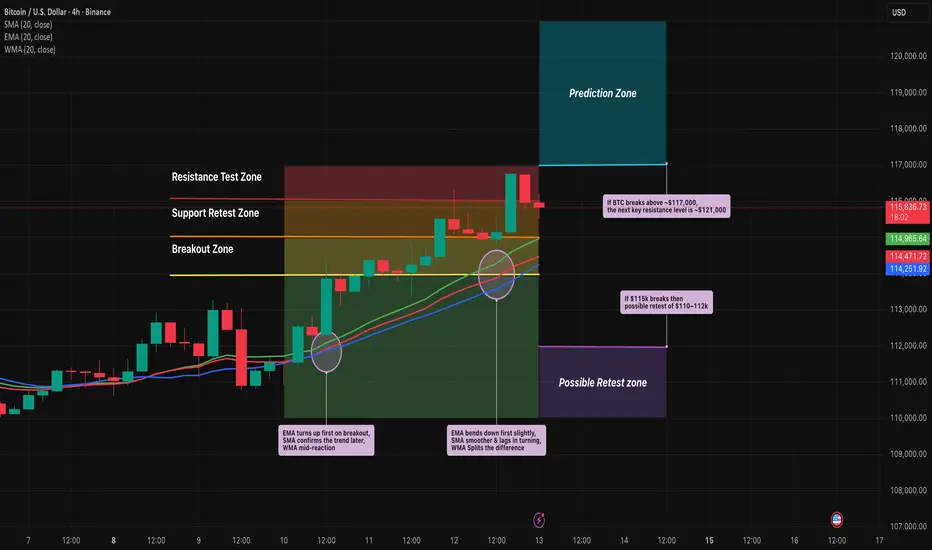
In this post, we compare the 20-period SMA, EMA, and WMA on BTCUSD 4H to show how each reacts differently to market moves.
___________________________________________________________
📔 Concept
SMA (Simple Moving Average): Every candle in the lookback is weighted equally → smooth but slower to react.
EMA (Exponential Moving Average): Recent candles carry more weight → reacts faster, hugs price closely.
WMA (Weighted Moving Average): Linear weighting → a balance between SMA’s stability and EMA’s sensitivity.
The difference lies in responsiveness. Faster averages react early but risk false signals, slower averages confirm trends but lag.
___________________________________________________________
📌 How to Use
1️⃣ Plot the 20-period SMA, EMA, and WMA together.
2️⃣ Watch how each responds during pullbacks, rallies, and consolidations.
3️⃣ Use EMA for quicker signals, SMA for smoother long-term view, and WMA if you prefer a middle ground.
4️⃣ Combine with price action or RSI to avoid relying on moving averages alone.
___________________________________________________________
🎯 Trading Plan
Intraday traders: EMA crossovers (e.g., 9 vs 21 EMA) for faster entries and exits.
Swing traders: SMA for identifying trend direction and major support/resistance.
Balanced traders: WMA for medium-term setups where stability and responsiveness matter equally.
Always align the moving average with your trading style and risk appetite.
___________________________________________________________
📊 Chart Explanation
On BTCUSD 4H:
EMA (red) bent upward first during the $114k breakout, SMA (blue) confirmed later, and WMA (green) sat between them.
At the $115k retest, EMA dipped first, while SMA lagged.
At $116.5–117k resistance, EMA whipsawed but SMA stayed smoother.
Notice how these differences become clear during sharp pullbacks, quick rallies, and sideways ranges.
___________________________________________________________
👀 Observation
EMA is quick but noisy ⚡, SMA is calm but late 🕰️, WMA strikes a middle ground ⚖️.
___________________________________________________________
❗ Why It Matters?
Choosing the right moving average impacts how quickly you spot entries, confirm trends, and manage stop-losses. Understanding the differences helps traders adapt strategies to both trending and sideways markets.
___________________________________________________________
🎯 Conclusion
No single moving average is “best.” Each serves a purpose depending on the timeframe and style of trading. The key is consistency — choose one that aligns with your plan, test it, and apply it with discipline.
👉 Which one do you prefer in your trading — EMA, SMA, or WMA?
___________________________________________________________
⚠️ Disclaimer
📘 For educational purposes only ·
🙅 Not SEBI registered ·
❌ Not a buy/sell recommendation ·
🧠 Purely a learning resource ·
📊 Not Financial Advice
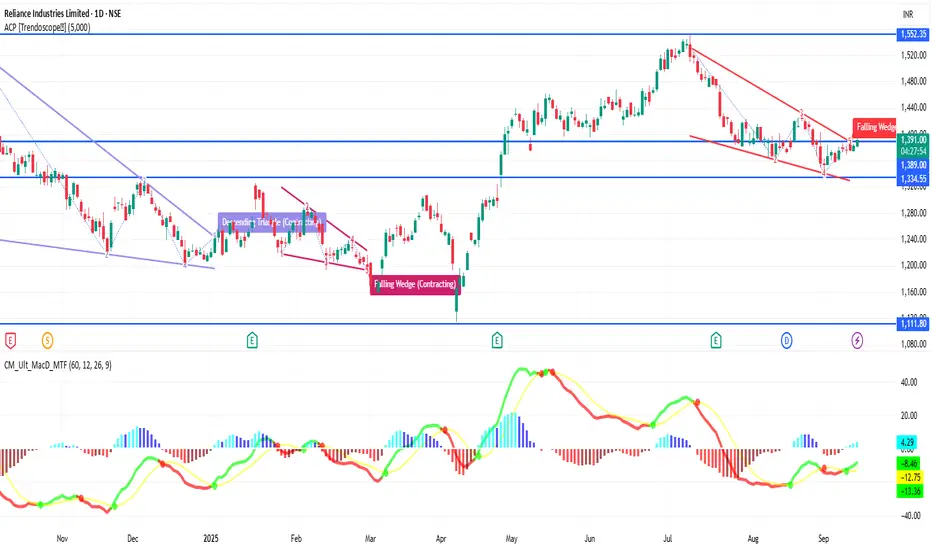
RELIANCE 1D Time frame🔢 Current Level
RELIANCE is trading around ₹1,391 – ₹1,392
🔑 Key Resistance & Support Levels
Resistance Zones:
₹1,392 – ₹1,396 (near-term resistance; breakout above this may lead to further upside)
₹1,400 (psychological resistance)
₹1,427 (stronger resistance above)
Support Zones:
₹1,380 – ₹1,385 (immediate support)
₹1,370 (short-term support; break below may indicate weakness)
₹1,350 (deeper support zone if selling pressure continues)
📉 Outlook
Bullish Scenario: If RELIANCE holds above ₹1,385, upward momentum may continue. Break above ₹1,396 can open the way toward ₹1,400+.
Bearish Scenario: If it falls below ₹1,370, risk increases toward ₹1,350.
Neutral / Range: Between ₹1,385 – ₹1,396, RELIANCE may consolidate before a directional move.