Indian Bank - VCP BreakoutAfter 4 months of Ascending Trend we saw two and half months of horizontal consolidation. This consolidation was formed by way of a volatility contraction pattern. What we have witnessed today is a break out from the vcp with volume suggesting it may not be a fakeout.
Educationalposts

NZDJPY – Imbalance + Liquidity Sweep + Mean Reversion SetupNZDJPY recently took out a major liquidity level around 90.907, sweeping the equal lows resting below that zone. This sweep created a fake breakout of structure, indicating that the downside move was engineered to capture liquidity rather than continue lower.
After the liquidity grab, price immediately reversed back inside the previous range, showing rejection from the sweep level. This confirms a liquidity sweep + BOS failure, a strong signal that the market is shifting direction.
Price is now correcting back toward its mean value, reacting to the inefficiencies left behind. There is a clear imbalance zone above, and price is actively rebalancing that inefficiency.
Furthermore, NZDJPY has an equilibrium structure near 90.20, which acts as a magnet for price during mean reversion phases. This equilibrium zone aligns with the discounted area of the current micro-range, creating a high-probability retracement target.

The Herd Mentality – Why Everyone Buys When It’s Too Late?Hello Traders!
You’ve seen it a hundred times, the market rallies, social media explodes, and suddenly everyone starts buying.
Then, just when retail traders feel “safe” entering, the price crashes.
It’s not bad luck, it’s herd mentality .
And unless you understand how it works, you’ll keep following the crowd straight into losses.
1. What is Herd Mentality in Trading?
Herd mentality is the instinct to do what everyone else is doing, buying when others buy, selling when others sell.
It’s rooted in human psychology, our brains feel safer when we’re part of a group.
In trading, this instinct is deadly because the crowd always reacts late.
When you feel comfortable entering a trade, it’s usually because the market has already moved.
2. The Cycle of Fear and Greed
Every bull run begins with a few smart traders who buy quietly when no one’s interested.
As prices rise, social media hype builds, the crowd starts joining in.
Then, when “everyone” is talking about the coin, smart money exits, leaving the herd trapped at the top.
The same happens in bear markets, panic selling at bottoms while professionals buy patiently.
It’s not about intelligence, it’s about emotion.
3. How the Market Exploits the Crowd
Institutions and big traders understand herd behavior better than anyone.
They create liquidity by pushing prices to levels where retail traders feel emotionally forced to act.
The market uses human nature, fear and greed, as its fuel.
The crowd provides the liquidity, and professionals use that liquidity to enter or exit quietly.
4. How to Avoid Becoming Part of the Herd
Develop your own plan, if your entry depends on others’ excitement, it’s not your setup.
Buy when the market feels uncomfortable; sell when everyone feels confident.
Learn to think independently. The best trades usually feel the hardest to take.
Patience and conviction are your weapons against the herd.
5. The Truth Most Traders Don’t Want to Hear
If you wait for social proof to feel confident, you’ll always be late.
By the time the crowd “believes,” the move is already priced in.
You don’t get rich by following others, you get rich by understanding why others behave the way they do.
Rahul’s Tip:
The market doesn’t punish retail traders because they lack knowledge, it punishes them because they act emotionally together.
Train your mind to do what’s uncomfortable, not what’s popular. That’s where the profit hides.
Conclusion:
The herd mentality is the silent killer of most portfolios.
The more people talk about an asset, the less opportunity it holds.
Smart traders buy silence and sell noise.
Once you learn to think independently, you’ll stop being the liquidity, and start trading like the ones who create it.
If this post opened your eyes to herd psychology, like it, share your view in comments, and follow for more deep market insights!
How to Identify Right Breakout Candle ? Stocks and Price actionI make educational content videos for swing / positional trading .
In this I am sharing some information out of the vast trading knowledge I have gained through my experience in the markets .
Charts used are older than 3 months

How to use Head n Shoulder / Inv. Head n Shoulder Chart Pattern.Hello Friends,
Welcome to RK_Chaarts,
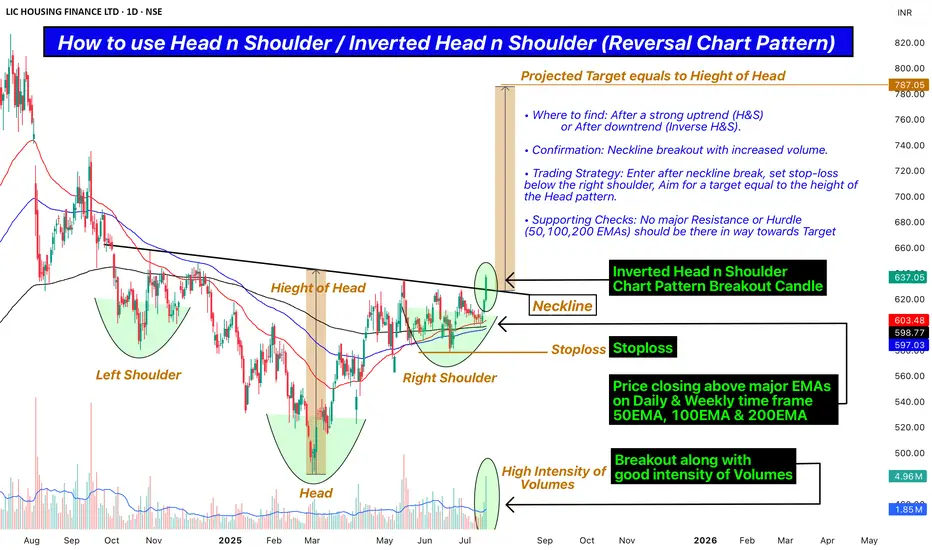
Today we are going to Learn how to use Head n Shoulder / Inverted Head n Shoulder (Reversal Chart Pattern) as a Professional Trader along with real terms to check, Confirm and apply.
• Where to find: After a strong uptrend (H&S) or After downtrend (Inverse H&S).
• Confirmation: Neckline breakout with increased volume.
• Trading Strategy: Enter after neckline break, set stop-loss below the right shoulder, Aim for a target equal to the height of the Head pattern.
• Supporting Checks: No major Resistance or Hurdle (50,100,200 EMAs) should be there in way towards Target.
This post is shared purely for educational purpose & it’s Not a trading advice.
I am not Sebi registered analyst.
My studies are for educational purpose only.
Please Consult your financial advisor before trading or investing.
I am not responsible for any kinds of your profits and your losses.
Most investors treat trading as a hobby because they have a full-time job doing something else.
However, If you treat trading like a business, it will pay you like a business.
If you treat like a hobby, hobbies don't pay, they cost you...!
Hope this post is helpful to community
Thanks
RK💕
Disclaimer and Risk Warning .
The analysis and discussion provided on in.tradingview.com is intended for educational purposes only and should not be relied upon for trading decisions. RK_Chaarts is not an investment adviser and the information provided here should not be taken as professional investment advice. Before buying or selling any investments, securities, or precious metals, it is recommended that you conduct your own due diligence. RK_Chaarts does not share in your profits and will not take responsibility for any losses you may incur. So Please Consult your financial advisor before trading or investing.
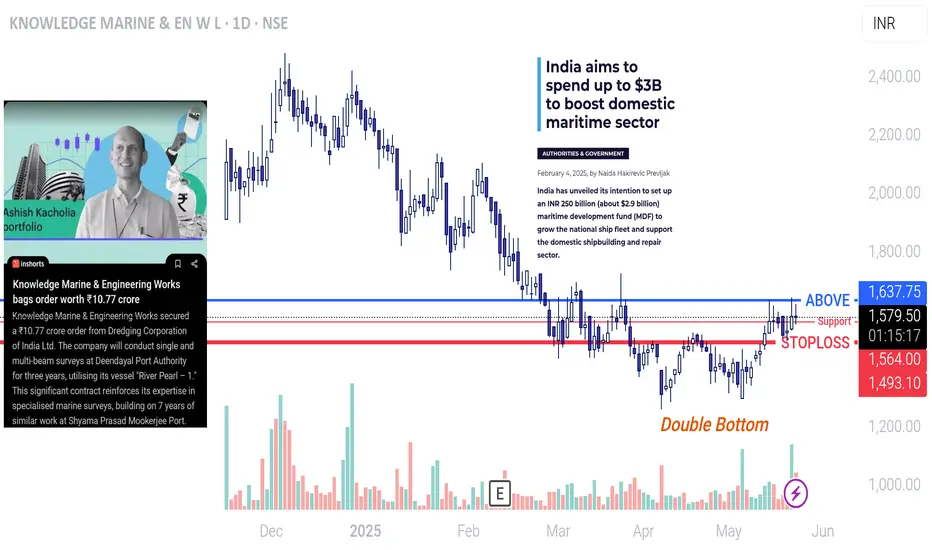
Knowledge Marine & Engineering WorksThe long-term financing plan for the maritime industry was presented by Union Finance Minister Nirmala Sitharaman on February 1, 2025.
As informed, the Government of India will contribute up to 49 percent to the fund, with the private sector, port authorities, financial institutions and other government entities covering the remainder of the sum. The financial assistance will be provided via equity or debt securities, according to the government.
Objectives of the new fund are:
Development of new and modernization of existing ports;
Financial aid for green shipping initiatives;
Investments in ship repair facilities to make India a global shipping hub;
Encouragement of technological innovation in maritime logistics & fleet efficiency.
As per the government, the MDF is primarily intended for financing ship acquisitions, in line with the country’s strategy to increase the share of Indian-flagged vessels to 20% by 2047.
What is more, the enriched domestic fleet would reduce dependency on foreign ships and improve the balance of payments, contributing to India’s strategic interests.
The Union Budget also provided a ‘shot in the arm’ to India’s domestic shipbuilding industry after it announced new mega shipbuilding clusters in the country in an effort to increase the range, categories, and capacity of ships. The proposed allocation of ₹6,100 crore ($700 million) aims to support India’s existing shipyards in upgrading, modernizing, and automating their operations, enhancing efficiency, utilization, and overall output.
Furthermore, the Union Budget has extended the Shipbuilding Financial Assistance Policy (SBFAP) 2.0, aimed at providing direct financial subsidies to Indian shipyards. This initiative seeks to help in securing orders by offsetting operational cost disadvantages, thereby strengthening the domestic shipbuilding industry.
“It is reassuring to see that the budgetary initiatives for India’s marine sector are focused on unlocking its vast potential and enhancing existing assets through upgrades, modernisation, and automation. A key highlight is our ministry’s development of new shipbuilding clusters of 1.0 to 1.2 Million Gross Tonnage (GT) each,” Sarbananda Sonowal, The Union Minister of Ports, Shipping & Waterways, commented.
“This strategic push is crucial in realising India’s vision of becoming a $30 trillion economy by 2047. By leveraging the Public-Private Partnership (PPP) model, the scheme is designed to attract private investment, promote modernisation, and advance green technologies. These efforts will enhance India’s global competitiveness, drive sustainable growth, and solidify its position as a leading Global Maritime Hub.”
Another innovative scheme announced in the budget is the shipbreaking credit note to promote the circular economy. This scheme incentivizes ship scrapping by issuing a credit note of 40% of the scrap value which can be reimbursed to buy new ‘Made in India’ ships.
Finally, large ships will be now accounted as infrastructure assets, enabling easy access to long-term financing and tax incentives. This will help attract private investments in the maritime sector and enhance fleet modernization, according to the government.
CreditAcess Grameen Standing near a crucial trendline support!Chart of Creditaccess is quite interesting.
Stock has a trendline support from which it has bounced multiple times in past.
Recently, stock has tried to bounce with very very very heavy volumes indicating big money getting exchange.
Given the history of the stock, we should at least expect 100% upside from this level. But it ccan also be a trap and stock can breakdown from here.
A safer level to watch is would be a weekly closing above 1110.
Support is 800 WCB for stock.
On upside, stock can go to 1480, 1710, 2000++
Very very risky. It can be a bottom fishing or a trap.
Idea shared for educational purposes only. We all should just watch what will happen from here and learn from it.

Potential Long Sector Turnaround - Nifty FMCG
Nifty FMCG has given a healthy correction of ~16% and is trading at a crucial make or break level.
Its following a broadening channel pattern and has reached the bottom level of the megaphone channel, which gives a favorable risk/reward ratio to initiate a position.
It has formed a head & shoulder pattern also, but its trading near the base of a major support level so the probability of this pattern turn around is low, this can potential lead to a trap which might be a favorable condition to initiate a long position, but as its a assumption position to be initiated with a strict SL if H&S pattern gets activated.
Long Position can be initiated in FMCG ETF once we gets a positive close or early entry can be initiated maintaining a strict SL.
Note: This is just for analysis purpose, please do your own research before punching any orders.
🔍 For more technical analysis and trade setups, make sure to follow me on TradingView

FMCG SECTOR - Overview | Educational PostWhy the FMCG Sector is a Must-Have for Long-Term Investment
- I am highly bullish on the Fast-Moving Consumer Goods (FMCG) sector, particularly in the context of a booming economy like India's This sector is fundamentally driven by the robust Indian consumption theme, which continues to expand rapidly due to the country’s growing middle class, increasing urbanization, and rising disposable incomes.
- For those looking to build a robust and resilient investment portfolio, the FMCG sector is indispensable. Its alignment with the Indian consumption growth story, coupled with its recession-proof nature, makes it a compelling long-term play. Including FMCG stocks in your portfolio can provide both stability and growth, making it a must-have sector for any prudent investor.
MONTHLY TF VIEW:
I) Key Drivers of FMCG Sector Growth
1. Stable Demand: FMCG products, ranging from food and beverages to household and personal care items, are essential for daily life. This ensures a steady and non-cyclical demand, making the sector resilient to economic fluctuations.
2. Consumer Behavior: Indian consumers are becoming increasingly brand-conscious and willing to spend more on quality and convenience, driving premiumization trends within the FMCG space.
3. Urbanization and Lifestyle Changes: With more people moving to urban areas, there is a noticeable shift towards packaged and ready-to-use products. This urbanization trend is set to continue, providing a sustained growth trajectory for FMCG companies.
II) Recession-Proof Investment
The FMCG sector is renowned for its defensive characteristics, especially during economic downturns. Even in times of recession, the consumption of essential goods remains relatively unaffected. We can see how the sector managed to outperfrom even in COVID pandemic like situation. This recession-proof nature provides a safeguard for investors, ensuring stable returns even in volatile market conditions.
III) Long-Term Investment Theme
Investing in the FMCG sector is not just about stability; it’s about tapping into a growth story that aligns perfectly with India's long-term economic prospects. Companies in this sector are continuously innovating, expanding their product lines, and enhancing distribution networks to capture greater market share.
- Stay tuned for further insights, updates and trade safely!
- These are my personal views.
- If you liked the analysis, don't forget to leave a comment and boost the post. Happy trading!
Disclaimer: This is NOT a buy/sell recommendation. This post is meant for learning purposes only. Please, do your due diligence before investing.
Thanks & Regards,
Anubrata Ray

The 2000 Withdrawal Rally 1$ = 85 INR ???USD INR chart seems to be ready for a rally.
Breakout from the Symmetrical Triangle.
Can we see 85 ?

BLUEPRINT to a SUCCESSFUL TRADERIf you want to go from Delhi to Mumbai, there are many stations that come in between. Just like that, a trader has to pass through several stages before achieving success. Knowing which stage you’re in is crucial—it helps you stay on track, avoid frustration, and progress systematically. This Post May Sound Basic, But It’s Extremely Important
Here are the 4 Stages of a Trader and how they define your journey:
---
1. The Excitement Phase
- What It Feels Like:
You’ve discovered trading, and it feels like the gateway to unlimited wealth. Every win feels like a step closer to “quitting your job,” and losses are dismissed as bad luck.
- Reality Check:
This is the honeymoon phase. Without a plan or risk management, you’re trading on emotion, not skill. Big losses often serve as a wake-up call here.
---
2. The Learning Phase
- What It Feels Like:
You’ve realized trading isn’t a game of luck—it’s a skill that requires discipline and study. You dive into books, watch tutorials, and experiment with strategies.
- Challenges:
- Information overload: Which indicator works best?
- Doubt: Am I even cut out for this?
- Outcome:
Progress is slow, but this is where the foundation for mastery is laid.
---
3. The Frustration Phase (THIS STAGE LASTS LONGER THAN ONE CAN IMAGINE)
- What It Feels Like:
You’ve gained knowledge, but your execution isn’t consistent. Every win is wiped out by a bigger loss. Strategy-hopping becomes a vicious cycle.
- Why Most Quit Here:
The emotional toll of inconsistency is heavy. Many traders blame the market, their broker, or even themselves, concluding that trading “isn’t for them.”
- The Breakthrough:
This is a test of resilience. Traders who stick to the process and focus on discipline eventually push through.
---
4. The Mastery Phase
- What It Feels Like:
Trading becomes systematic—a business, not a gamble. You’ve developed an edge, trust your strategy, and prioritize risk management.
- Key Characteristics:
- Discipline: You follow your plan without hesitation.
- Confidence: Losses don’t shake you because you know your edge works over the long term.
- Sustainability: Trading isn’t just profitable—it’s consistent.
- This Is True Success:
You understand the market isn’t a money-making machine; it’s a test of probabilities and discipline.
---
Why Knowing Your Stage Matters
Understanding where you are in this journey is like knowing which station you’ve reached on the Delhi-to-Mumbai train. It helps you prepare for what’s ahead and keeps you focused on reaching the destination.
So, ask yourself: Which stage am I in?
Let us know in the comments, and tag a fellow trader who’s on this journey with you.

Why PRO takes losses and everybody else LOSESTrading isn’t just about making gains—it's about managing losses like a professional. Here are some ideas on what separates amateurs from seasoned traders and how you can elevate your mindset:
Shift from Emotion to Execution:
Pros don't get attached to trades. They let data guide decisions, not emotions. Instead of celebrating a win or stressing over a loss, they focus on consistent execution. Tip: Try setting specific exit rules before you enter a trade, so you’re never swayed by market noise.
Embrace Small Losses to Avoid Big Ones:
Losing trades are inevitable, but pros keep them small. Amateurs sometimes hold onto losses, hoping they’ll recover, while pros cut losses early. Tip: Adopt a strict risk-reward ratio and stick to it. Think of it as a way to protect your capital for future trades.
Every Loss is a Lesson:
Professionals look at every losing trade as data, not failure. They analyze it: Was there an overlooked signal? Did the market behave unexpectedly? They use losses to refine strategies. Tip: Keep a trading journal. Record wins and losses along with your thought process. Patterns will emerge over time.
See Trading as a Business:
For pros, trading isn’t gambling; it’s a business. They’re less concerned with each individual trade and more focused on their overall strategy and risk management. Tip: Calculate your monthly performance, not just individual trades. Aim for consistent, steady growth.
Stay Calm During Drawdowns:
Market conditions change, and even the best traders experience drawdowns. It’s about staying in control, sticking to your plan, and trusting your process. Tip: Take a break if emotions start taking over. Sometimes stepping away can be the best decision you make.
Remember: Trading is a journey, not a sprint. It’s not about winning every trade but about thinking long-term, focusing on learning, and developing resilience. Keep pushing forward, keep learning, and most importantly, keep trading smart!

Bank Nifty Analysis 25th octoberBank Nifty Analysis 25th october
Support level at 50000 and also round level which can trigger more sellers or may trap. Check if it restest and then break after that only seller can takeover below 50000
Resistance at 51000 if breaks above this level then only buyers gets more active!!

WHY DO TRADERS FAIL?Why Most Traders Fail: Common Psychological Traps
Many beginner traders enter the market with a lot of enthusiasm but often leave disheartened after experiencing losses. One of the main reasons for this is not a lack of technical skills or strategy, but rather the inability to manage the psychological aspects of trading. Let’s dive into some of the most common psychological traps and how you can avoid them to become a more successful trader.
1. Fear of Missing Out (FOMO): FOMO is a powerful emotion in trading. It happens when you see a stock or asset rapidly rising, and you feel the urge to jump in late just because everyone else is. This often leads to entering trades at poor levels, where the risk of reversal is high.
Why It’s Dangerous: You end up making emotional decisions, ignoring your strategy.
How to Avoid It: Stick to your plan and predefined entry/exit points. Remind yourself that opportunities in the market are endless; chasing a missed trade could lead to a bad decision.
2. Revenge Trading: This occurs after a loss, where you try to win back the money immediately by placing irrational trades. Instead of accepting a loss, traders emotionally double down, hoping to recover quickly, often resulting in even bigger losses.
Why It’s Dangerous: Trading becomes emotional rather than strategic, leading to a cycle of poor decisions.
How to Avoid It: Accept that losses are a part of the game. Take a break after a significant loss to clear your mind, and only return when you can trade objectively again.
3. Overconfidence After a Win: After a string of successful trades, traders may feel invincible and start to ignore their risk management rules. They increase their position size without realizing that the market can turn at any moment.
Why It’s Dangerous: Overconfidence leads to taking on more risk than you can afford, which can wipe out profits or even lead to significant losses.
How to Avoid It: Stick to your trading plan regardless of recent success. Don’t increase position sizes without a valid reason and proper risk management in place.
4. Greed – Holding On for Too Long: Sometimes, traders hold on to winning trades far too long, hoping for even bigger profits. Instead of taking profits at their target, they let greed take over and end up losing a significant portion of their gains when the market reverses.
Why It’s Dangerous: Greed blinds traders to the signals that it's time to exit.
How to Avoid It: Set clear profit targets and stick to them. Use trailing stop-losses to lock in profits while allowing for potential additional gains.
5. Not Accepting Losses – Holding on to Losing Trades: Many traders struggle with cutting their losses because it feels like admitting defeat. They hold on to losing trades for far too long, hoping the market will turn in their favor, which often results in deeper losses.
Why It’s Dangerous: Holding onto losing trades can drain your capital and emotional reserves.
How to Avoid It: Have a strict stop-loss in place for every trade. Accept that small losses are part of trading and necessary for long-term success.
Conclusion: In trading, your mindset and emotions can be as critical as your technical analysis or strategy. By recognizing these common psychological traps—FOMO, revenge trading, overconfidence, greed, and refusing to accept losses—you can manage your emotions better and make more objective trading decisions. Always remember: successful trading is not just about big wins; it’s about consistency, discipline, and emotional control.
What psychological traps have you experienced in your trading journey? Share your experiences in the comments below and let’s learn together!

MILLIONAIRE TRADER'S advice"One Conversation Changed Everything"
Recently, I had the privilege of speaking with a millionaire stock trader (NOT THE YOUTUBER MILLIONAIRE TRADER), and the insight I gained was both simple and profound:
HE SAID ONE LINE
"Pros take losses. Everyone else loses."
This statement hit me hard. It’s a reminder that in both trading and life, it's not about avoiding failure—it's about managing it. The most successful people don't win by never losing; they win by knowing when to take a loss and move forward.
It’s a lesson that goes beyond the markets. Whether in business or personal growth, knowing how to cut your losses is the key to long-term success.
Would love to hear your thoughts on this powerful lesson! 👇
FOLLOW ME for more such content ahead

Technical Analysis DOESN'T WORK anymore?"Does this really predict the market, or are we reading too much into it?"
Technical Analysis is useless – Here's Why You Shouldn't Buy Into the Hype
I've been in the trading world long enough to know one thing: technical analysis isn’t the holy grail that many claim it to be.
Sure, charts, patterns, and indicators look fancy, and they give the illusion of certainty. But here’s the harsh reality: Markets don’t care about your patterns.
If technical analysis worked the way it’s advertised, wouldn’t everyone be making easy money? The truth is, the market moves based on emotions, macroeconomic factors, and real-world events—not lines drawn on a chart.
Successful traders don't rely on perfect predictions, they rely on managing their risk, adapting to market conditions, and learning from their losses.
Don’t get me wrong, it’s great for understanding market sentiment to some extent, but if you’re betting your portfolio on head-and-shoulders patterns or the RSI alone, you’re in for a rude awakening.
In the end, trading is about experience, discipline, and understanding human psychology. That’s where the real edge is.
#stockmarket

NANDAN DENIMCompany has reduced debt.
Stock is trading at 1.09 times its book value of 40.6
Market Cap 635 Cr.
PE 14 vs Industry PE 32
ROCE 11.7 %
ROE 8 % vs ROE 3Yr 7 %
EPS growth 3Years 170 %
Earnings yield 13 %
ROIC 8.16 %
Debt to equity 0.56
Promoter holding 65 %
Pledged percentage 0 %
PEG Ratio 0.87
CROIC 12.8 %
Piotroski score 9
Chg in FII Hold 0.13 %

Banknifty Trend Report Hello Everyone 👋
Today Bank-Nifty Try to Break High if Bank-nifty Break High so we need to cut our Down position.
Give me Some Time Today We upload Some Levels So you Can I Easily Identify Trend.
1.Bullish Shark Harmonic Pattern: The BANK-NIFTY chart currently showcases a Bullish Shark Harmonic Pattern forming within a rising parallel channel. This pattern suggests a potential bullish move, provided that the price holds above the crucial level of 50,149. That level should act as a strict stop loss.
2.Recent Trend: On August 14, there was a trending move. The price consolidated in the morning for a few hours and then started to fall. Currently, the price is at a support level, and it can either move up or continue to fall. The trend direction is still deciding, so keep an eye on it.
3.Long-Term Investment Considerations: If you’re considering long-term investment in the banking sector, consider Bank Nifty ETFs. These exchange-traded funds offer easy diversification and flexibility.

Data Base Trading Part = 4 #Institutions Options chain can be defined as the listing of all option contracts. It comes with two different sections: call and put. A call option means a contract that gives you the right but does not give you the obligation to buy an underlying asset at a particular price and within the option's expiration date.
An option chain trading strategy can be formulated by seeing accumulations in OI (open interest) and volumes in various option strikes. You should note, here, that open interest implies the number that tells you how many options or futures contracts are presently outstanding/open, within the market.

HI-TECH GEARSThe Hi-Tech Gears Ltd is an auto components manufacturer primarily engaged in the business of manufacturing gears and transmission components.
The product portfolio of the company comprises precision gears, shafts, transmission components, and engine components catering to two-wheelers (26%), Passenger Vehicles (43%), Commercial Vehicles, and Agri and Off-Road vehicles (31%).
Geographical Split FY24
Domestic: 49%
Exports: 51%
The company exports to 10+ countries, including Canada, USA, Mexico, Germany, China, Japan, South Korea, etc.
Clientele
The customers of the company include Hero MotoCorp Ltd, JCB, Cummins, Daimler Bharat, Tata, DANA, Mahindra, Wabco, Magna, etc.
New Business
In FY24, the company won the new business from India and North America of Rs. 69.5 Cr vs Rs. 175 Cr in FY23. It also ventured into the Indian Passenger Car SUV segment.
EV and New Technologies
The company has initiated the production of gear component final assembly & counter assemble and gear drive and helical gear components in the electric vehicle space. In FY24, it won EV business from Hero Motor Corp and Dana. It is also focusing on advanced technology components like automatic transmission gear.
Repayment of Debts
Co. has reduced its debt from 434 Crs in FY23 to 195 Crs in FY24 (excluding Lease Liabilities)
Focus
The company is focusing on improving asset utilization through targeted selling of existing capacity, higher customer engagement, and cost mitigation.

THE NEW INDIA ASSURANCEThe setup is low risk high reward.
A nice base formation refusing to fall 5 times.
Stage 2 Stock
New India Assurance Company Ltd is India's largest non-life insurance company. It is promoted by the Government of India (GoI) holding ~86% stake
Presently, the company operates through a network of 2,200+ offices across 29 states and 7 UTs in India
Presently, the company is a market leader in health, motor, liability, fire and marine line of insurance business.
It has ~14% market share in general insurance industry in India.
The company has operations in 28 countries. It has branches and agency offices in Abu Dhabi, Australia, Bahrain, Dubai, Fiji, Hong Kong, New Zealand, Mauritius, Japan, UK, Thailand, and others.
The company is strategically important to Govt. of India because of its dominant market position and because it is the flagship Indian general insurer in the international markets, with a desk at the prestigious Lloyd's syndicate in London. It can help the govt. to materially enhance insurance penetration in the country over the long term.

NIFTY 50 - A Magician's Bluff ???Well Well Well ! What do we have here? A fantastic day at the markets where people are rejoicing their portfolio's in green especially if they were holding Railway and Defence stocks in particular.
Anyways, today is Thursday and tomorrow's closing according to me would be key to understanding this illusion (if any). I am skeptical because there is a strong resistance zone as marked and in 9 sessions we have already moved up 5% and the steam left should ideally be less. So I'm getting a hunch of a magician's bluff being laid out to the retail investors by the big hands.
What is a Magician's bluff ?
There are 3 components.
1. Sleight of hand - refers to the skillful manipulation of objects, typically using the hands, to create illusions and deceive the audience.
2. Misdirection - is the art of diverting the audience's attention away from the secret actions or methods employed by the magician.
3. Presentation. - the ability to effectively communicate and connect with the audience.
Firstly, I have never seen politicians coming out in the open disclosing direction to the markets. Who needs this information? Big hands or retailers? Don't the big hands already have some of the information they require? This to me is 1. Sleight of hand
One of the very common strategies put out on social media is a range breakout. This Nifty50 chart also looks like a range breakout and it could be as well. However, what is bothering me is whether this move today is to make retail investors believe that the info given to them actually is taking place?
I am skeptical and this alerts me w.r.t 2. Misdirection for now.
Talking about 3. Presentation. if tomorrow 24.4.24 we more or less move sideways and close below 22850, there is a possibility of a good correction in the markets close to the results where retailers may get trapped by the big hands who would be thirsty to deploy their funds lower down. We could be correcting to 21000-21500 odd levels at least. (Wolfe Wave coming into effect)
However, If I'm wrong and this is genuinely a good breakout then we could be seeing a small retracement (sideways move) and then head to over 24000.

Linear Vs Logarithmic Chart. Which one to use ?NSE:ADANIENT
Hello, Traders! 👋
I hope you’re all having a fantastic weekend! 🌟 Whether you’re sipping coffee, analyzing charts, or just enjoying some downtime, let’s make it even more productive. 📈💡
In today’s educational post, we’ll explore a concept that might have slipped under your radar or left you slightly puzzled. No worries—I’m here to shed light on it!
Understanding Linear vs. Logarithmic Charts
🔹When it comes to visualizing data, two chart types stand out: linear charts and logarithmic charts. These seemingly simple charts can reveal powerful insights about trends, growth rates, and relative changes. Buckle up—we’re about to explore their differences and use cases! 📊🚀
What is a Linear chart?
🔹The Price plotted on a graph which we call charts, the price on the Y-axis shown will be consistent and uniformly scaled, which shows more significance to recent price action over old price action.
🔹Linear charts are great for showing absolute changes when each price has similar increments.
🔹Linear charts are easy to understand and you are already using them.
What is Logarithmic Chart (Log Scale):
🔹A logarithmic chart, or log scale, depicts percentage changes, giving a more accurate view of relative movements.
🔹Logarithmic charts are especially useful when analyzing Long-term price data. They can show proportional relationships and percentage changes more effectively.
🔹As time goes by, the difference between linear and logarithmic charts becomes more pronounced. Log scales are often preferred for their accuracy.
On this difference table, you can easily understand the uses and benefits of logarthmic charts.
How to switch to a logarithmic chart?
Just right right-click on the Price scale on the Tradingview chart and you will find log chart.
or you can just hover your cursor at the bottom of the price scale you will see A and L (A - means arithmetic and L- Logarithmic).
Note:- On short-term or recent price action these charts will not make any big difference but surely they impact longer-term data.
Feel free to explore both chart types and choose the one that suits your analysis best! 📊🔍
If you’d like more examples or have other questions, just ask—I’m here to help! 😊🚀
Keep Learning,
Happy Trading.
