Old Patterns Never Really Leave the ChartThis post is educational and observational in nature based on historical price action. It is not a forecast or a trading recommendation.Charts used are older than 3 months
A: Inverse Head and Shoulders
Point A marks an inverse head and shoulders pattern, a reversal structure formed by a low, a deeper low, and a higher low, typically preceding a shift in momentum to the upside.
B: The Breakout Candle
Point B marks the breakout candle, the candle that confirmed the move above the pattern's neckline.
C: The Fakeout
Point C marks a fakeout that followed, shaking out weaker positions before the real move continued. How far a fakeout can extend before reversing is never known in advance, which is part of what makes this phase difficult to trade in real time.
D: The One Sided Rally
Point D marks a one sided rally, a sustained upward move with limited pullback, following the fakeout.
E: The Old Pattern Trendline as Future Support
Point E highlights a trendline originally formed as part of the earlier pattern structure, which later went on to act as support for future price action.
The Bigger Picture
This chart is a reminder that patterns rarely disappear once they play out. The lines and structures formed during an old pattern often continue to serve as reference points long after that pattern has technically completed, later acting as support or resistance when price revisits the same area. Old structure tends to leave a lasting imprint on the chart, and recognizing that imprint is part of reading price history with depth
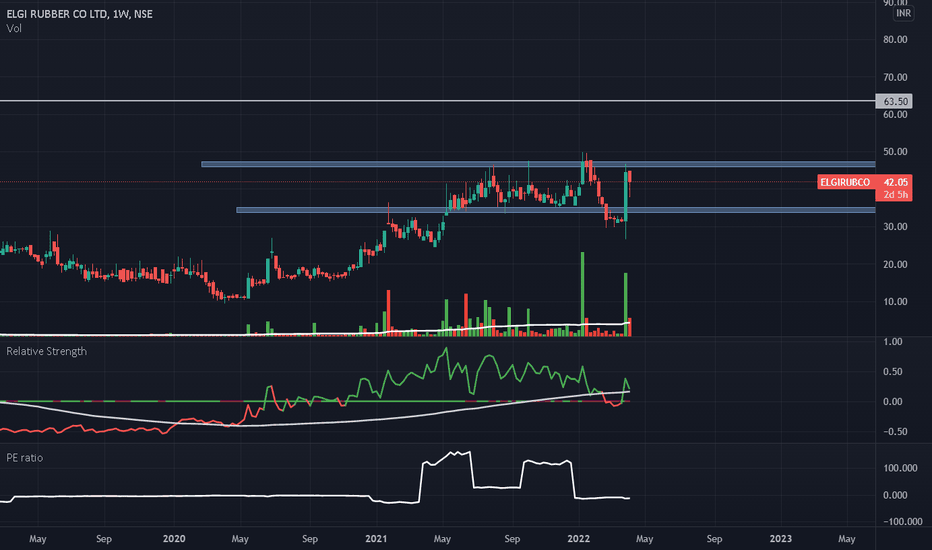
ELGIRUBCO
Elgi Rubber Company cmp 82.54 by Weekly Chart viewElgi Rubber Company cmp 82.54 by Weekly Chart view
- Support Zone 43.50 to 48.50 price Band
- Resistance Zone 85.50 to 92.50 price Band
- Price actively reversed from 4 years long past old Support Zone
- Heavy Volumes surged over the last week by demand based buying
- Falling Resistance Trendline Breakout sustained by bullish momentum
- Common Technical Indicators BB, EMA, MACD, RSI are trending positively
Analysis Request: Elgi Rubber@sajid11 :
Hi man,
I'm doing great. Due to a change in the Tradingview policies, I'm unable to send private messages without sufficient 'reputation points'. (So if you find this analysis, then kindly like & show some reputation likes on my profile) :D
Jumping to stock analysis(Technical):
It is currently captured in a range-bound space. thus if you're a movement chaser, then consider buying it above 50 with a decisive weekly close.
Else, for Long term investing current range of accumulation is (35.5 to 37.5).
Either way, the Target 1 could be 63.5. But it can safely move beyond 70.
(Fundamental trivia):
Rubber is highly dependent on global demand, with production concentrated in South Asian countries. Hence, high covid lockdown in China + Most anticipated Capex cycle of India will be beneficial for this stock in the next 6months to 1 year.
P.S.: This is my point of view, kindly take a buy/sell decision based on your risk capacity. Also, not a Financial advisor.
Lastly, Help others to grow together! :)
#ZEEL CMP230 #Target 260 #BALAJITELE #RIIL #MTEDUCARE #ZEELEARN#ZEEL
NSE: ZEEL
Short Term Quick Profit
CMP 230.40
Target 260
SL : 214
Timeframe < 45 Days
Can hold for longer time
Factors:
Trend Following
Rising Volume with rising Prices.
Flag pattern breakout.
Pennant Pattern Breakout with Bullish Candle.
Retest Successful.
Higher Highs & Higher Lows.
Broken above RESISTANCE levels
Trading at SUPPORT levels
Earnings are strong.
Bullish Wedge Breakout
Risk Return Ratio is healthy.
And
Rising from Double Bottom Pattern to Flag Pattern forming.
If you like my work KINDLY LIKE SHARE & FOLLOW this page for free Stock Recommendations.
With 💚 from Rachit Sethia