Elliott Wave Analysis of Shivalik Bimetal Controls SBCLSBCL is currently doing ABC retracement on daily time-frame. C is yet to be played out.
Elliottwaveanalyis

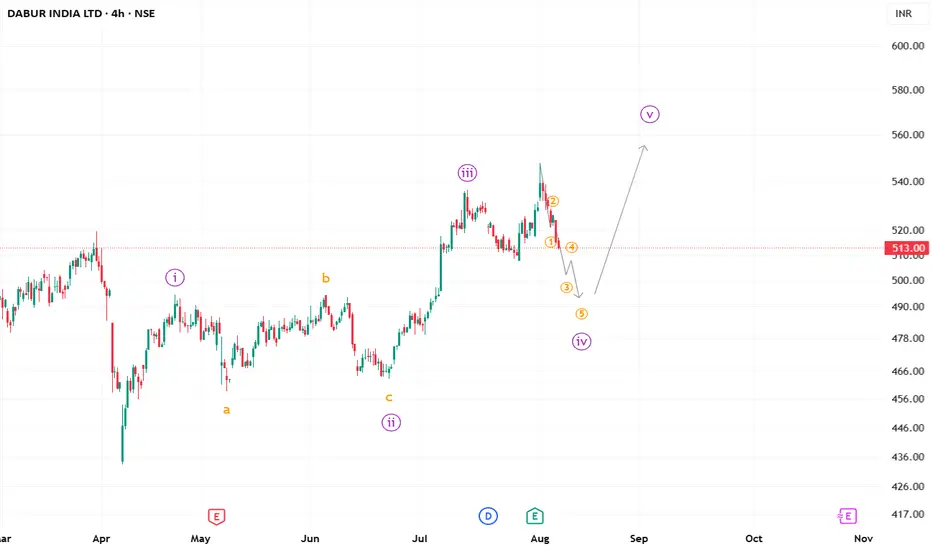
#Dabur ending correction soon?Dabur can be a good pick if you are looking for some medium-term investment in sometime, as the ongoing correction looks to be in the last stage of it impulse.
We may then possible see it soaring higher.
P.S. Always trade on price confirmation.
**This is an educational market outlook, not investment advice. Please consult a SEBI-registered advisor before taking any investment decisions.**
GBP/USD: Post-Impulse Sell Setup from Ending DiagonalThe chart depicts a completed 5-wave impulsive structure, culminating at the top of wave (5). The internal wave structure of the final fifth wave forms a classic ending diagonal pattern, typically signaling a trend reversal or deep correction.
After this extended fifth wave, the price has started rolling over, confirming the start of a corrective decline. The wave count now expects an ABC correction targeting the previous wave 4/2 demand zone, highlighted in red.
Target 1 (T1): 1.33608
Target 2 (T2): 1.32436
Stop Loss (SL): 1.35988
Ending diagonal at the top of wave (5) signals exhaustion of bullish momentum.
Clear bearish divergence (not shown here) is commonly seen with this pattern.
The price has broken the short-term structure and is now forming lower highs.
Target zone aligns with previous wave 2 consolidation – a typical retracement zone for post-impulse corrections.

COROMANDEL giving some healthy vibes!COROMANDEL appears to be finishing a multi-leg Flat correction. It's time to keep a good eye on the upcoming price action.

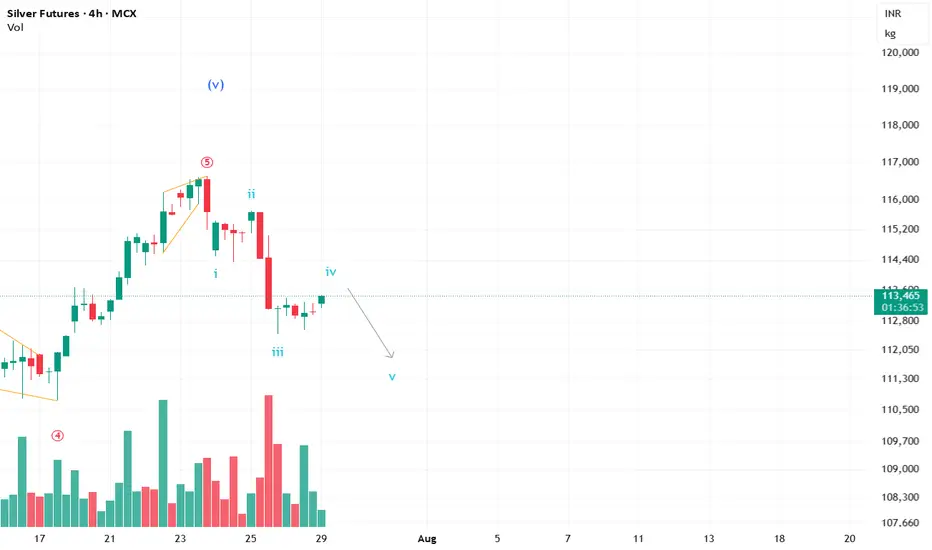
#Silver up for another short sell move?Silver is currently completing the 4th wave and may witness a down move in the short term. Keeping my eyes glued. :)
**This is an educational market outlook, not investment advice. Please consult a SEBI-registered advisor before taking any investment decisions.**
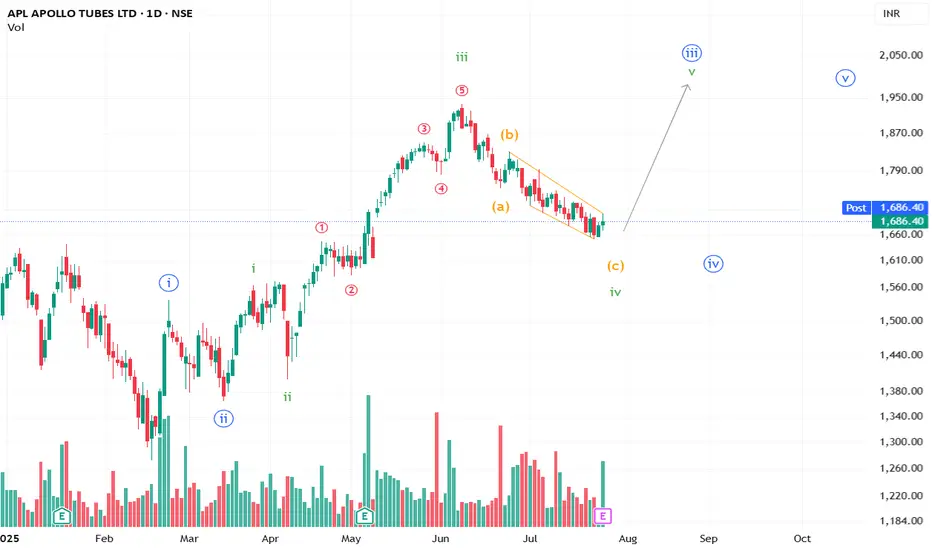
APL Apollo Tubes Limited Set to Surge?A well-formed ABC correction to the downside appears to be losing steam, and an upward move may take shape.
**This is an educational market outlook, not investment advice. Please consult a SEBI-registered advisor before taking any investment decisions.**
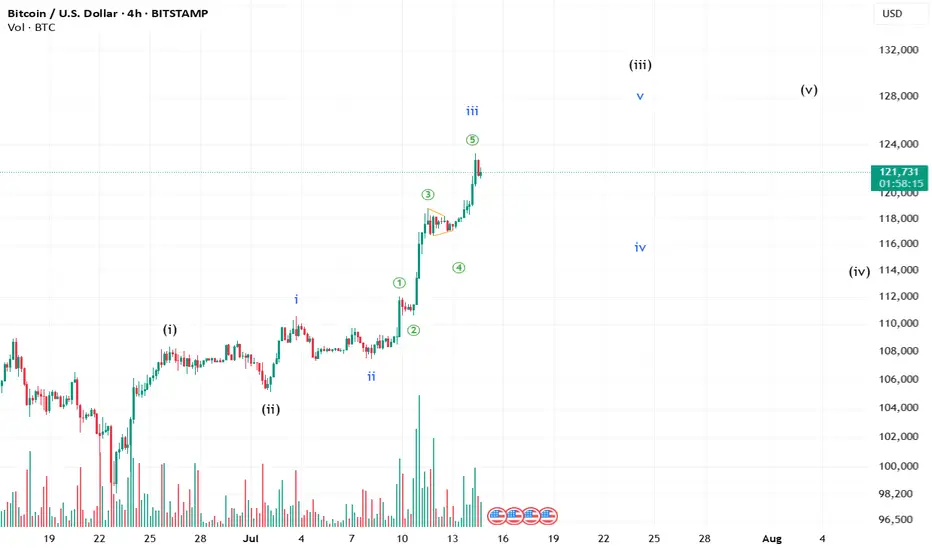
There is some steam still left in BTC!!BTC might still try again to push the levels to complete its sister waves. Whether it will sustain in the future is still yet to be answered.
**This is an educational market outlook, not investment advice. Please consult a SEBI-registered advisor before taking any investment decisions.**
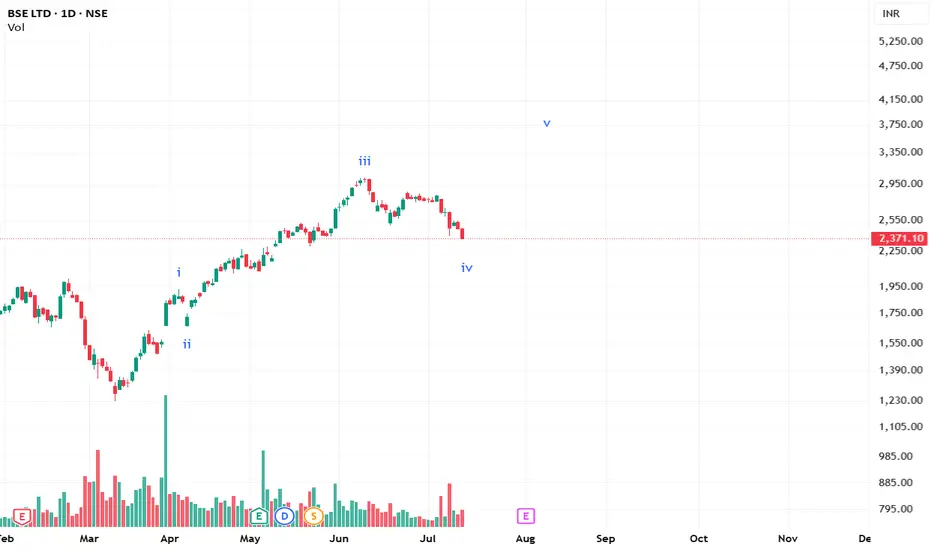
BSE is giving some good vibes now!A nice alternative wave 4 seems to be in progress in BSE. A confirmation is still needed to confirm the count!
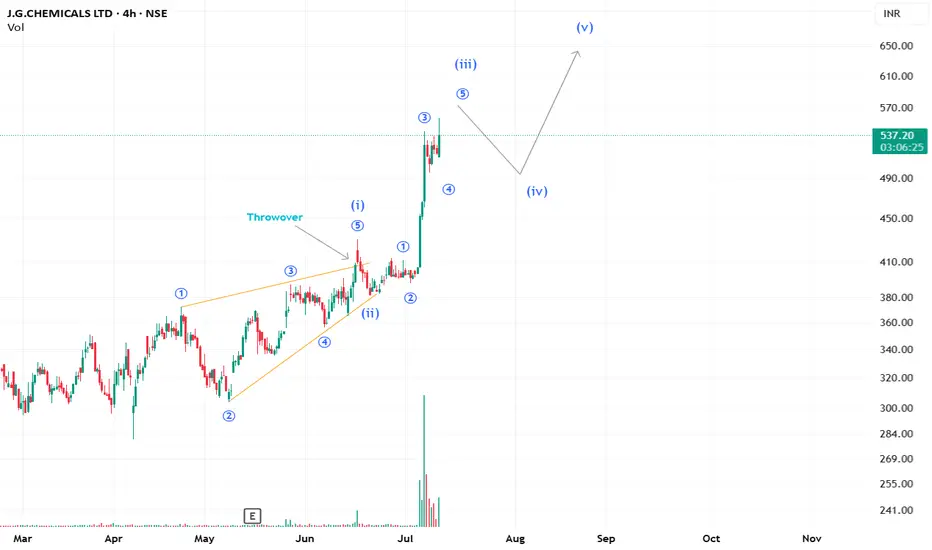
A good 5 wave patterns unfolding in J.G.ChemicalsCurrently, it seems that J.G. Chemicals is unfolding into a clear extended 3rd wave move. We may see a retracement and then a resumption of the trend.
Love,
PipVoyager
**This analysis is based on the Elliott Wave Principle.
This analysis is for educational purposes only and not investment advice.
Please consult your SEBI-registered advisor before making any investment decisions. Markets are subject to risk.**
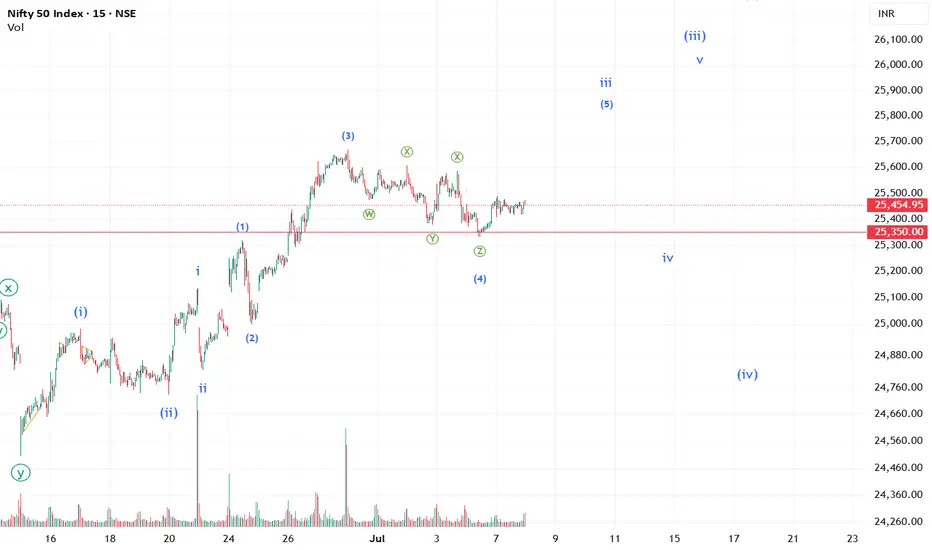
How 'bout that in Nifty?I am afraid if it's unfolding in a series of 1-2s.
I may be wrong, but it is what it is.
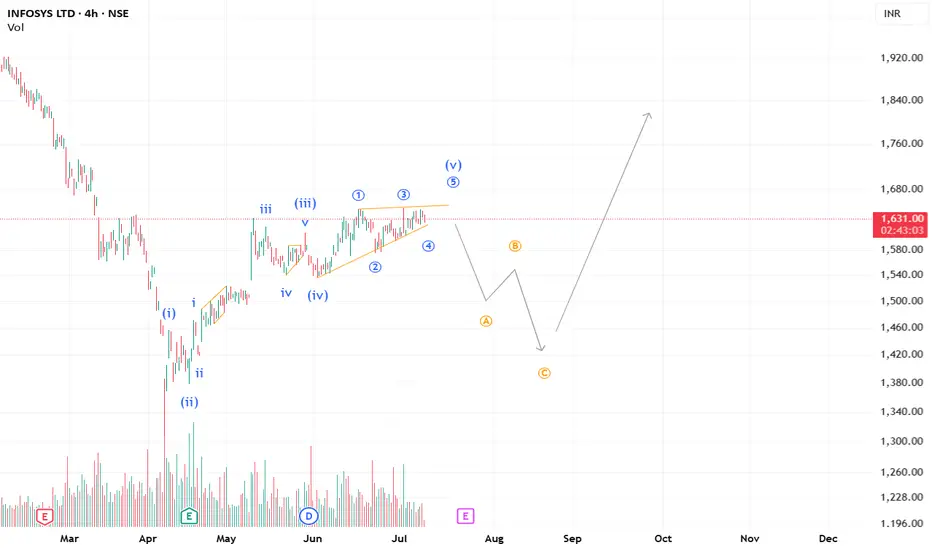
Can it be a mini Ending Diagonal in INFY in Wave 1?INFY seems to be completing an Ending Diagonal in Wave 5. We may see a downside ABC correction and then Wave 3, probably.
**This analysis is based on the Elliott Wave Principle.
This analysis is for educational purposes only and not investment advice.
Please consult your SEBI-registered advisor before making any investment decisions. Markets are subject to risk.**
Not feeling good about this like me?Can it be called a possible complex correction? The move appears to be contained with a channel and the ratio analysis and Advance Decline is not supporting this upmove.
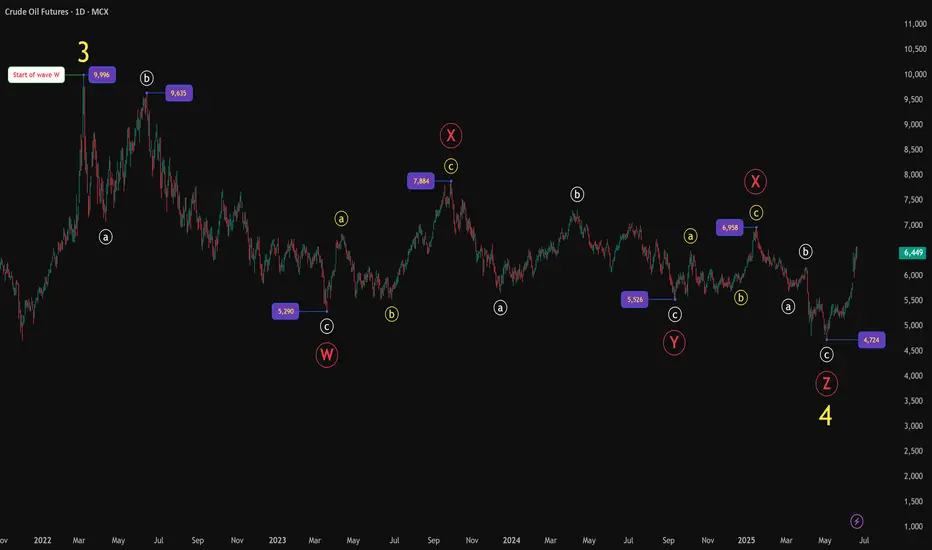
MCX Crude Oil: Complex Correction Complete?Big Picture Structure — Daily Timeframe
After peaking at 9996, Crude Oil entered a prolonged complex corrective phase, unfolding as a W-X-Y-X-Z structure, reflecting a Elliott Wave complex correction pattern.
Wave W formed via an initial abc decline.
Wave X delivered a corrective bounce.
Wave Y unfolded into another abc leg down.
A second X followed, creating further complexity.
Finally, Wave Z completed with a terminating abc decline, bottoming near 4724.
With this, the entire larger degree Wave 4 correction appears to have completed, setting the stage for a potential higher-degree advance.
Zoom In — 4H Timeframe Analysis
Zooming into the rally from 4724, price action unfolds very cleanly:
A strong 5-wave impulsive advance has developed.
Wave 3 displayed strong extension — a healthy sign of impulsive strength.
Wave 5 pushed to a higher high near 6585, completing a likely Wave (1) at smaller degree.
Notably, the final leg of this upmove developed with RSI bearish divergence, often an early warning of short-term exhaustion, suggesting a corrective Wave (2) pullback may now be developing.
Outlook Ahead
With higher degree Wave 4 likely behind us, attention shifts to the ongoing development of the larger degree Wave 5.
A corrective Wave (2) pullback may offer attractive entry zones for the next bullish impulsive leg.
As long as price maintains structural integrity above the 4724 low, the broader bullish outlook remains intact.
Summary
Complex W-X-Y-X-Z correction likely complete.
New bullish sequence underway.
Short-term corrective pullback (Wave 2) anticipated.
RSI divergence signals caution for immediate upside, but larger bullish trend remains intact.
Chart will be updated as price action evolves.
Disclaimer :
This analysis is for educational purposes only and does not constitute investment advice. Please do your own research (DYOR) before making any trading decisions.
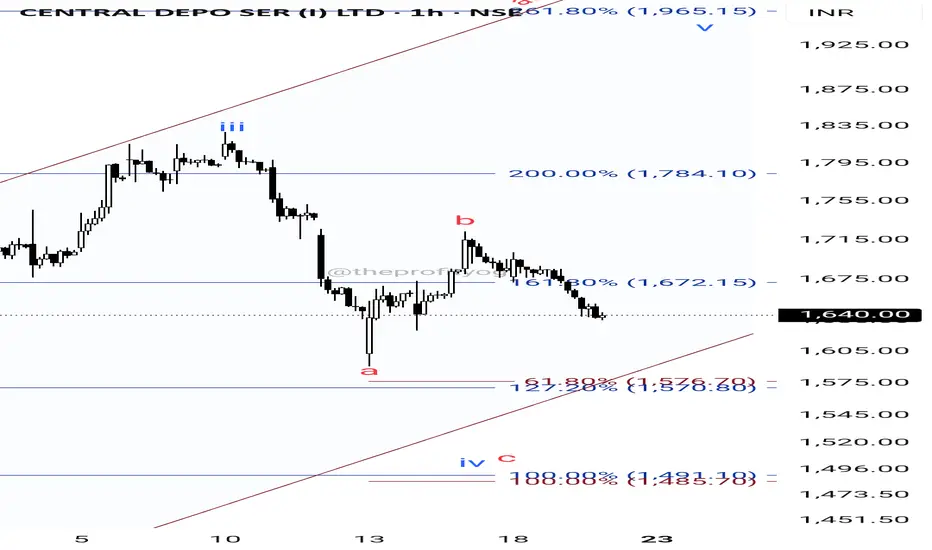
CDSL: Moving as expected, what's next?As predicted, CDSL is in wave 4 now.
Wave 4 is Zig-zag correction in nature.
Currently, it looks like we are in wave C of zigzag.
The targets for this wave C are minimum 61.8% , next targets will be 100% at both these levels we have cluster of fib levels. At these levels wave 4 may complete.
It means, at these levels we can have buying opportunity for wave 5.
But buying is only if there is any bullish candlestick pattern is formed.
For educational purposes only.
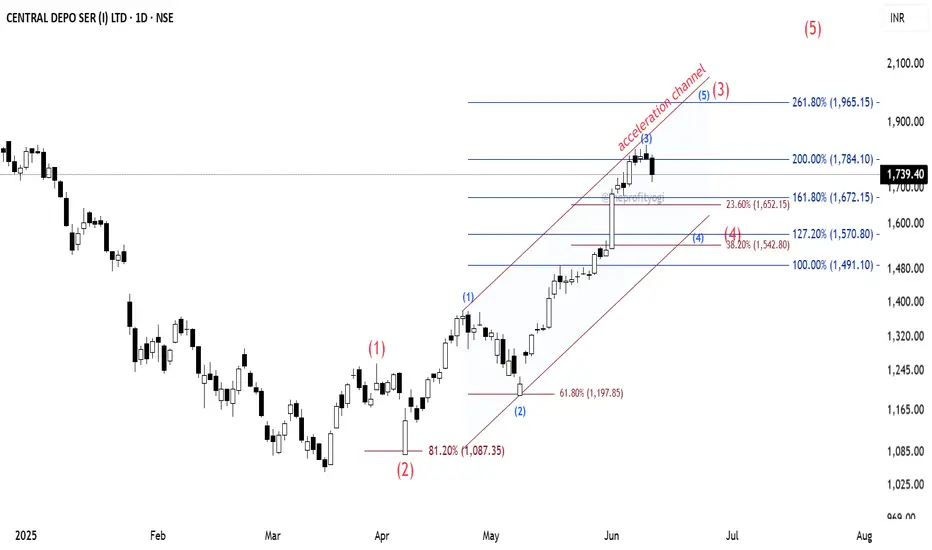
CDSL: Elliott Wave AnalysisThe CDSL daily chart indicates that the stock is in an impulse.
See the counting using Elliott Wave theory where the major wave (2) (shown in red) bounced from the 81.2% level to enter into wave (3).
The subordinate of wave (3) are shown in blue colour, where we can see the subordinate wave (2) of major wave (3) bounced from 61.8%.
To get the possible projection of the subordinate wave (3), I have applied Fibonacci extension to it, and we can see the price is at 200% extension currently. If the recent high is not broken up, we can presume that this is the top of wave (3).
Now, wave (4) will form. And for predicting wave (4) target that I have plotted the Acceleration Channel. This channel can be plotted by joining the line from the top of wave (1) to the top of wave (3) and then its parallel line from the bottom of wave (2).
This channel gives us a hint about where wave (4) may terminate.
Also, I have applied Fibonacci retracement from the bottom of wave (1) to the top of wave (3), and as we know that wave (4) may terminate between 23.6% and 38.2% levels.
So we can get some idea about where wave (4) may complete.
We can see there are clusters of Fib extension and retracement levels near these zones. So we may have a safe buying zone between those.
Important: Here, I have assumed that the subordinate wave (3) is completed.
If the price crosses above the recent top, then we have to replot and recount this study.
This analysis is based on Elliott Wave theory and Fibonacci.
This analysis is for educational purposes only.
This is not any buying recommendations.
End of correction in Hinduja Global SolutionsElliott wave analysis:-
A long bear trend has been almost over and we may expect a slight fall from here or the Candle may rise to stars from here. if you wish to be cautious then wait for a pullback for almost 65% to 78%. keep the previous low as your stop loss go for a long ride.
i am not a SEBI registered advisor. Before taking a trade do your own analysis or consult a financial advisor. I share chart for education purpose only. I share my trade setup.

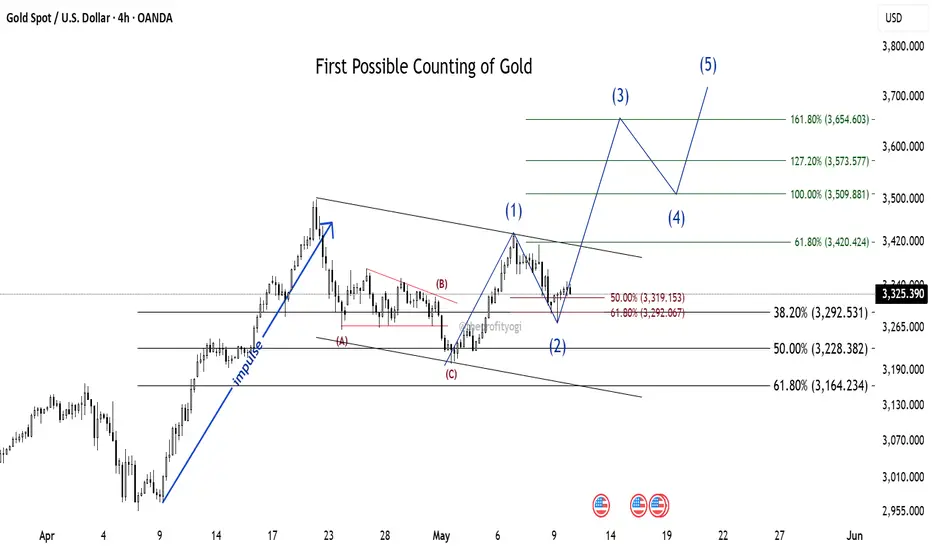
Possible Elliott Wave counting of GoldCounting 1:
After a clear impulse, the price formed a Zig-zag correction (marked in red ABC).
If the correction is completed near 50% (near 3228 level), then the recent upmove is a new impulse.
Of which wave 1 is completed, reaching a high of 3435. The market is currently in wave 2, and the next possible moves are marked as impulse counting (blue 12345).
This analysis is based on Elliott Wave theory and Fibonacci study.
This analysis is for educational purposes only.
XAG/USD Eyes Upside Targets as Wave C MaturesXAG/USD is currently trading in a corrective phase where wave B appears to have completed, and wave C is currently forming. Based on the current price action, it doesn’t seem likely that this entire move will result in a full bullish recovery. The structure suggests that this could be sub-wave C of wave 4, potentially completing around the 26.79944 level. Going forward, if the 5th wave begins to unfold, potential targets could be in the range of 29.74182 to 30.57528.

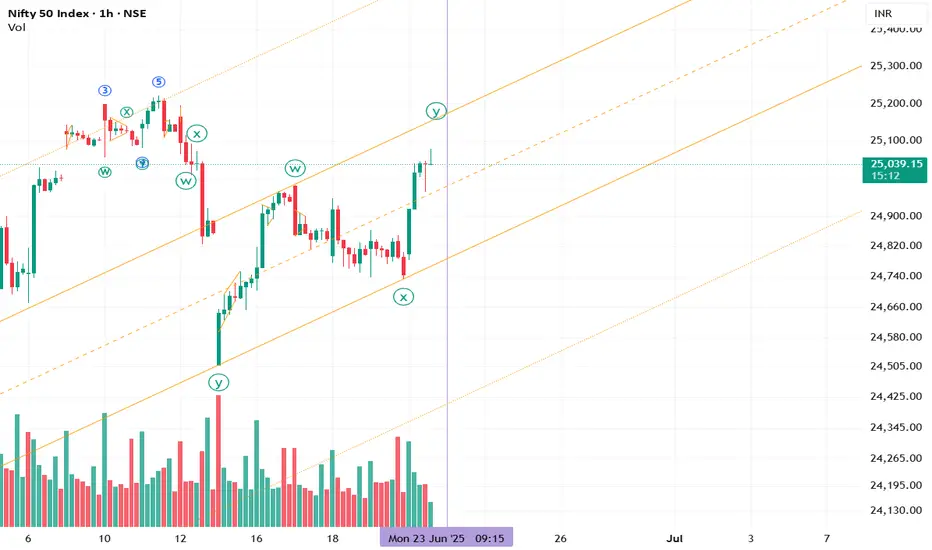
NIFTY analysis based on Elliott Wave theoryNIFTY is looking like in wave (Z).
Now, wave (Z) is always in 3 moves (ABC).
If we take a look in 75 min chart of NIFTY, we may see wave (a) of wave (Z) finished on 12 Feb. The price is in wave B of wave (b) now.
It looks like Zig-zag pattern is forming and it is observed most of the times that, Wave B of Zig-zag takes at least equal time of wave A.
So we may assume that, wave (b) of Zig-zag will finish at least by 19 Feb near 50% to 61.8% And then we may expect a fall to form wave (c) of Zig-zag.
This analysis is based on Elliott Wave theory and Fibonacci.
This analysis is for educational purpose only.

KALYAN JEWELLERS how much it can go up?Wave (c) of Elongated Flat Correction finished near 420 price level in KALYAN JEWELLERS.
It is observed that whenever there is Elongated Flat Correction (wave (c) will go beyond 161.8% extension), the price further tends to go in Double Correction.
Now, after every Flat Correction, price will go 61.8% retracement of entire move most of the times.
So we can assume here that KALYAN JEWELLERS will continue in uptrend upto 61.8% (near 652 level) and here it may form wave (X) of Double Correction. Price may then reverse again to form wave (Y).
This analysis is based on Elliott Wave theory and Fibonacci.
This not any buying or selling recommendations.
This analysis is for educational purposes only.

Time Analysis - Elliott Wave combinationSWAN ENERGY LTD is in impulse now.
In the daily chart of SWAN ENERGY LTD, Flat Correction is getting over and the price is entering in impulse now. This can be said if we combine Time analysis with Elliott wave counting.
The detailed counting of this Flat Correction can be seen in the chart above.
The 0-B trendline is broken in half time of wave C time.
(We can see wave C took 59 bars to form and after that, the price breaks above the 0-B trendline in just 30 bars)
According to the rule, the Flat Correction is over and the price is in impulse now.
The price will go to 127% for sure here, which gives us a price level of 875.45.
This analysis is based on Elliott Wave theory and Fibonacci with time analysis.
This analysis is for educational purposes only.

TATAchem double correction for more than 6 monthsTatachem was in double correction for more than 6 months
done w-x-y corrective move
Now need to break above 1113 level (resistance trendline)
for resuming uptrend..
more upside if breaks 1162
MACD +ve crossover
Disclaimer : I AM NOT SEBI REGISTERED. Post is only educational purpose of elliott wave analysis.

Bank Nifty View l Hourly l 25 NovBANKNIFTY sustained above 50700 and moved till 51200. Expecting bullish move on Monday as explained in green box in chart.
Bearish only below 50508.
For any doubts or any other stock view, comment below.
Support for motivation to keep posting views.
Disclaimer: The information disclosed here is for entertainment purposes only; it does not constitute investment advice. It cannot replace professional investment advice.
