GBP/AUD: Corrective Rally, Downtrend IntactGBP/AUD is trading in a clear bearish Elliott Wave structure on the 4H timeframe. The market has already completed a strong impulsive decline and is currently moving in a Wave 4 corrective pullback, which is happening inside a downward channel and near key Fibonacci retracement levels. This correction looks weak and corrective, suggesting sellers are still in control. As long as price remains below the invalidation level around 2.0050 , the bearish bias stays valid. The expectation is for the correction to finish soon, followed by Wave 5 to the downside, targeting the lower channel area and the 1.96–1.95 zone. Overall, the trend remains bearish, and any short-term bounce is likely a selling opportunity before the next leg lower.
Stay tuned!
@Money_Dictators
Thank you :)
Elliottwaveprojection

USD/CAD: Elliott Wave Bearish BiasUSD/CAD is showing a bearish Elliott Wave structure on the 4H chart. Price appears to have completed a corrective Wave 2 near the 0.5–0.618 Fibonacci retracement zone, which is a common area for corrections to end. From there, the market has started to turn lower, suggesting the beginning of a new impulsive Wave 3 to the downside, which is usually the strongest bearish wave. As long as price stays below the recent swing high near the retracement zone, the bias remains bearish, with downside targets toward the 1.365–1.360 area. A move above the Wave 2 high would invalidate this count and delay the bearish scenario.
Stay tuned!
@Money_Dictators
Thank you :)

Angel One: Big Move Coming SoonAngel One is moving inside a big sideways range for a long time, with price making ups and downs between support and resistance. Recently, the stock formed a triangle pattern, where highs are getting lower and lows are getting higher. This shows pressure building before a big move. Price is currently near the lower side of the triangle, which acts as support around 2,300 – 2,200. As long as this support holds, the stock can move up. A break above the upper trendline will confirm strength and can lead to a strong rally toward new highs. Overall, this looks like accumulation before a breakout, not a breakdown.
Stay Tuned!!!
RD :)

MCX Silver: Healthy Dip Before Next RallyMCX Silver is in a strong long-term uptrend on the daily chart. The market has already completed wave 1, 2, and a strong wave 3 upward. After this big rise, price is now expected to make a normal correction (wave 4). This pullback can come toward the 236,000 area, which is an important support zone. As long as price stays above this support, the overall trend remains bullish. After wave 4 is completed, Silver is expected to start wave 5, which can push prices to new highs. In short, the trend is up, and any dip is a healthy correction, not weakness.
Stay Tuned :)
@Money_Dictators

Nibe Ltd – Elliott Wave UpdateNibe Ltd – Elliott Wave Update
Nibe Ltd has reversed decisively from the 78.6% Fibonacci retracement, completing a textbook ABC corrective structure. The reversal was accompanied by clear bullish divergence on RSI and MACD, confirming exhaustion of the corrective phase.
Following the reversal:
Wave 1 of the new impulsive structure is complete
Wave 2 has unfolded as a shallow, time-wise correction
Price is now trading in Wave 3, supported by expanding momentum and rising volume
As long as price holds above the recent swing low (~₹1,030), the impulsive structure remains valid. Momentum indicators continue to support further upside, suggesting the trend is in an acceleration phase rather than exhaustion.
Trend Bias: Bullish
Structure: Impulsive (Wave 3 in progress)
Minimum Target: ₹1,700
Invalidation Level: Below the Wave-2 low

Gold in Final Bullish Wave – Last Push Higher ExpectedGold (XAU/USD 4H) is in a strong bullish trend and is currently moving in the last part of Wave (5). The clear breakout above the previous resistance shows that buyers are in control, and the bullish structure is still valid. As long as the price stays above the main support area, the outlook remains positive, with the next target around 4,580–4,650 , where this upward move is likely to finish. For short-term trades, a sensible stop-loss can be placed below 4,420 , while the bullish view becomes invalid if the price falls below 4,360 . If everything goes as expected, Gold should make one final move higher and then take a normal corrective pullback (A-B-C) after the strong rally.
Stay tuned!
@Money_Dictators
Thank you :)

ETHUSD - Are Bears Ready for the Fall?ETHUSD on the 4H timeframe is clearly in a corrective downtrend, not a healthy bullish structure. The price action fits an Elliott Wave decline where wave 3 already completed near 2620 , followed by a weak and overlapping recovery that looks like wave 4. That recovery stayed inside a falling channel and never showed impulsive strength, which already tells you buyers are weak. More importantly, wave 4 is flirting with wave 1 territory, which puts the entire bullish hope on thin ice.
Right now, ETH is at a make or break zone. If this move is just a fake breakdown, price must quickly reclaim the channel and hold above recent highs. If not, then this is likely wave 5 of C, and downside continuation becomes the dominant scenario. The structure favors a final flush toward the 2380 to 2350 area, where wave 5 projection and channel support align. Anyone blindly bullish here is ignoring structure. This is not a buy the dip market, it is a wait for confirmation or respect the downtrend market.

DXY Breakdown After Major Top – Wave v in ProgressThe DXY chart shows that the U.S. Dollar has completed a larger corrective structure and is now moving inside a new impulsive bearish phase. After forming a major top near the 110 area, the index started a clear five-wave decline, indicating strong downside momentum. The recent sideways movement looks like a corrective pause (wave iv / Y) rather than a trend reversal. As long as the price stays below the key resistance zone around 100–101, the overall structure remains bearish. This suggests the dollar is preparing for the final wave lower (wave v / 3), which could push the index toward deeper support levels. Overall, the Elliott Wave structure favours continued weakness in the U.S. Dollar in the coming months.
Stay tuned!
@Money_Dictators
Thank you :)

GER40 Holds Key Fibonacci Support – Upside Continuation LikelyThe GER40 chart indicates that a larger A-B-C corrective structure has been completed at the recent low, marked as (C), after which the index began a fresh impulsive upward move. From that bottom, price has formed a clean five-wave advance, confirming the start of a new bullish cycle. The recent pullback appears to be a typical Wave 2 correction, which has respected the 0.5–0.618 Fibonacci support zone, a common area where corrections typically end. This suggests the correction is likely complete and the market is preparing for Wave 3, which is usually the strongest and fastest upward wave. As long as price holds above the Wave 2 low, the bullish Elliott Wave structure remains valid. Overall, the setup favours continued upside, with potential for higher highs in the coming sessions.
Stay tuned!
@Money_Dictators
Thank you :)

GBP/USD Signals Trend Shift – Impulsive Upside ExpectedThe chart shows that GBP/USD has completed a full W–X–Y corrective pattern, with the final wave (y) and its C wave forming a clean bottom near the long-term support line. From that low, price has started a strong upward move, which looks like the beginning of a new impulsive Wave 1. The current pullback toward the 0.382–0.618 Fibonacci zone is typical behavior for a Wave 2 retracement before the next strong rally. As long as the price stays above the invalidation level at 1.30094 (the wave (y) bottom), the bullish scenario remains valid. This suggests that GBP/USD is preparing for a larger Wave 3 push to the upside.
Stay tuned!
@Money_Dictators
Thank you :)

BANKNIFTY - ELLIOTT WAVE ANALYSIS - DAILY TF.Hallo Investors/Traders today analysis of bank nifty indices now is going wave 5 super cycle degree its ending diagonal pattern forming cycle degree wave 3 completed soon then 4, 5 next possible big correction so plan your position carefully

Wave 4 Trap Complete as Bitcoin Prepares for Final Flush6 Days Ago
3 Days Ago
1 December 2025 :
BTC moved into the expected corrective zone last week but stayed inside the falling channel, showing that wave 4 was only a temporary bounce. Buyers failed to break any key resistance, and momentum kept fading. This kept the broader outlook bearish and hinted that wave 5 was still pending.
BTC has now broken below the short-term rising structure, confirming that wave 4 topped out near the 0.786 retracement. The rejection from that zone triggered a clean shift back into the main downtrend, with price sliding toward the key 86,280 support. As long as BTC holds below the upper channel boundary, the market remains positioned for further downside, with the 1.618 extension around 79,650 emerging as the next probable target for wave 5 completion.
Note:
The rejection from the 0.786–resistance zone shows buyers failed to take control.
Wave B at 86,280 is the immediate pivot level; staying below it keeps downside pressure intact.
The next major target for wave 5 sits near the 1.618 extension around 79,650.
Stay Tuned :)
@Money_Dictators

ETHUSD Bull Trap? - Final Breakdown Setup Is Almost Locked InETH is still stuck inside a clear falling channel, and the entire pattern is behaving like a corrective downtrend. The recent bounce from 2620 looks sharp, but it’s still just a counter-trend move. Nothing here screams trend reversal yet.
Wave 3 ending at 2620 , and now the price is rising for a Wave 4 retracement. Wave 4 usually moves back toward the mid-channel and tests previous breakdown zones.
The red box around 3200–3300 is the key trap zone. This is where sellers can return because Wave 4 must not enter Wave 1 territory, which sits higher. As long as ETH stays under that invalidation level, the bearish structure remains fully intact.
The move looks like a classic (a)-(b)-(c) correction inside Wave 4. Once this corrective bounce completes, the chart suggests ETH will resume the downward path. The channel alignment and wave symmetry both support a final Wave 5 drop.
If the bearish count plays out, ETH could slide toward 2400 – 2300 in Wave 5 before a major bottom forms. That’s the zone where sellers exhaust and buyers take control again. Until ETH breaks the invalidation level with strength, downside remains the more probable outcome.
Stay Tuned!
@Money_Dictators

ETHUSD: Reversal or Another Bull Trap?Look at this:
ETH played the trap perfectly. After pushing into the 3200–3400 resistance zone, price failed to sustain above it and rolled over, confirming that the move was distribution, not strength. Sellers stepped in exactly where a Wave 4 rally should fail.
The rejection was followed by a clean breakdown of the parallel rising channel, which shifts the short-term bias back in favor of the bears. That channel was the last structure holding the corrective bounce together. Once it broke, the bullish case weakened sharply.
This drop reinforces the view that the move up from 2620 was only a Wave 4 correction, not the start of a new trend. With Wave 4 likely complete, ETH appears to be transitioning into Wave 5 of the broader corrective decline.
As long as price remains below the broken channel and prior resistance, downside continuation remains the dominant scenario. The structure opens the door for a retest of 2620 , with a deeper extension toward 2465 if selling pressure accelerates.
Until ETH reclaims the channel with strength and acceptance, this remains a sell-the-bounce environment. The warning came at the trap zone, and the market is now following through.
Stay Tuned!
Money Dictators,
R.D :)

NAS100 Preparing for Wave 3 Rally After Healthy PullbackThe NAS100 chart shows that a larger corrective move has likely finished at the (Y) / C low, after which price started a new upward impulsive structure. The recent decline looks like a normal Wave 2 pullback, which has already reacted from the 0.5–0.618 Fibonacci support zone, a common area for corrections to end. This suggests buyers are stepping back in and the market is preparing for Wave 3, which is usually the strongest upward move. As long as price stays above the invalidation level near 23,836, the bullish Elliott Wave setup remains valid. Overall, the structure favors further upside toward new highs once Wave 3 gains momentum.
Stay tuned!
@Money_Dictators
Thank you :)

PAYTM (One 97 Communications Ltd.) – Technical Outlook & LevelsPAYTM is currently trading near ₹1,344 and remains in a strong upward Elliott Wave structure.
A clean breakout above ₹1,380–1,400 may trigger Wave-3 momentum toward ₹1,850–₹2,000.
Supports at ₹1,300 and ₹1,225 remain crucial for trend continuation, while ₹1,250 acts as an ideal stop-loss for swing setups. Long-term Wave-5 projections suggest a potential move toward ₹2,150–₹2,250.
🎯 Future Target Levels
🔹 Swing Trading Targets
• Target 1: ₹1,420 – ₹1,450
• Target 2: ₹1,550 – ₹1,600
🔹 Position Trading Targets
• Wave 3 Target Zone:
👉 ₹1,850 – ₹2,000 (Fib 1.618–2.0 extension)
• Wave 5 Extended Target:
👉 ₹2,150 – ₹2,250 (Post Wave-4 completion)
🛑 Key Support Levels
• Major Support: ₹1,300
• Intermediate Support: ₹1,225
• Structural Support: ₹1,100 (previous swing-low zone)
📌 Resistance Levels
• Immediate Resistance: ₹1,380
• Next Resistance: ₹1,450
• Major Resistance Zone: ₹1,550 – ₹1,600 (Breakout above this zone can accelerate the Wave-3 rally)
🔐 Stop-Loss Recommendations
Swing Trades
• SL: ₹1,250 (below trendline & previous corrective low)
Positional Trades
• SL: ₹1,180 (below Wave-2 base level)
📌 Thanks a ton for checking out my idea! Hope it sparked some value for you.
🙏 Follow for more insights
👍 Boost if you found it helpful
✍️ Drop a comment with your thoughts below!

USDCAD - Breakout Will Flip the Trend BullishUSDCAD has been sliding inside a well-defined descending channel, completing a full five-wave drop toward the support zone. The structure from the top looks corrective rather than impulsive. That means the downtrend is weakening as it reaches its final leg.
Your count shows Wave 3 finishing at the dashed red line zone, followed by a small Wave 4 bounce, and now the market is pushing into the last Wave 5. This final drop is expected to target the Fibonacci levels near 1.3915 and 1.3895 . Nothing suggests strength until those levels are tested.
The price is still trapped inside the downward channel, and every bounce has been getting sold. That confirms sellers are still in control for now. Wave (C) is close to completion, but buyers haven’t proven anything yet.
The bullish outlook only becomes valid after a clean breakout above the channel. Without that break, any upside move is just noise inside a bearish structure. The breakout must hold with a higher low to confirm a trend reversal.
If the channel breaks decisively, a strong bullish reversal toward 1.40+ becomes possible. The entire structure suggests the downtrend is aging, so a major upside swing is likely once sellers exhaust. Until then, downside targets remain open and caution is necessary.
Stay Tuned!
@Money_Dictators

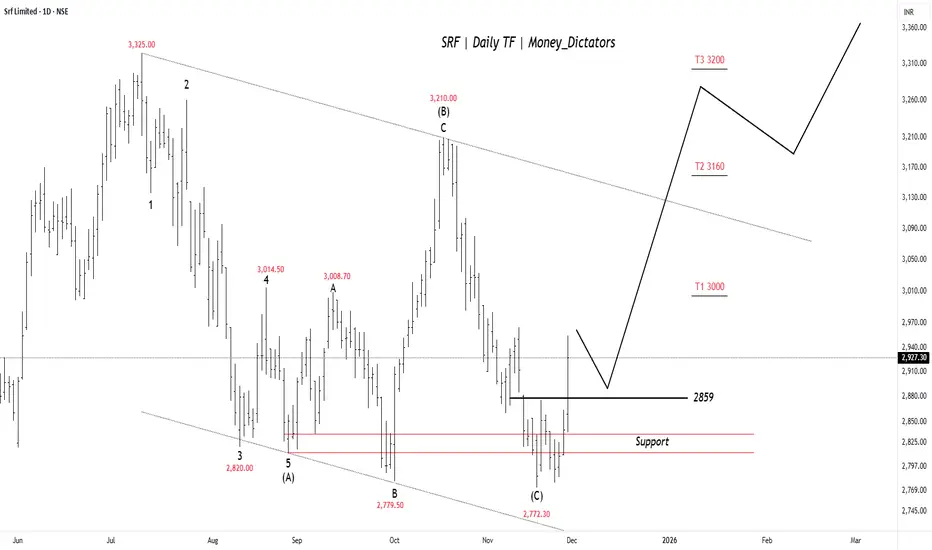
SRF on the Edge of a Sharp BreakoutSRF seems to have finished its ABC correction near the 2770–2800 support zone, and the price has bounced back above 2859 , which now acts as a short-term trigger. If the stock stays above this level, it can move toward 3000 first, then 3160 , and possibly 3200 . The chart shows buyers gradually taking control again after the correction, but the outlook stays positive only as long as price holds above the support region.
Stay Tuned!
@Money_Dictators
BTCUSD - Wave 5 Decline Still Likely AheadPrevious Analysis:
BTC is approaching a critical reaction zone where the current rise looks more like a corrective push than the start of a new trend. Price is moving toward the highlighted supply region, which aligns with a potential wave 4 completion inside the descending channel. The structure from the recent low shows an internal a–b–c formation, suggesting this bounce could run into exhaustion as it enters the red zone. Unless BTC breaks out of the channel with conviction, the broader momentum still leans bearish. A rejection from this region would likely trigger the final wave 5 leg, driving price toward deeper Fibonacci levels and completing the corrective cycle before any meaningful recovery attempt can begin.
Stay Tuned!
@Money_Dictators

BTC Wave 4 Bounce Looks Like a Trap! Is it?BTC is still moving inside a clear corrective channel, with the current bounce likely forming wave 4 before one final drop toward the 1.618 extension near 79,650 . The highlighted red zone shows a potential trap area where price may lure traders into thinking a reversal has started. Until BTC breaks above the channel convincingly, the broader structure still favors a wave 5 decline. The wave count from 1–2–3 supports this final leg down before any major recovery.
Stay Tuned!
@Money_Dictators

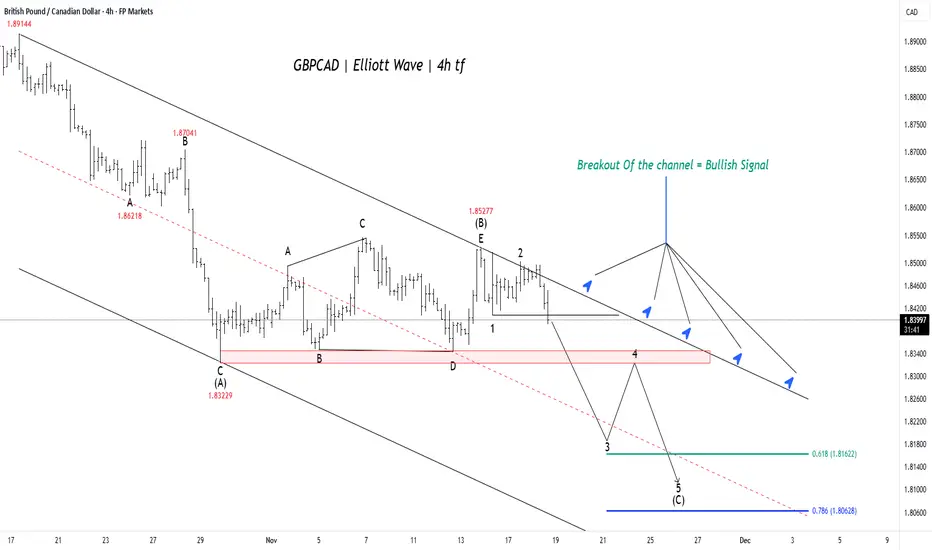
GBPCAD: Final Drop to Key Support Before Major ReversalThe wave Principle strongly suggests the currency pair is currently in the final stages of a large decline, which is expected to precede a major, sustained upward move.
Completion of Correction: The pair has recently completed a complex, sideways corrective pattern (such as a triangle or flat), marking the start of the final downward push.
Final Downward Leg: This ultimate decline, labeled wave (C), is now underway and is projected to drive the price into a critical support zone.
Target Zone: Traders are watching two key targets for the end of this correction: the 0.618 Fibonacci extension near 1.8162 and the deeper 0.786 extension at 1.8062 .
Anticipated Reversal :Once the price successfully completes this wave (C) and holds support within the 1.816 to 1.806 range, the analysis anticipates the immediate start of a significant and powerful bullish rally.
The current market price is still trading above this projected support zone, indicating that the final downward leg has room to run before the setup for the major reversal is complete.
Stay Tuned :)
@Money_Dictators
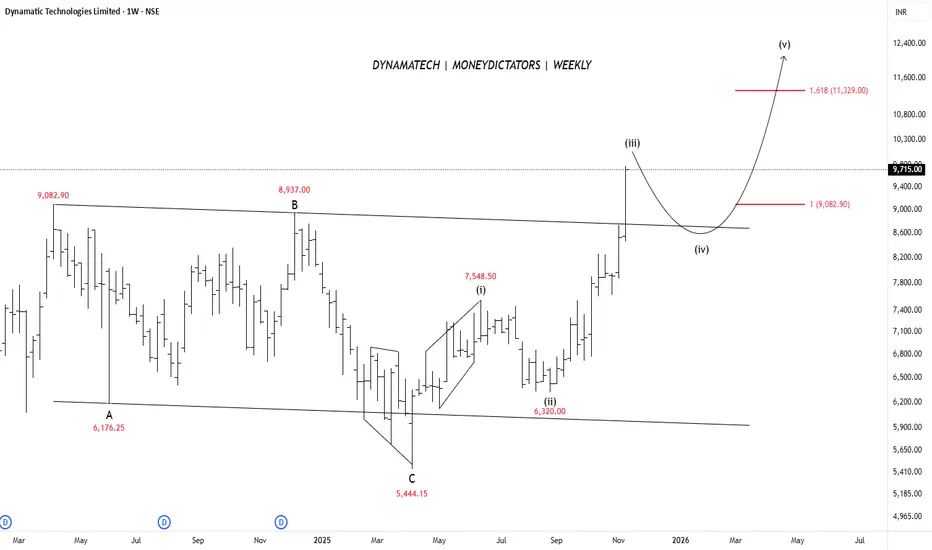
Dynamatech Has Given a Clean Wave Map to the ₹11,300 ZoneDynamatic Technologies has already completed its big A-B-C correction, meaning the downtrend is over. After this, the stock started a fresh upward Elliott Wave cycle, and waves (i), (ii), and (iii) are already complete. This confirms that the stock has entered a new bullish phase.
Right now, the price is moving inside wave (iv), which is a normal and healthy pullback. This corrective move is shallow and smooth, showing that buyers are still in control. The important support for this pullback sits near 9,082 , where the chart also shows a Fibonacci level. Once wave (iv) ends, the chart suggests a strong rise toward wave (v).
Wave (v) usually extends upward, and based on Fibonacci projections, the next major target is around 11,300 . This level is marked by the 1.618 extension, a common ending point for final impulse waves.
Overall, the stock structure looks bullish and clean. The trendline breakout and wave count both suggest the next move is upward. If the price holds above 9,082, the chances of reaching the 11,300 wave (v) target remain strong.
Stay Tuned! :)
@Money_Dictators
USDJPY Vulnerable to Deep Pullback After Wave 5USDJPY has completed a full 5-wave rising structure inside a clear wedge pattern, which usually signals exhaustion. The final Wave (5) shows weakening momentum, and price is beginning to slip below the wedge support — an early sign that the trend may be reversing. This suggests the pair is likely entering a deeper corrective decline, potentially retracing toward 150 or lower in an impulsive A-B-C move. In simple terms: uptrend looks tired → wedge breakdown could trigger a strong downside correction.
Stay tuned!
@Money_Dictators
Thank you :)
