BN Short-term view as per EWPBN is heading towards 40500 lvl making a-b-c correction and may even see 40775 lvl shortly. Would agree or not? Please share your view.
Elliottwaveprojection

METAL STOCKS BOTTOMING OUT IN WAVE 2NSE:CNXMETAL Metal stocks are bottoming out in wave 2 correction. Shall be heading in wave 3 higher. Bought couple of them today.

NSE ABFRL – Motive Cycle BeginsTimeframe: Daily
NSE ABFRL has been forming into the corrective formation for more than 15 weeks. This manner of the price is corrective because it is falling steeply into the channel.
As per the rule of the channel, the corrective wave respects the channel because they don’t have the power to break out from the parallel lines. The impulse breaks the channel, whereas the correction forms within it.
Currently, the price has accomplished wave 5 of wave (C) at 240 , and the price started lifting near the upper band of the regression channel. This breakout can be a holy grail for bulls to reach near wave (B). Safe traders can wait for the retracement to ride the impulse.

Nifty correction Analysis ELLIOT WAVE Nifty look like wave structure show C OF c pending target 17660
stop 17855

NIFTY: CORRECTION AHEADAfter a five wave impulse down nifty is rising in a corrective structure on the upside. The corrective nature of the price action suggests that near term trend for the nifty50 is down and prices are likely to fall towards 17000 in the coming weeks. On the upside the key resistance zone is 18350 while on the downside key supports levels are 17650/17350/17000

ULTRATECH CEMENT: A LEADING DIAGONALTheory:
DIAGONAL:
Diagonal are the motive waves like an impulse wave, but diagonals are different from impulse wave in that they do follow the first two Sutras (rules of impulse wave) for wave analysis, but it does not follow the third one i.e. Wave 4 should not intervene the territory of the wave 1. In a diagonal wave 4 always enters into the price territory of the wave 1.
Properties Of Diagonals:
Diagonals can be contracting or expanding type being expanding diagonal a rare one.
In contracting type, wave 3 is shorter than wave 1, wave 5 is shorter than wave 3, and wave 4 is shorter than wave 2.
In expanding type, wave 3 is longer than wave 1, wave 5 is longer than wave 3, and wave 4 is longer than wave 2.
Types Of Diagonals:
LEADING DIAGONAL
ENDING DIAGONAL
LEADING DIAGONAL: In a leading diagonal , waves 1,3, and 5 are all impulsive in nature or all in corrective form of zigzags. Wave 2 and wave 4 are always present in a zigzag form. A leading diagonal suggests the starting of a new wave & that is why it can develop wave 1 of a impulse wave and a first wave of a zigzag pattern.
ENDING DIAGONAL : This is the most common diagonal that can be found out at the ending of a main trend or main correction. It consists of all the waves 1-2-3-4-5 in a single or multiple zigzags. They can be found placed at 5th wave of an impulse wave or can been seen as a wave ‘C’ of a corrective waves zigzags or flat. After the termination of the ending diagonal , a swift & a sharp reversal takes place which bring the prices back to the level from where the diagonal began.
TRADING STRATEGY:
Plan A: Buy with SL of 7147 and look for the upside target of 7600/7800
Plan B : Sell in the region of 7800-7900 keeping SL of 8150 and look for the downside targets of 7050/6600/6400

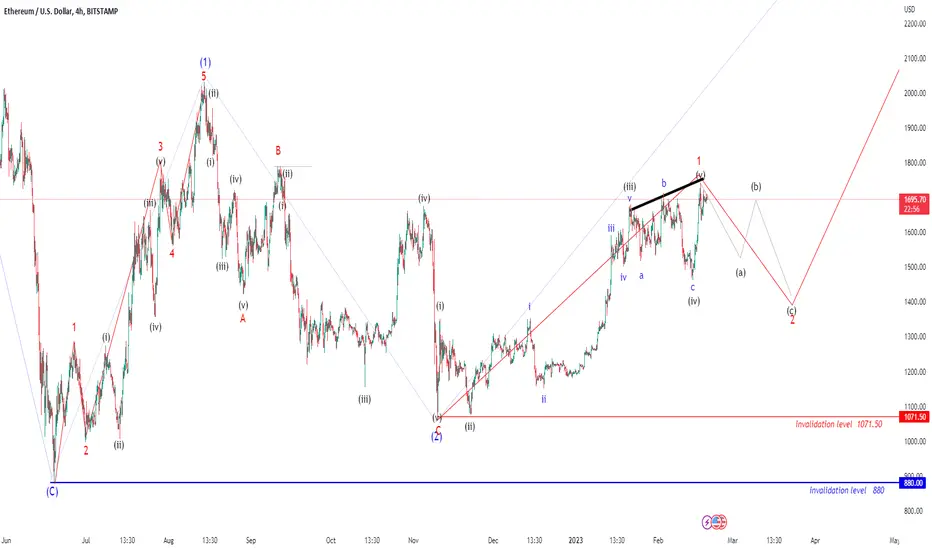
Ethereum possible Elliot wave counts Here we have shared possible Elliot wave counts of ETHUSD (for educational purpose only) which are suggesting correction for very short term and this correction can be used as good opportunity to go long for further trend which is expected post this correction, the invalidation level of further up move can be low of previous wave 1 which is pegged at 1071.50, if it breaks below this level then we can assume that our counting is missing something and we may invalidate this structure, Overall we are unfolding some impulse in which we had completed wave (1) and now possibly we are heading to unfold wave (2) and then, post correction we can start wave (3). wave (2) can unfold in three subdivisions like ABC and ABC can unfold in 5-3-5 structure or 3-3-5 structure. Lets see what happens next.
My studies are for educational purpose only.
Please Consult your financial advisor before trading or investing.
I am not responsible for any kinds of your profits and your losses.
Overall wave structure is shared below
Most investors treat trading as a hobby because they have a full-time job doing something else.
However, If you treat trading like a business, it will pay you like a business. If you treat like a hobby, hobbies don't pay, they cost you...!
Disclaimer.
I am not sebi registered analyst.
My studies are for educational purpose only.
Please Consult your financial advisor before trading or investing.
I am not responsible for any kinds of your profits and your losses.
USOIL CRUDE OIL possible Elliot wave countsUS OIL is looking good to go long as per Elliot wave structure with invalidation level of below $ 76.50, for target level of near $ 83.05.
My ideas as just for educational purpose only
I am not sebi registered analyst.
My studies are for educational purpose only.
Please Consult your financial advisor before trading or investing.
I am not responsible for any kinds of your profits and your losses.
Most investors treat trading as a hobby because they have a full-time job doing something else.
However, If you treat trading like a business, it will pay you like a business.
If you treat like a hobby, hobbies don't pay, they cost you...!
Disclaimer.
I am not sebi registered analyst.
My studies are for educational purpose only.
Please Consult your financial advisor before trading or investing.
I am not responsible for any kinds of your profits and your losses.

TVS MOTORS possible Elliot wave countsHere we have shared possible Elliot wave counts of tvs motors, just for educational purpose, on monthly, weekly, daily and hourly time frames, all aligned with each other, so here we are getting both side confirmation levels for next possible moves.
Most investors treat trading as a hobby because they have a full-time job doing something else.
However, If you treat trading like a business, it will pay you like a business.
If you treat like a hobby, hobbies don't pay, they cost you...!
Disclaimer.
I am not sebi registered analyst.
My studies are for educational purpose only.
Please Consult your financial advisor before trading or investing.
I am not responsible for any kinds of your profits and your losses.

PAGEIND possible Elliot wave countsThis stock has completed wave 1 of higher degree wave cycle and now definitely we are in correction as wave 2 of same higher degree wave cycle, in which we are unfolding wave A of one degree lower wave cycle, in which possibly we are in wave iii or wave c of one more lower degree, that means possibly we are in wave iii or c of one higher degree wave A of one more higher degree wave 2, so we can unfold correction pattern as zigzag or as a flat or as an expanded flat as well. This post is not for any types of tips or advisory or any type of trading ideas, this is shared just for educational purpose only
I am not sebi registered analyst. My studies are for educational purpose only. Please Consult your financial advisor before trading or investing.
I am not responsible for any kinds of your profits and your losses.
Most investors treat trading as a hobby because they have a full-time job doing something else.
However, If you treat trading like a business, it will pay you like a business. If you treat like a hobby, hobbies don't pay, they cost you...!
Disclaimer.
I am not sebi registered analyst.
My studies are for educational purpose only.
Please Consult your financial advisor before trading or investing.
I am not responsible for any kinds of your profits and your losses.

Nifty for 10-Feb-2023Disclaimer.
I am not SEBI registered analyst.
My studies are for educational purposes only.
Please Consult your financial advisor before trading or investing.
I am not responsible for any kind of your profits and your losses.

BANKBARODA possible Elliot wave countsThis stock has shown almost aligned wave counts from weekly to daily and from daily to hourly and right now its in correction area of some lower degree wave counts
macd on hourly chart
momentum negative cross done on hourly
Price under and below RK's stopline in daily
Price made neutral candle under and below 20DMA in daily
Most investors treat trading as a hobby because they have a full-time job doing something else.
However, If you treat trading like a business, it will pay you like a business.
If you treat like a hobby, hobbies don't pay, they cost you...!
Disclaimer.
I am not sebi registered analyst.
My studies are for educational purpose only.
Please Consult your financial advisor before trading or investing.
I am not responsible for any kinds of your profits and your losses.

Nifty correction Analysis ELLIOT WAVE Nifty right now side waves ..
first clear direction if upside move am expecting beak 17800 sustain above
Ready for 18200
Remember my point wave path till not clear .
trend positive 17800 above
Only for educational purpose for my side

BAJAJ FINANCE ELLIOTT WAVE COUNTNSE:BAJFINANCE seems to have completed wave 2 correction.
It shall be heading higher in Wave 3 of extended wave 5 of Bull Market.

DelhiveryThis stock has given good breakout on daily time frame along with positive divergence in RSI along with macd positive crossover.
Also possible Elliott wave counts are suggesting same bias, one can go long with strict stop loss of swing low of 289.90
Overall chart along with possible Elliot wave counts
macd positive
rsi breakout and rsi positive divergence
Most investors treat trading as a hobby because they have a full-time job doing something else.
However, If you treat trading like a business, it will pay you like a business.
If you treat like a hobby, hobbies don't pay, they cost you...!
Disclaimer.
I am not sebi registered analyst.
My studies are for educational purpose only.
Please Consult your financial advisor before trading or investing.
I am not responsible for any kinds of your profits and your losses.


Nifty correction Analysis ELLIOT WAVE Nifty expecting sharp rally upside as reaction C Wave for target 18350-18500

DJIA SUPERCYCLE DEGREE WAVE 5TVC:DJI
In Supercycle Degree Wave Five.
The Bull Market has long way to go for another 21 years.

TATA MOTORS WAVE 3 OF BULL MARKETNSE:TATAMOTORS
Seems to be breaking out in 3rd wave of Bull Market
440 is next resistance to break.
Above 440 it will confirm Bull Market in wave 3.
Which can take stock to 3x-4x from CMP

MCX Natural Gas – Elliott Wave projectionNatural gas has completed the impulsive cycle at 801 and started collapsing to form the corrective process. In this corrective cycle, the price has accomplished the corrective wave B and started constructing wave C of normal zigzag correction.
There are two reversal points for natural gas:
1) Wave C can occur near wave (4)
2) wave C can accomplish its corrective cycle at 219.8 where wave A=C.
If the price sustains below the lower band of the channel, traders can expect the following targets: 288 – 275 – 267 . According to Elliott waves, correction can occur near wave (4) of the previous cycle. I already mentioned expected reversal points.

Nifty Auto Elliott Wave ForecastWhile the Fundamental Analysts might find Auto Valuation High.
Auto stocks have much higher to go.
Nifty auto index in 5th wave of Bull Market.
Fresh breakout in smaller degree wave 3.
Auto leading the way higher.

Structural Confluence of Elliot and HarmonicsConfluence doesnt mean some indicators and price action .. confluence conditions can be seen everywhere from structure to entry
The above structure shows you confluence with 2 major concepts in trading world HARMONICS and ELLIOT, shows you the possible areas where you could see confluence of both
The 3rd wave could some times be BAT pattern or DEEP CRAB pattern in impulse, when it comes to elliot correction you will prob'ly see ABCD pattern in formation.
This will give you an idea of how to identify the confluence when you are looking for swing trading
Always keep in mind that there will be internal small patterns within the big pattern do not get confused while doing multi TF analysis thinking which pattern to follow, always follow the higher TF pattern.

TATA STEEL WAVE ANALYSISNSE:TATASTEEL
Breaking out in 3rd wave.
A larger degree wave 3 can take the stock many fold in next 4-5 years.
Only if you believe in magic of Wave Principle.
