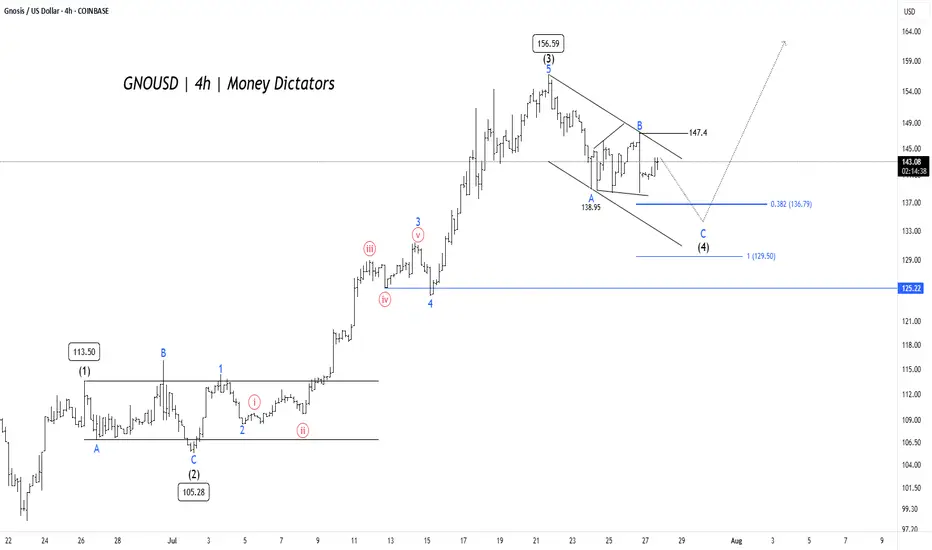
GNO/USD Price Action Aligns for Final Wave 5 PushGNO/USD pair is unfolding a clean Elliott Wave impulse pattern on the 4-hour chart. The rally began with Wave (1) reaching 113.50, followed by a corrective Wave (2) that bottomed near 105.28. This set the stage for a powerful Wave (3) that surged to 156.59 , aligning well with Elliott Wave theory where Wave 3 is typically the strongest and steepest leg in the sequence.
Wave (4) is now in progress, taking the form of an A-B-C correction inside a descending channel. Interim support was found at 138.95 during Wave A, and Wave C could extend toward the 0.382 Fibonacci retracement level at 136.79 or the deeper support zone near 129.5. These levels are crucial, as they often mark the end of a corrective phase and the beginning of the next impulse. A confirmed breakout above 147.4 would signal the start of Wave (5) and the return of bullish momentum.
Short-term targets have the potential to reach 135 – 128 , while 125.22 remains the invalidation level for this bullish setup. After the completion of Wave (4), traders can look for long opportunities targeting 147 – 154 – 172 . As long as the structure holds and price respects key supports, the outlook remains favorable for a fresh push higher in Wave (5).
Elliottwaveprojection
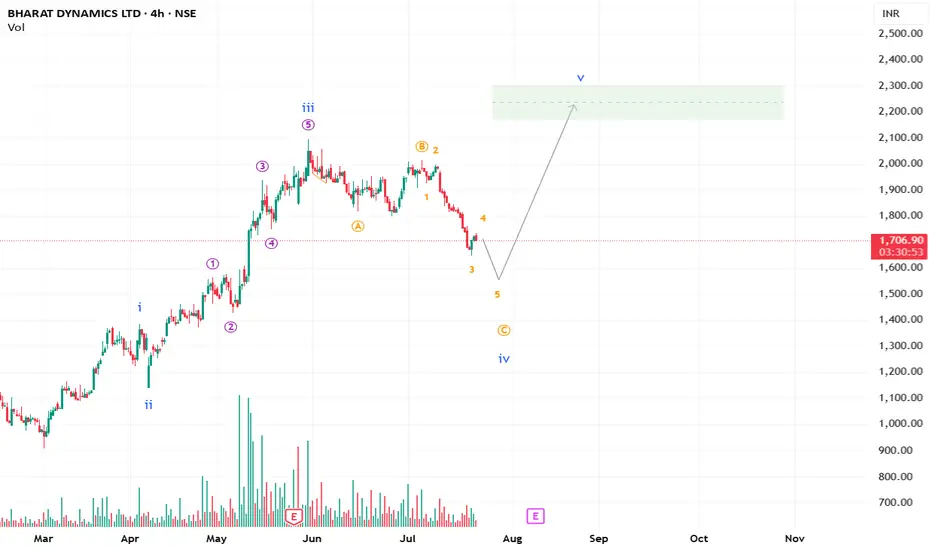
IS BDL ready to move after an intraday fall?A beautiful 5-wave structure looks to be in place for BDL. A little patience may be required to get more clarity.
Let's keep Nifty rollin'The guideline of alternation in Nifty in the current unfolding impulse-like move. Keeping the fingers crossed.

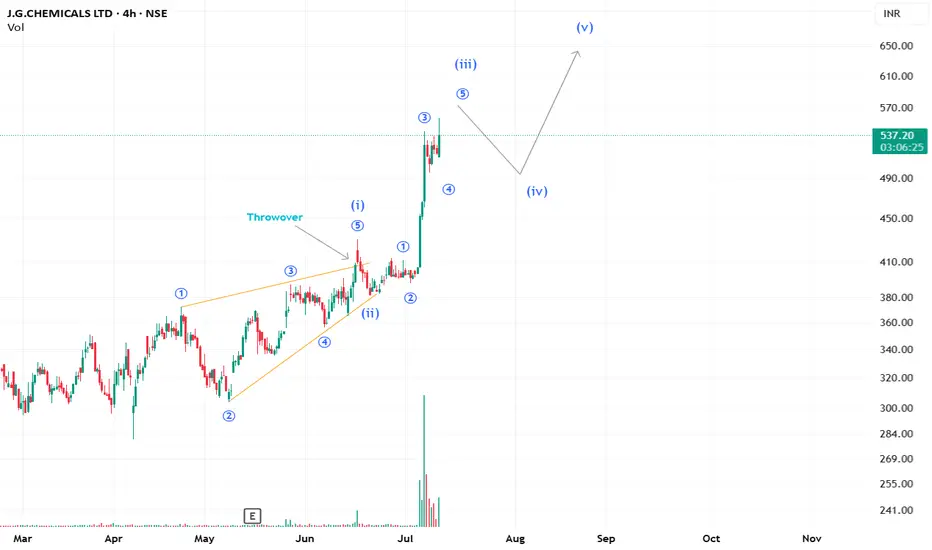
A good 5 wave patterns unfolding in J.G.ChemicalsCurrently, it seems that J.G. Chemicals is unfolding into a clear extended 3rd wave move. We may see a retracement and then a resumption of the trend.
Love,
PipVoyager
**This analysis is based on the Elliott Wave Principle.
This analysis is for educational purposes only and not investment advice.
Please consult your SEBI-registered advisor before making any investment decisions. Markets are subject to risk.**
BEL hits key level, a cool off ahead before next leg up?Bharat Electronics is unfolding a clean impulse. After completing Wave ii at 304.80, price surged into Wave iii, which has now reached the 1.618 Fibonacci extension near 410. Interestingly, while price made new highs, RSI is showing early signs of bearish divergence, hinting at a possible Wave iv pullback. The retracement zone between 385 and 370 may act as support before the uptrend resumes. As long as price holds above 319, the bullish structure remains valid.
Disclaimer:
This analysis is for educational purposes only and does not constitute investment advice. Please do your own research (DYOR) before making any trading decisions.

BANKNIFTYHello and welcome to this analysis
Bank Nifty appears to be in its Elliott Wave 5 that is likely headed for 57500-58000
Approximate date as per Ichimoku Time & Wave theory is around 18th June
This rally is most likely initially going to be lead by large PVT banks and towards its end by PSU Banks
Plan your trade, trade your plan

Apollo Tyres: Navigating the WavesWelcome to RK_Chaarts.
Today, we're analysing the daily time frame chart of Apollo Tyres from Elliott waves perspective. Here, we can clearly see that the intermediate-degree Wave (3) (blue) formed a high around ₹555 in February 2024. After that, an A-B-C corrective pattern unfolded in a 3-3-5 expanded flat structure, which is Wave (4) blue intermediate-degree. We can say that Wave (4) possibly ended at the March 2025 low around ₹370.
Now, we're possibly unfolding Wave (5) in blue of the intermediate degree, which will have five sub-divisions: of minor-degree Waves 1-5 (red). Possibly, Wave 1 (red) has ended, and Wave 2 (red) is currently unfolding. After Wave 2 ends, the price may reverse upwards, forming Wave 3, followed by Wave 4's retracement and then Wave 5's high.
Where can be next possible reversal
On the weekly timeframe, the price is moving within the upper Bollinger Band zone. The weekly 20-Weekly simple moving average (or 20-week simple moving average), which is the mid-Bollinger Band, is around ₹440-₹437. It's possible that Wave 2 will find support around this level and then reverse upward.
Invalidation level
Note that Wave 2 cannot retreat more than 100% of Wave 1, according to wave theory principles. The low of ₹371, where Wave 1 began, is the invalidation level. If the price breaks below this level, it may trigger an invalidation, and we might be looking at a double correction or a double three structure instead.
Projected Targets
However, if the invalidation level holds, the upward movement will likely continue. The projected target for Wave 5 could be around ₹555-₹603, based on the ratio analysis of Waves (3) and (4).
Important Notes
- Breaking below the invalidation level would require re-evaluation of the wave count.
- Sustaining above the invalidation level increases confidence in the projected target.
Let's see how the market unfolds. This entire study is shared solely for educational purposes. Thank you so much.
I am not Sebi registered analyst.
My studies are for educational purpose only.
Please Consult your financial advisor before trading or investing.
I am not responsible for any kinds of your profits and your losses.
Most investors treat trading as a hobby because they have a full-time job doing something else.
However, If you treat trading like a business, it will pay you like a business.
If you treat like a hobby, hobbies don't pay, they cost you...!
Hope this post is helpful to community
Thanks
RK💕
Disclaimer and Risk Warning.
The analysis and discussion provided on in.tradingview.com is intended for educational purposes only and should not be relied upon for trading decisions. RK_Chaarts is not an investment adviser and the information provided here should not be taken as professional investment advice. Before buying or selling any investments, securities, or precious metals, it is recommended that you conduct your own due diligence. RK_Chaarts does not share in your profits and will not take responsibility for any losses you may incur. So Please Consult your financial advisor before trading or investing.

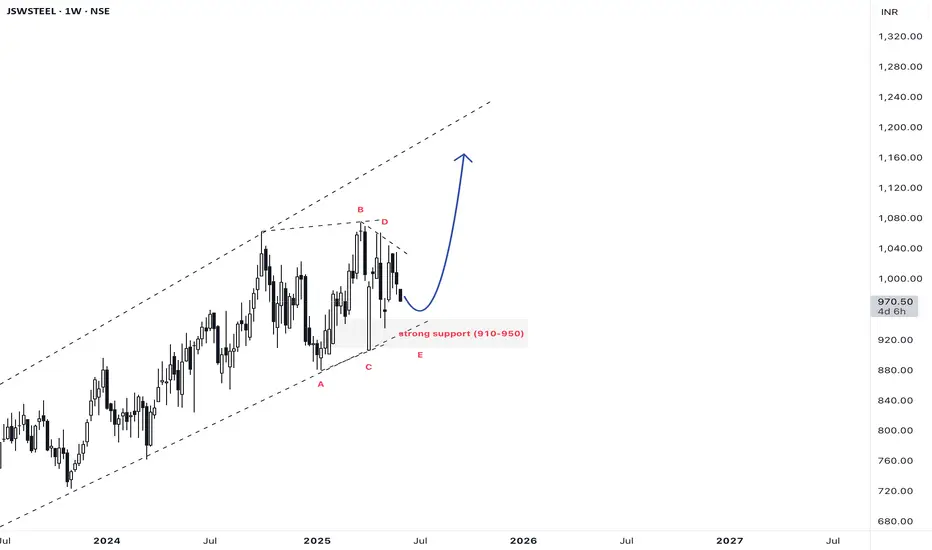
JSWSTEEL: End of Triangle patternFrom the High of 1063Rs to bottom 878Rs , JSWsteel tried to break the high and went sideways, Price seems to be exhausting, Potential zone for Buyers hold between 910-970 for expected rally 1150+Rs.
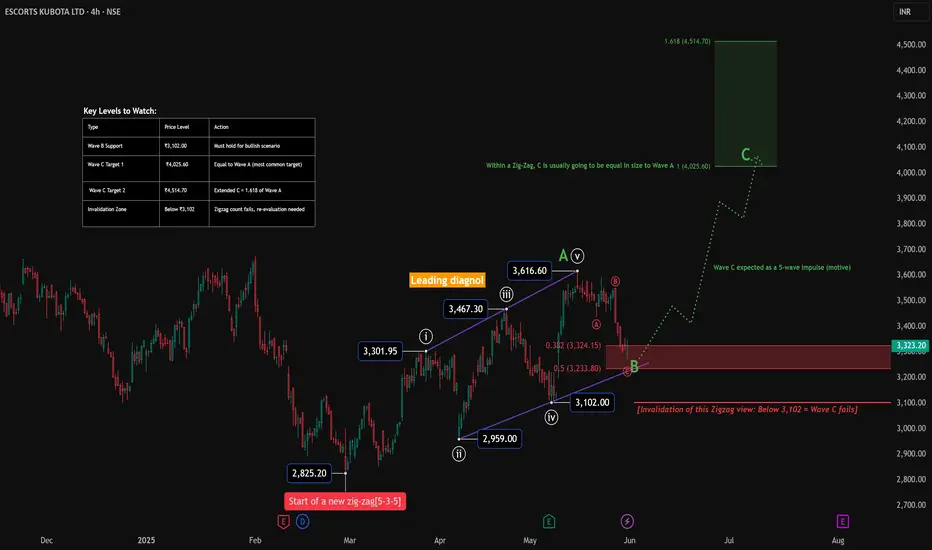
Zigzag in Play- Can Wave C deliver the goods for ESCORTS KUBOTA?ESCORTS KUBOTA – A Zigzag Taking Shape
Structure Summary:
ESCORTS may be unfolding a classic Zigzag correction (5–3–5) from the low at ₹2,825.20. Wave A formed a clean leading diagonal. Wave B is currently developing and is expected to end near the 0.382–0.5 retracement of Wave A.
If this structure holds, we could soon see a powerful Wave C impulse aiming for the 4,000+ zone.
Elliott Wave View:
Wave A : Leading diagonal from ₹2,825.20 to ₹3,616.60
Wave B : Still developing – may complete near ₹3,233.80 (0.5 retracement)
Wave C : Expected to be a 5-wave impulse targeting:
₹4,025.60 (1.0 × Wave A)
₹4,514.70 (1.618 × Wave A)
Key Levels to Watch:
Wave B Support Zone: ₹3,233–₹3,102
Target 1: ₹4,025.60 (equal to Wave A)
Target 2: ₹4,514.70 (1.618 × Wave A)
Invalidation : Below ₹3,102 → Zigzag scenario fails, alternate count required
Note:
Wave C, if it triggers, should develop as a 5-wave impulse. Price action around the retracement zone will decide whether bulls still have control.
Disclaimer:
This is part of the educational WaveTracker series. It is not a trading recommendation.
Always DYOR and manage risk wisely.
EURJPY: Short Setup with Target Zones in FocusEURJPY outlines a clear W-X-Y corrective pattern. Wave (W) ended at 161.297 , followed by an upward corrective move in Wave (X), which topped at 162.665 with a classic ABC formation.
Currently, the price is hovering around 162.084, likely forming Wave B of the final Y leg. A brief move higher could complete this B wave before the pair resumes its decline toward the 160.922–160.680 area, which marks the projected end of Wave C of (Y).
The broader correction is framed by two descending blue trendlines, providing dynamic resistance and support, while a short-term red ascending trendline is currently holding the price action but may soon give way. If the price stalls or rejects around the 162.3–162.5 zone, it could signal the start of the next leg down, making it a potential setup for short positions. After the reversal from Wave Y, potential upside targets are 161.600, 162.500 , and 163.100 .
We will update it soon!

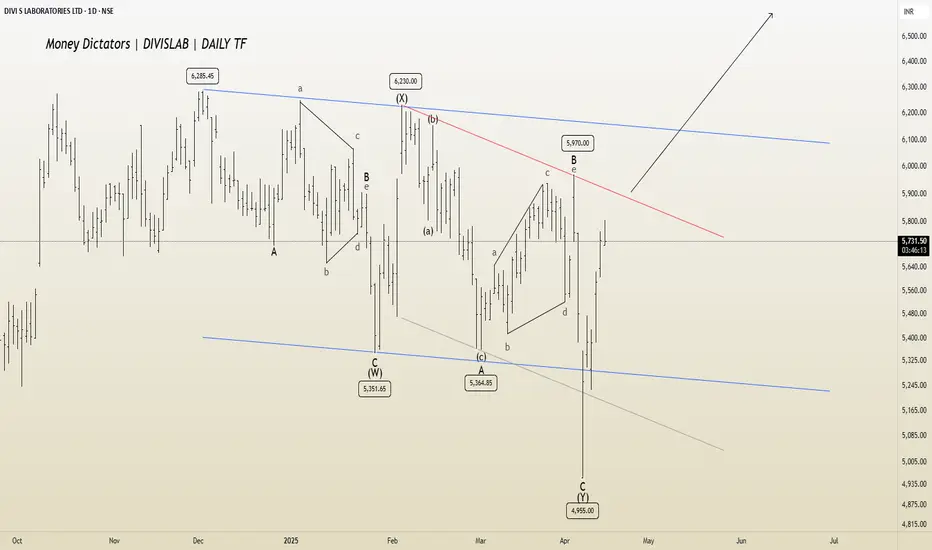
DIVISLAB: Eyeing Breakout from A-B-C Channel Daily TF
DIVISLAB is nearing the completion of a complex W-X-Y corrective pattern. A long position could be considered after a breakout from the A-B-C channel, with potential targets in the 6100–6400 range.
I will update more information soon.
Comprehensive Research - McDonald’s Stock Set to SoarQuick read:
McDonald's stock is poised for a bullish move, with Wave 3 likely starting and strong support near 290.50–295.00. Traders should long on dips within this range, for next resistance levels, 326.00 and 348.00 with a invalidation below 276.00. This setup offers a solid risk-to-reward in a long-term uptrend. Alternative safe entry is possible after the break of corrective channel breakout of wave (2).
Elliott Wave Forecast:
TF - Daily
The chart suggests that McDonald’s stock is in the middle of a larger upward move known as Wave C, which comes after completing a complex correction. Wave C is expected to unfold in five smaller waves, a pattern that usually points to a strong uptrend. It appears the correction is behind us, and a fresh bullish phase is underway.
Starting from the low at 276.53 , marked as Wave B, the price climbed to 326.32 , forming Wave one. After that, the stock pulled back to 290.50 , forming Wave two. This pullback followed a typical ABC pattern within a corrective channel, which often signals the end of a downturn and the beginning of an upward move.
Now, Wave three seems to be starting, and this is usually the strongest part of Wave C. The price is expected to move above 335 , take a small pause for Wave four, and then rise again to complete Wave five somewhere around 345 to 350 dollars. This positive outlook remains intact as long as the price stays above 290.50 . With the breakout from the corrective channel, the setup looks strong and clear for buyers.
Fibonacci levels:
Fibonacci Extension Targets:
1.000 extension: 326
1.618 extension: 348
Correction Retracement Levels:
Wave 2 retracement: 78.6%
A = C in A-B-C correction: 289.21
Price Action & shifting of value:
TF: Weekly
McDonald’s stock has been steadily climbing inside a rising channel since late 2020, showing a clear long term uptrend. The price has respected both the top and bottom edges of this channel very well, and interestingly, the middle line has acted like a pivot, providing support or resistance multiple times over the years.
Recently, the stock made a higher low at 276.53 and bounced back strongly, keeping the bullish structure intact. It then pulled back to 290.50 , right around the middle line of the channel, and held above an upward sloping trendline. This kind of price action shows strength and suggests buyers are stepping in.
The sharp move from 276.53 up to current levels looks like a strong bullish leg, possibly driven by accumulation. If the stock can break above its recent high of 326.32 , it could head toward the upper end of the channel. As long as the price stays above 290.50 and especially above 276.53 dollars, the bulls remain in control. Even if the price dips a bit, the long term trend stays positive unless the lower boundary of the channel breaks down.
I will update more Information here.

EUR/NZD Wave Structure Shift: 4th Wave Correction in ProgressThe 3rd wave in EUR/NZD appears to have been completed, and the market seems to be entering the 4th wave. There is a possibility that the 4th wave could take support near the Fibonacci 0.5 level (1.19164). After that, the 5th wave of the impulse phase may move upward.
If the market falls below 1.98303, it would confirm the beginning of the 4th wave. In that scenario, the first target could be around 1.95907 .

NSE IONQ - Are we ready for a breakout?The corrective phase is complete and an impulse move appears likely. A strong buy above the A-B-C channel could target levels around 30 - 37 - 45 or higher. Good entry is possible above 26 . However, if conditions worsen, further corrections may ensue.
I will update further information soon.

NVDA’s Final Act: A Breakout Waiting to HappenNVDA appears to be nearing the completion of its corrective phase, setting the stage for a potential move to new highs. The current pattern resembles a falling wedge, indicative of an ending diagonal formation, which often signals a reversal and the start of an upward trend.
The structure of the corrective channel, along with the termination of the diagonal pattern, suggests a high likelihood of a running flat formation. Buyers are likely to intensify demand pressure as the price approaches the lower boundary of the trendline. A trend reversal may occur if there is a decisive breakout above the Wave 4 level of the ending diagonal.
Buying opportunity with minimal stop is possible after the reversal from lower side of the channel. Targets can be 112 - 120 - 132 - 140.
I'll be sharing more details shortly.

XAU/USD: 5th Wave Rally After CorrectionOn the 1-hour timeframe, XAU/USD has formed an Elliott Wave corrective structure. This is an expanded flat correction, typically seen in the 4th wave. The correction seems to have been completed at 3,054, suggesting that the 5th wave may be in progress.
For bullish traders, a potential long position can be considered around the 0.236 retracement level as a pullback entry point.
The 5th wave has the potential to reach the following upside targets: 3,110, 3,145, 3,165
However, this bullish outlook remains valid only if the low of Wave IV holds. A breakdown below this level would invalidate the bullish scenario.

GBP/USD Technical Outlook: Elliott Wave Mapping the Next MoveThis GBP/USD 4H chart presents an Elliott Wave analysis.
Wave (1) and (2): The market had an impulsive bullish movement in Wave 1, followed by a corrective Wave 2.
Wave (3): A strong bullish move with momentum.
Wave (4): A corrective phase, forming a triangle pattern (a-b-c-d-e), which suggests the market is preparing for another impulsive leg.
Entry Confirmation: A breakout above the triangle pattern.
First Target: 1.31457 (Fibonacci 0.382)
Second Target: 1.32105 (Fibonacci 0.5)

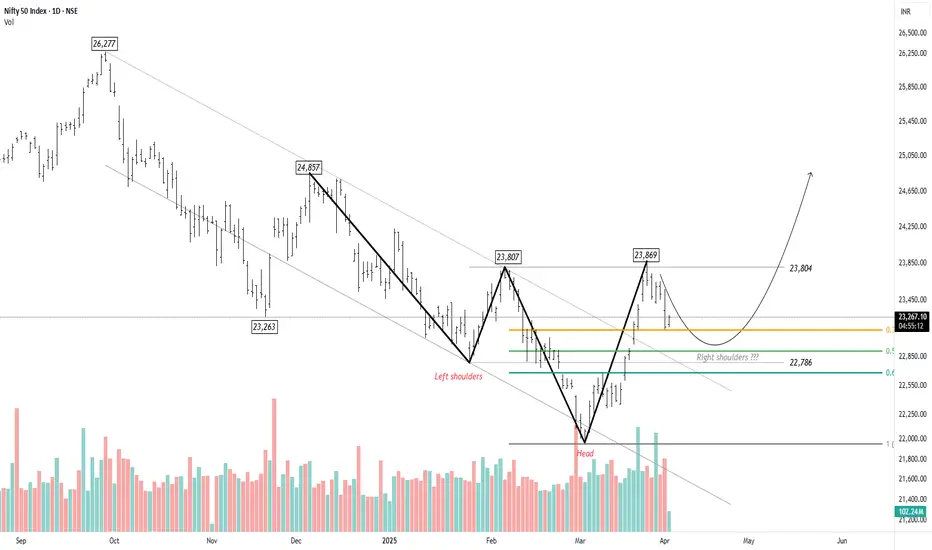
Nifty - Awaiting the Fifth Wave for a BreakoutNifty recently hit a low of 21,905 , marking a key reversal point in the trend. A well-defined Head and Shoulders pattern is emerging, with the right shoulder currently forming. The ongoing pullback has retraced to the 38.2% level, but there is potential for it to extend towards the 50% mark at 22,906 . However, the upward move appears to be losing momentum, with buying interest remaining subdued.
Based on the chart, the head of the pattern signifies the beginning of a new impulse wave. This appears to be the fourth wave within the larger first wave. Once Nifty completes this corrective phase, the fifth wave is expected to present a trading opportunity. If wave equality holds, Nifty could potentially rise to 24,857 .
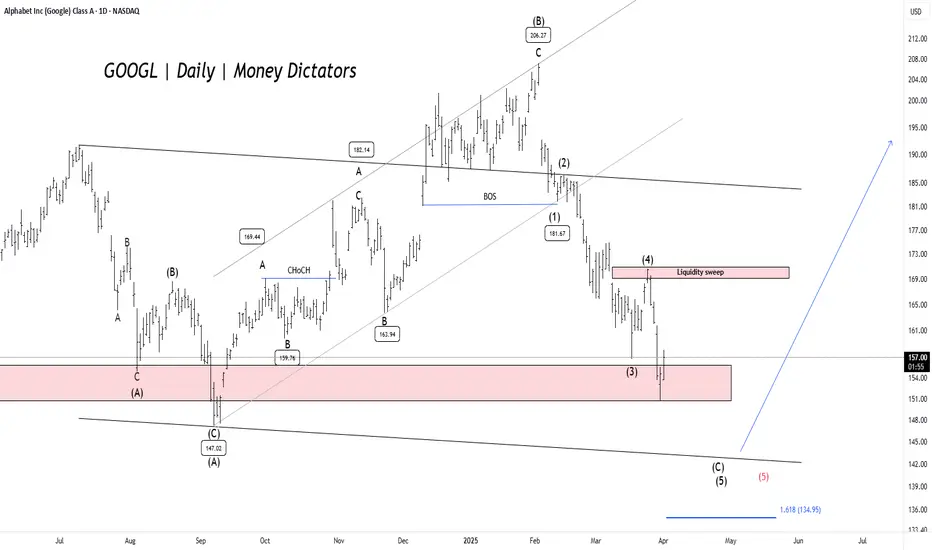
GOOGL - Elliott Wave Final ShowdownGOOGL has dropped over 27.28% , reaching a minor profit-booking zone. The $150 level serves as a key demand zone, where a potential price reversal could occur. The formation is either expanded flat or a running flat on the daily timeframe chart.
Confirmation is best observed near the lower trendline of the parallel channel. If bearish momentum persists, prices may decline further to the $142-$140 range before a strong rebound. Once the correction ends, the upside targets are $168, $180, and $195.
A new low will form if the previous low is breached. Further research will be uploaded soon.
Is Bitcoin on the Verge of a Massive Breakout?Bitcoin's wave ((4)) has successfully completed a W-X-Y corrective formation. If Bitcoin manages to decisively break above the key resistance level of 88,826, it could trigger a powerful impulsive rally, potentially driving prices toward the next major targets at 95,250 - 99,508 - 109,176.
Additionally, the parallel channel's lower trendline is offering substantial support, preventing further downside movement. A strong breakout above this channel could significantly enhance bullish momentum, increasing the probability of Bitcoin reaching new all-time highs. We will update you soon!

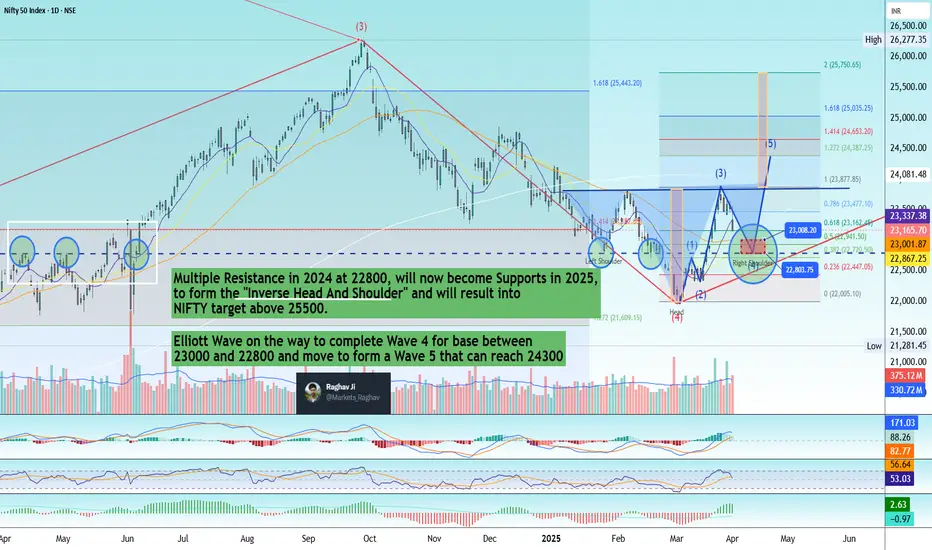
Shocked by Nifty50's sharp correction? Don't worry!Today NIFTY has crashed by 350+ points and reached 23165, a correction from 23800 levels .
Let me explain, This Nifty Daily chart is a classic example of how many fundamentals of Technical Analysis are satisfied.
1) Old resistances in 2024 at 22800 will now become Support levels
2) If it goes to 23000 and stops at 22800 levels it also fulfils the Wave 4 criteria, which says that Wave 4 never gets in Wave 1 territory
3) If this happens, the chart also completes an Inverse Head and Shoulder's Right Shoulder bottom to make an up-move towards the Neck.
4) if it crosses the Neck, the targets of Nifty will be above 25500, which will be 2500+points.
Technicals are beautiful only when you practice them.
Is gold going to be eclipsed?
-------------------------
Timeframe: 240 Min
-------------------------
The price action suggests a completed impulse structure originating from the 2833 low, with gold now trading at an all-time high. Based on cluster zones and Fibonacci extensions, wave (5) still has the potential to extend toward the 3150-3200 range. This zone represents a key resistance level where buying momentum may slow down, signaling an impending shift in market dynamics.
Once wave (5) completes, it will mark the end of wave ((3)) of a higher degree, setting the stage for a corrective move. A retracement toward the previous wave (4) level is expected as wave ((4)) develops, aligning with historical corrective behavior after extended rallies. This phase will provide crucial insights into the market’s next major move. Stay tuned for further updates.

BANKNIFTY: Elliott Wave AnalysisBANKNIFTY counting using Elliott Wave theory is done from 13th January.
We can see FLART- ZIGZAG- ZIGZAG CORRECTION marked in the chart.
The top made on 6th February is marked as wave (W) because it has 3 moves in it.
The fall after that was sharp and fast. This is the characteristic of wave (X).
Now, according to my analysis price is standing on wave (B) of wave (Y).
and as per previous observations, wave (Y) always crosses the top of wave (W), so we can expect it to go up to 100% extension.
This not any buying or selling recommendation.
This analysis is based on Elliott Wave theory and Fibonacci.
For educational purpose only.
