Go long on Nifty
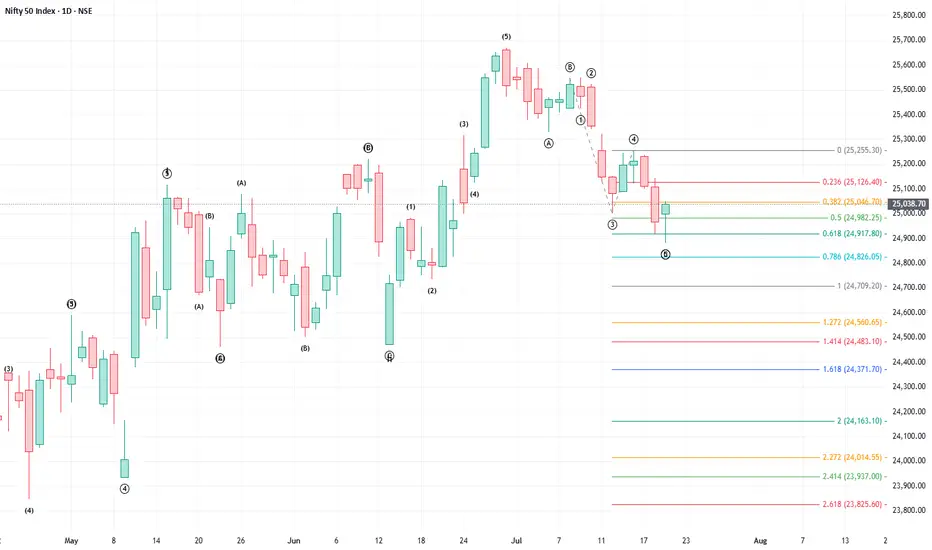
Refer to my earlier publication on Nifty Trajectory wherein I had mentioned that Nifty is undergoing a correction in the form of a Flat and had correctly predicted that wave C got completed at little over 1 x of Wave A and that one may consider going long on Nifty (May - June consolidation).
Further to this, Nifty completed its first order impulse wave on 1 July and has been undergoing correction in the form of a zigzag. Wave C in all probability is complete at 0.618 fibo extention of wave 0-3 to 4 as given in the charts.
One may consider long position on Nifty with stop loss below today's low.
Elliott Wave
IDFCFIRSTB LONGElliott Wave analysis shows that the stock has completed wave i in black circle. Currently, the stock is undergoing correction wave ii shown in black circle. wave (ii) will move in (a), (b), and (c) in a daily time frame in blue color.
Wave (a) in blue colour is completed and the stock is currently in wave (b).
Wave (b) will unfold in three sub-waves (a-b-c) shown in red colour on the chart.
Wave a and b (red colour) of wave (b) is completed and the stock is in wave c of wave (b).
Wave level is shown on the chart.
Level of Invalidation
The starting point of Wave c has been identified as the invalidation level at 62.40. If the price falls below this level, it can indicate that the expected Elliott Wave pattern is not as it seems.
I am not a registered Sebi analyst. My research is being done only for academic interests.
Please speak with your financial advisor before trading or making any investments. I take no responsibility whatsoever for your gains or losses.
Regards
Dr Vineet

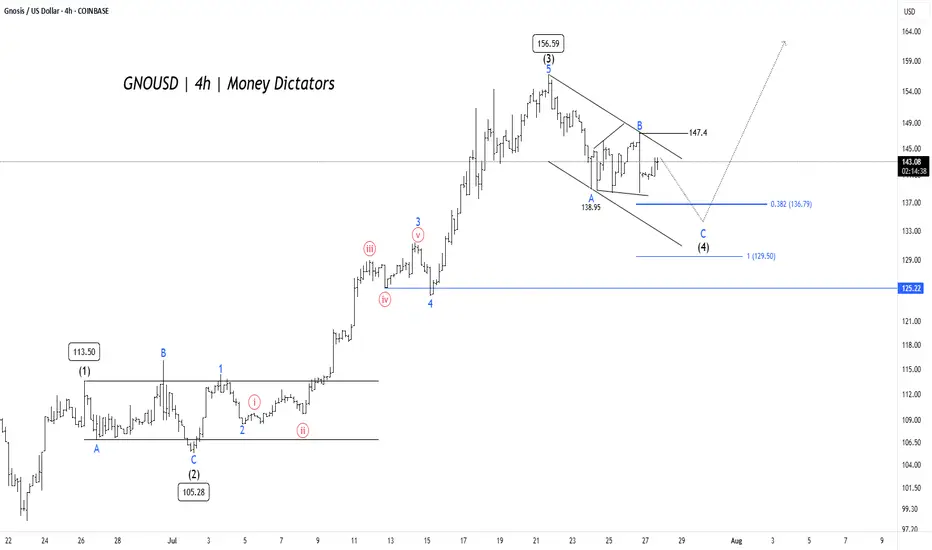
GNO/USD Price Action Aligns for Final Wave 5 PushGNO/USD pair is unfolding a clean Elliott Wave impulse pattern on the 4-hour chart. The rally began with Wave (1) reaching 113.50, followed by a corrective Wave (2) that bottomed near 105.28. This set the stage for a powerful Wave (3) that surged to 156.59 , aligning well with Elliott Wave theory where Wave 3 is typically the strongest and steepest leg in the sequence.
Wave (4) is now in progress, taking the form of an A-B-C correction inside a descending channel. Interim support was found at 138.95 during Wave A, and Wave C could extend toward the 0.382 Fibonacci retracement level at 136.79 or the deeper support zone near 129.5. These levels are crucial, as they often mark the end of a corrective phase and the beginning of the next impulse. A confirmed breakout above 147.4 would signal the start of Wave (5) and the return of bullish momentum.
Short-term targets have the potential to reach 135 – 128 , while 125.22 remains the invalidation level for this bullish setup. After the completion of Wave (4), traders can look for long opportunities targeting 147 – 154 – 172 . As long as the structure holds and price respects key supports, the outlook remains favorable for a fresh push higher in Wave (5).
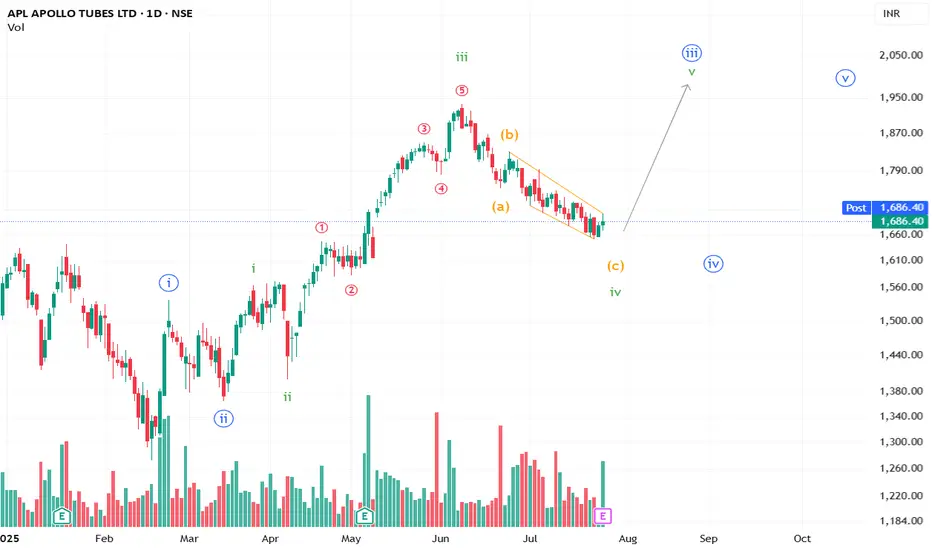
APL Apollo Tubes Limited Set to Surge?A well-formed ABC correction to the downside appears to be losing steam, and an upward move may take shape.
**This is an educational market outlook, not investment advice. Please consult a SEBI-registered advisor before taking any investment decisions.**
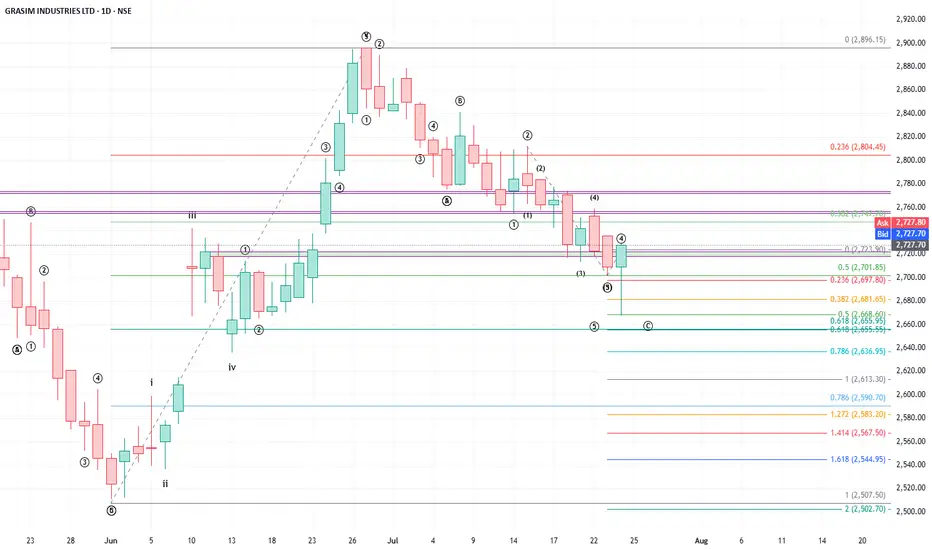
Buy Grasim
Further to my earlier buy call on Grasim given on 30 May, the stock delivered a return of over 15%. The stock completed its next impulse wave and has been undergoing correction since 27 June.
The correction happened in the form of a zigzag which is a 5-3-5 structure. All the wave markings are given in the chart.
The stock in all likelihood has completed correction at 0.5 fibo extension of wave 2-3 to 4 of wave as given shown in the chart.
Buy with a stop loss of 2647.
Target the last high and higher targets will be updated as the wave unfolds.
Happy Trading !!

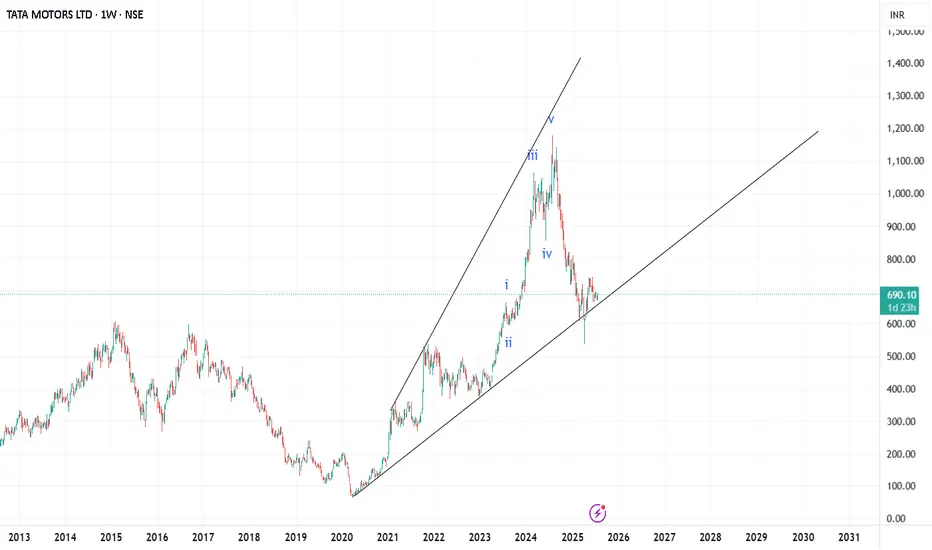
Weekly- End of correctionOn arithmetic scale it looks like a wave 5 extended . But on log scale it is a wave 3 . We have to be pragmatic in order to make money . So if we see a clear-cut wave which is there in this case we need to buy with a sl of wave 4. If wave 4 breaks next SL would be bottom of wave 2 . See the dark green candle there. Correction is over .
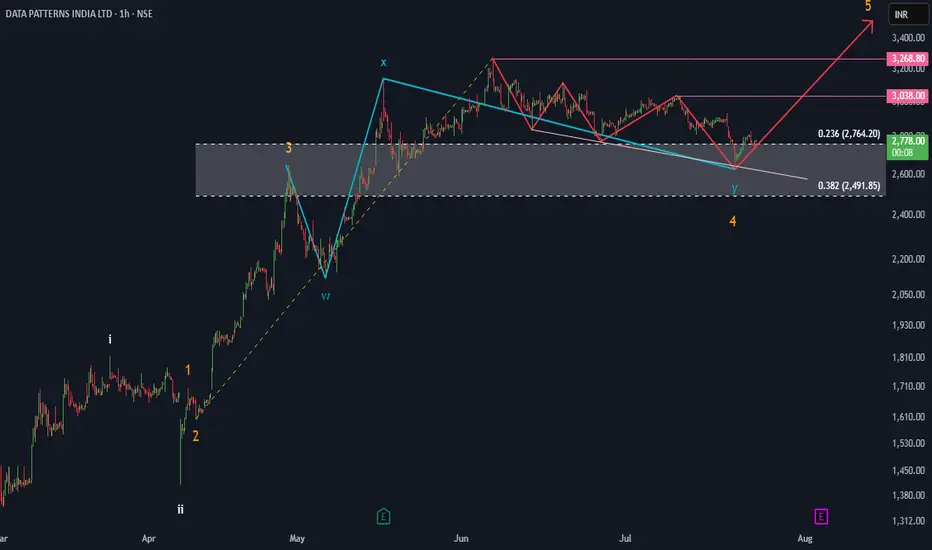
Impulse underway.Stock seems to be moving in an impulsive manner.We can see fractal nature of the price over here as a larger degree impulse's wave 3 has been sub divided in another 5 wave,of which it seems like we are done with 4 waves,and 5th of 3rd has jut commenced.going ahead we can see decent up move in the stock price from current market price of 2778.
once can go long at 2778 with a stop-loss of 2626 on the downside and a target of 3038-3200 giving us a risk reward of atleast 1:2.
Disclaimer :This are just my views on the stock and elliot wave analysis presented is just for my future reference.No position should solely be taken on the basis of this analysis.
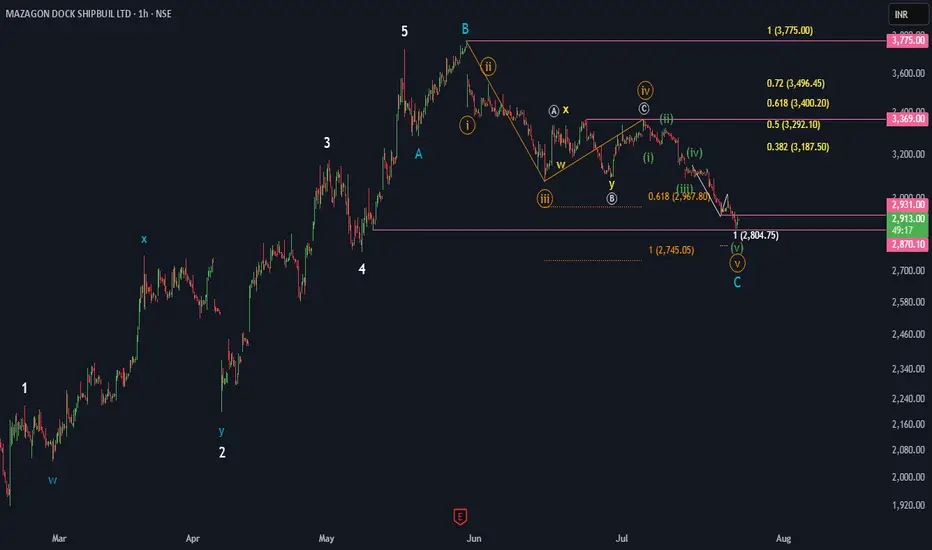
ABC irregular correction nearing a completionOverview:
Prices are making higher high and higher low indicating stock trading in an up trend,here as per Elliot wave theory price is currently unfolding an corrective pattern post and 5 wave 5 impulse which mean post this correction we can expect another impulsive 5 wave move on the upside.
Analysis:
As shown in white color an impulsive 5 wave move got completed at the high of 3775,post which we are seeing an ABC correction marked in BLUE color,this ABC turned out to be an irregular type wherein wave B crossed wave A high,post which we are seeing an impulsive decline marked in mustard color.This wave C impulse's wave 5 is already extended,hence going forward we can we can quick recovery once price crosses 2931 level.
Verdict:
If we get a hourly close above 2931 then one can go long with a stop-loss of 2740 and a target of 3187,3292,3400,3496.
Disclaimer:There is no guarantee of profits or no exceptions from losses. The study provided is solely the personal views of my research. You are advised to rely on your judgment while investing/Trading decisions. Past performance is not an indicator of future returns. Investment is subject to market risks. Seek help of your financial advisors before investing/trading.
I may or may not trade this analysis
EUR/USD Elliott Wave Update –Classic Wave 5 Breakout Opportunity
This chart of the EUR/USD pair shows a well-structured Elliott Wave impulse pattern unfolding on the 4-hour timeframe. The price action is currently progressing in the final Wave (5) of the impulse cycle, which typically represents the last bullish leg before a larger correction begins.
Wave (1): The initial move up from the bottom (early May), showing a clean 5-wave internal structure.
Wave (2): A healthy retracement after Wave 1, forming a base for further upside.
Wave (3): The strongest and steepest rally, as expected in Elliott theory. It broke past previous highs and extended sharply.
Wave (4): A corrective phase that formed a falling wedge pattern — typically a bullish continuation pattern.
Wave (5): Currently in progress. The wedge has broken to the upside, confirming the potential start of Wave 5.
Target 1 (T1): 1.18306
Target 2 (T2): 1.19012
Stop Loss (SL): 1.16600
After a strong uptrend, the market went sideways in a wedge pattern (a typical wave 4 behavior). It has now broken out, signaling the start of the final wave 5 move. This is often a strong and sharp push. Since the breakout is clean and the Elliott wave count aligns well, this creates a favorable long opportunity.

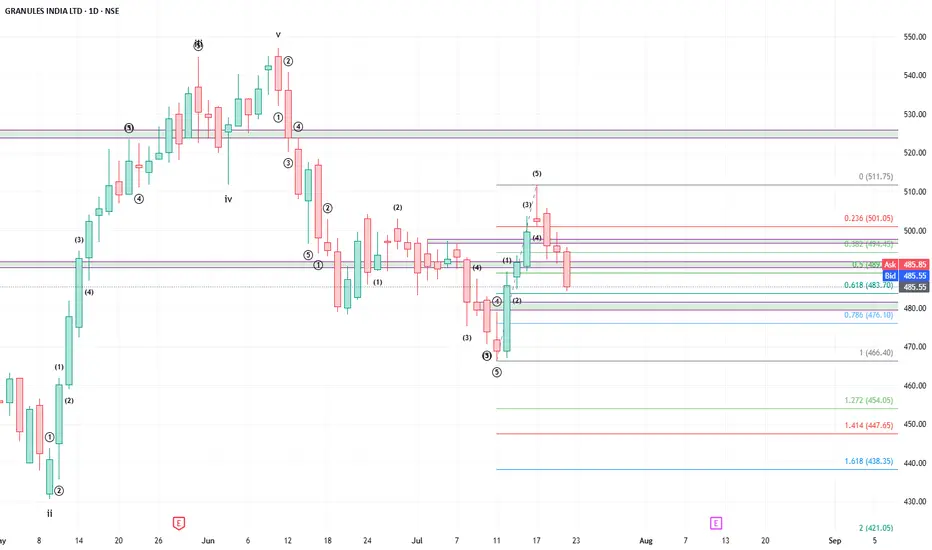
Buy Granules at 483/476 levels, target 545
Granules had completed corrective wave structure of the previous impulse in the form of a zigzag as given in the chart and has since been forming new impulse wave.
Stock has completed wave 1 of lower degree and has been correcting providing a buying opportunity. Stock may take support at 0.618 to 0.786 levels.
Buy in the range of 483 / 476 levels for a target price of 545 or higher. Maintain stop loss of 472
Will revise the targets as the impulse wave continues.
Happy Trading!!
A Bullish Continuation Wedge + Elliott WaveIn NSE:ZENTEC the upward movement is likely to resume.
PLEASE NOTE THAT:
This chart analysis is only for reference purpose.
This is not buying or selling recommendations.
I am not SEBI registered.
Please consult your financial advisor before taking any trade

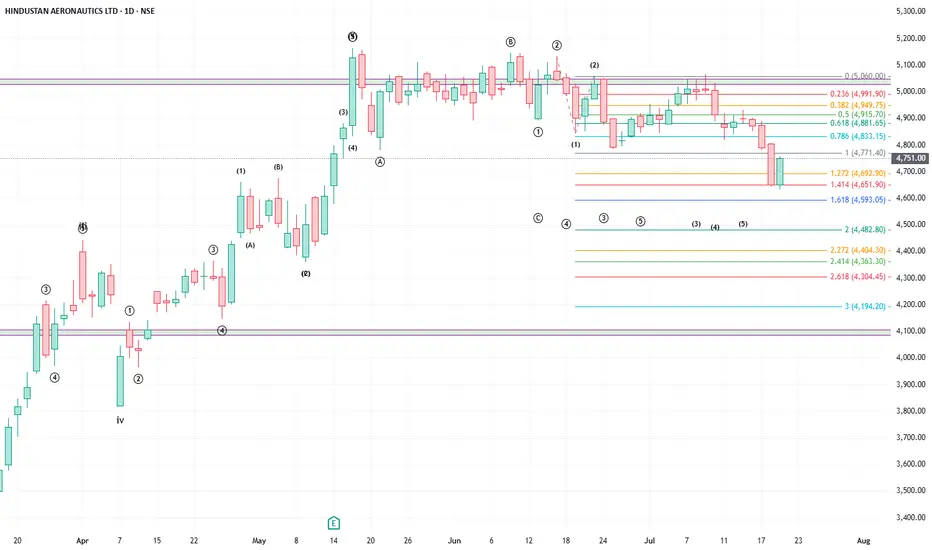
What Is Consolidation? How Can Wave Theory Help You Trade it?
Let’s take HAL as a live example to understand a concept many traders struggle with — "Consolidation".
HAL has been moving sideways ("consolidation") since May 19 and gave a downward breakout on June 24. Yesterday, it formed a strong green candle, which left many traders wondering:
“Is this a buying opportunity or a sell-on-rise setup?”
The conflicting signals during consolidation are exactly what make it confusing. But Elliott Wave Theory can bring clarity.
Wave Perspective: Not Just Sideways — It is a "Flat Correction"
The current price action resembles a Flat corrective structure, one of the three classic Elliott corrective patterns (the others being Zigzag and Triangle). A Flat follows a 3-3-5 structure:
Wave A: Three waves down (corrective)
Wave B: Three waves up (can go above the start of A)
Wave C: Five-wave impulse down — sometimes with an extended wave (i.e. one of the waves shall have 5-sub waves).
Until Wave C fully unfolds, the correction is not complete. Any upside move in between is likely to be a counter-trend wave, not the start of a new trend.
So, What Is Consolidation?
From a wave perspective, consolidation is not random. It’s a structural necessity — the market is completing a complex correction before the next impulsive leg begins.
In strong stocks like HAL, you’ll often see:
A temporary bounce from Fibonacci extension levels which leads to price re-entering Wave 1 territory, which would invalidate an impulse but still fits a corrective structure. A new wave count has to happen again which prolongs the impulse formation. A prolonged sideways to downward move, not because of indecision, but because Wave C hasn’t finished.
How This Helps You Make Better Trading Decisions
The recent green candle may seem bullish, but if it's part of Wave C, it’s just a counter-wave bounce. Elliott Wave structure warns against early entries during such bounces. It suggests a more informed approach: “Sell on rise” until the full correction plays out
Key Takeaway
Consolidation isn’t noise — it’s structure.
When you understand the wave context, you stop guessing and start anticipating.
What’s your view? Are you trading this move or waiting for Wave C to complete? Leave your comments.
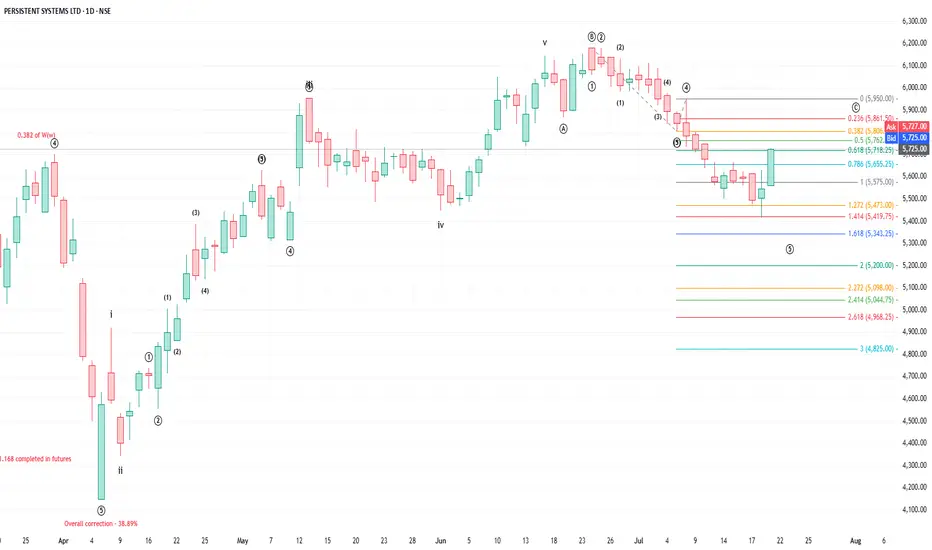
Buy Persistent system, target previous 6184
Persistent System completed larger degree wave 5 and underwent correction of about 40%. The stock completed the larger correction on 7 Apr 2025 and ever since has been forming a new impulse wave.
The stock completed the new impulse wave on 17June 2025 and has been undergoing correction in the form of a flat structure (3-3-5).
Wave C of the Flat (5-wave structure) had a 5th wave extension (as could be found in the wave markings). I was expecting stock to complete the 5th wave extension at 1.618, however stock took support at 1.414 and has started moving up. Stock is up already over 5% from July 18 lows.
One may consider going long when the stock corrects with a target of 6184.
Happy Trading.
Elliott Wave Insights: Clearly indicates the Analytical approachHello friends,
Welcome to RK_Chaarts,
Today we're going to attempt to analyze the chart of Biocon Limited. Clearly, on the monthly timeframe, we can see that we've completed wave ((3)) and wave ((4)), which are of primary degree, marked on chart in Black color. We're currently unfolding wave ((5)), which will have five sub-divisions on the weekly timeframe. The weekly chart also shows that we've completed wave (1) and wave (2) of intermediate degree which we've marked in Blue, and wave (3) has begun, possibly indicating a breakout on the weekly chart. This breakout, having good intensity of Volumes.
Similarly, on the daily chart, we can see that we've completed sub-divisions red 1 and red 2 within wave (3), and possibly started red 3 of (3).
So, based on wave analysis, the outlook appears highly bullish, snapshots are shared below.
Possible Wave counts on Monthly
Possible wave counts on Weekly
Possible wave counts on Daily
The breakout is also accompanied by excellent volume. If we see a dip on lower timeframes, such as Hourly chart, and the price reaches a reliable moving average like the 50-EMA or 200-EMA, it could be a great opportunity to enter. Additionally, friends, we can see on the daily timeframe that a reversal chart pattern has formed and is on the verge of a breakout, with the price standing at the neckline. As soon as this breakout occurs, we can expect further additions. Snapshots are shared below.
Reversal and Bullish Chart Pattern: Inverted Head n Shoulder
Furthermore, we can see that the RSI on the weekly chart has also broken out and is above 60, indicating a strong bullish momentum. Even the MACD has shown a bullish positive crossover and is moving above the zero line on the weekly chart. Additionally, the monthly MACD is also displaying a strong bullish trend, having given a positive crossover and remaining above the zero line. These are all very positive signs. Snapshots are shared below.
RSI Breakout & above 60 on Weekly
MACD on Weekly
MACD on Monthly
We can see that on the weekly chart, the price has crossed above the major EMAs, including the 50, 100, and 200-period EMAs. Now, as the price moves towards its target, these three major moving averages are not obstacles, but rather support levels below. The fact that the price is moving above all these moving averages is a sign in itself.
Looking at the monthly timeframe, we can see that the price has also crossed above the 50, 100, and 200-period EMAs and is moving above them. This is a strong indication of the trend's strength and direction. Snapshots are shared below.
Ema monthly
Ema weekly
So, friends, if our Elliott Wave analysis is correct, and our roadmap is accurate, then as we can see, the monthly chart's wave ((3)), which is of primary degree, marked as rounded three in black, has completed its rounded ((4)) correction or retracement. Now, we're moving upwards towards wave ((5)).
If our wave count is correct, and the structure is right, then according to the theory, wave ((4))'s low, which is around 192, should not be breached. This level will serve as an invalidation level. If the price breaches the invalidation level of 192, which seems unlikely given the positive signs, our wave count will be invalidated, and we'll need to reanalyze it.
On the other hand, based on Elliott Wave theory, the projected target for wave ((5)) is typically between 123.6% and 161.8% of the length of wave ((4)). So, the price may reach or consolidate between the levels of 559 and 672, which are the projected targets based on wave theory, marking the end of wave ((5)) on the monthly chart.
This post is shared purely for educational purpose & it’s Not a trading advice.
I am not Sebi registered analyst.
My studies are for educational purpose only.
Please Consult your financial advisor before trading or investing.
I am not responsible for any kinds of your profits and your losses.
Most investors treat trading as a hobby because they have a full-time job doing something else.
However, If you treat trading like a business, it will pay you like a business.
If you treat like a hobby, hobbies don't pay, they cost you...!
Hope this post is helpful to community
Thanks
RK💕
Disclaimer and Risk Warning.
The analysis and discussion provided on in.tradingview.com/u/RK_Chaarts/ is intended for educational purposes only and should not be relied upon for trading decisions. RK_Chaarts is not an investment adviser, and the information provided here should not be taken as professional investment advice. Before buying or selling any investments, securities, or precious metals, it is recommended that you conduct your own due diligence. RK_Chaarts does not share in your profits and will not take responsibility for any losses you may incur. So Please Consult your financial advisor before trading or investing.

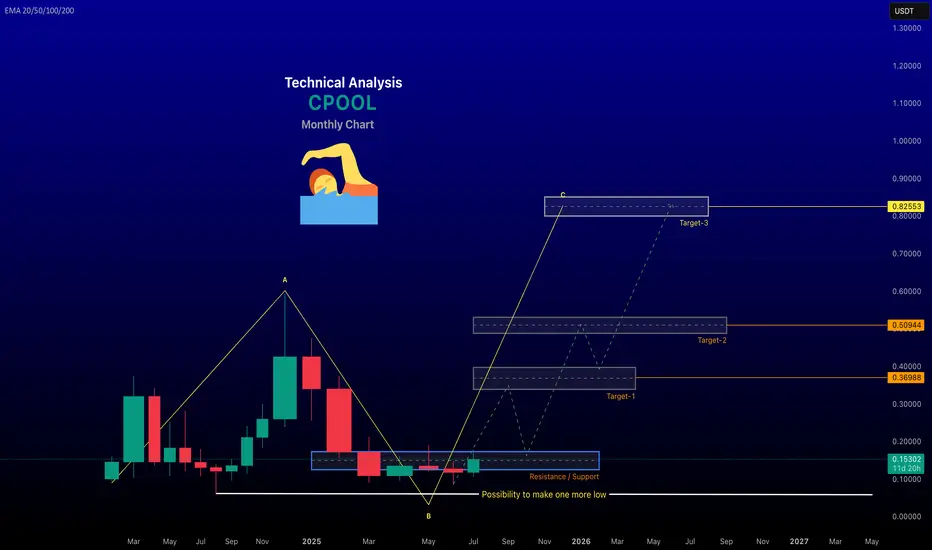
renderwithme || Clearpool (CPOOL) Cryptocurrency Analysis#Overview of Clearpool
(CPOOL)Clearpool is a decentralized capital markets ecosystem that enables institutional borrowers to access uncollateralized liquidity through a DeFi protocol. The CPOOL token is the utility and governance token for the platform, used for voting on borrower whitelisting, staking, and earning rewards. Liquidity providers earn yields enhanced by CPOOL rewards, and the protocol aims to bridge traditional finance with DeFi, targeting the $120 trillion capital markets.
Current Price and Market Data (as of July 20, 2025)Price: $0.1571 USD, down 4.16% in the last 24 hours.
24-Hour Trading Volume: $7,632,433 USD.
Market Cap: $123,303,081 USD, ranking #320 globally.
Circulating Supply: 784,836,183 CPOOL out of a total supply of 1,000,000,000 tokens.
All-Time High: $2.56 (down 95.55% from peak).
Recent Sentiment: Posts on X indicate bullish sentiment, with technical analysis reports showing a 61.54% bullish rating on a 4-hour timeframe on KuCoin.
Technical AnalysisShort-Term Trends: Recent X posts highlight a strong bullish trend on a 1-hour and 4-hour timeframe, suggesting traders may favor long positions. Technical indicators like Moving Averages, RSI, MACD, and others show "Strong Buy" signals on shorter timeframes (5 minutes to 5 hours) but a "Strong Sell" on weekly charts, indicating potential volatility or correction over longer periods.
Risk Assessment: InvestorsObserver rates CPOOL as a medium to high-risk investment due to price volatility relative to trading volume and market cap. Price movements can be significant with limited trading activity, suggesting susceptibility to manipulation or sharp swings.
Key Levels: A clean breakout has been noted, but specific support and resistance levels are not detailed in the provided data. Traders should monitor real-time charts on platforms like TradingView for pivot points and moving averages.
Fundamental AnalysisUse Case: CPOOL’s role in governance and staking gives it utility within the Clearpool ecosystem. The protocol’s focus on uncollateralized lending is unique, appealing to institutions seeking DeFi solutions without traditional collateral requirements. The buyback program, where protocol revenue is used to purchase CPOOL, aims to sustain reward pools and potentially support price stability.
Market Position: Clearpool’s integration of real-world asset (RWA) tokenization positions it in a growing DeFi niche, potentially reducing costs compared to traditional finance. However, its #320 ranking suggests it’s a mid-tier project with room for growth or risk of being overshadowed by larger protocols.
#Price Predictions:
Forecasts for 2025 vary widely:
Optimistic projections: $0.2068–$0.3204 (WalletInvestor, PricePrediction.net).
Pessimistic projections: $0.5024–$0.8255
Contradictory outlooks reflect uncertainty, driven by market sentiment, crypto market trends, and protocol developments. Investors should conduct their own research (DYOR) due to these discrepancies.
Investment ConsiderationsOpportunities: Bullish sentiment, institutional adoption potential, and the buyback program could drive price growth if DeFi and RWA tokenization gain traction.
Risks: High volatility, a significant drop from the all-time high, and a medium/high-risk rating suggest caution. The crypto market’s sensitivity to regulatory, financial, and political events adds uncertainty.
Recommendation: CPOOL may suit short- to medium-term traders comfortable with high risk, given the bullish technical signals. Long-term investors should assess Clearpool’s ability to scale institutional adoption and monitor broader DeFi trends. Always use stop-loss orders and diversify to manage risk.
How to Analyze and Predict CPOOL PriceTechnical Analysis: Use tools like TradingView to track indicators (RSI, MACD, Moving Averages) and identify support/resistance levels. Monitor volume for breakout confirmation.
Fundamental Analysis: Stay updated on Clearpool’s partnerships, borrower onboarding, and protocol revenue for buyback impact. Follow X for community sentiment and news.
Risk Management: Given the high-risk rating, limit exposure and use risk management strategies like position sizing and stop-losses.
External Factors: Monitor broader crypto market trends, regulatory developments, and DeFi adoption rates, as these heavily influence CPOOL’s price.
~~ Disclaimer ~~
This analysis is based on recent technical data and market sentiment from web sources. It is for informational \ educational purposes only and not financial advice. Trading involves high risks, and past performance does not guarantee future results. Always conduct your own research or consult a SEBI-registered advisor before trading.
# Boost and comment will be highly appreciated.
The “M” Pattern: A Swing Trading vs. Wave Trading PerspectiveSwing Trading View
In swing trading, the M pattern is a widely recognized and frequently traded formation. It typically signals a potential trend reversal and is considered the opposite of the W pattern, which indicates bullish setups.
The M pattern presents two main trading opportunities for swing traders:
Short at the Double Top:
When the price forms a double top, traders often enter a short position targeting the neckline as the profit zone. This setup banks on the failure of the price to break previous highs, indicating exhaustion in bullish momentum.
Long at the Neckline Bounce:
If the price reaches the neckline and bounces upwards, traders may initiate a long position, aiming for the previous swing high. This move anticipates a potential failed breakdown or a continuation of the broader trend.
In both cases, trailing stop-losses can be employed to ride the trade further if momentum continues. However, swing traders must rely on discretion and market context to decide when to exit, as there's no deeper structural guide beyond the pattern.
Wave Trading View
From an Elliott Wave perspective, patterns resembling the letter “M” often arise during a Flat correction, one of the three core corrective structures—Zigzag, Flat, and Triangle.
Flat corrections unfold in a 3-3-5 wave structure, labeled as waves A-B-C:
In a bullish market correction,
Wave A: Downward move (3 waves)
Wave B: Upward retracement (3 waves)
Wave C: Final downward move (5 waves)
Flats occur in three variations:
Regular Flat: Waves A and B are nearly equal in length, with Wave C slightly longer.
Expanded (Extended) Flat: Wave B travels beyond the start of Wave A, often reaching up to 1.33x Wave A. If Wave B exceeds 1.33x, it is no longer considered a valid flat.
Running Flat: Wave C does not surpass the end of Wave A, creating a skewed M-like shape.
In this structure:
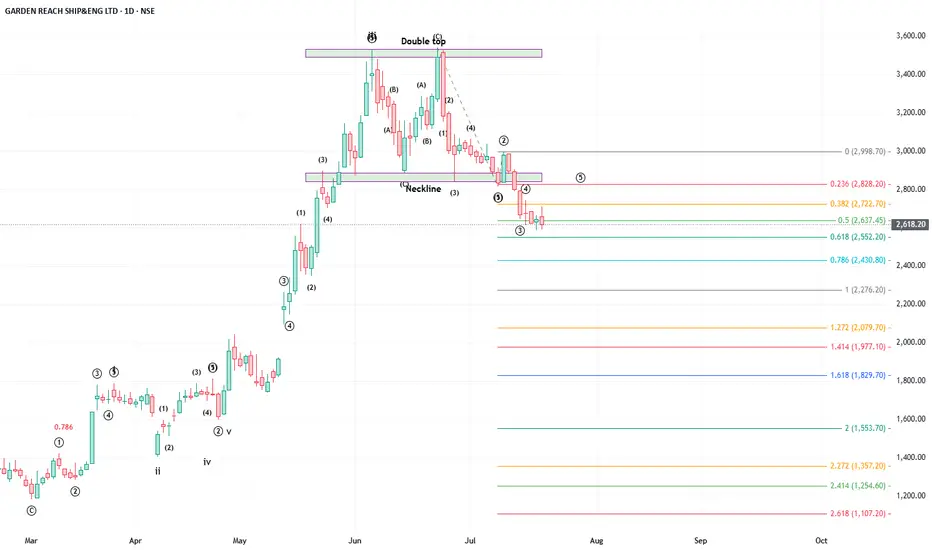
The “M” appearance is most prominent when plotted visually, especially in regular or extended flats (as found in the accompanied chart of GRSE).
The unique edge for a wave trader lies in contextual awareness—knowing where flats are likely to form based on the wave formation.
Unlike swing traders who trade patterns in isolation, wave traders operate within a broader map, allowing them to:
Anticipate the pattern in advance
Position precisely within the structure
Manage trades with greater confidence based on Fibonacci relationships and wave counts
Wave C is particularly important:
It must consist of 5 sub-waves. Its minimum length should be equal to the distance from the start of Wave A to the end of Wave B. Even if this ratio is only marginally exceeded, the presence of a clear 5-wave subdivision confirms the end of the correction, subject to end of sub-wave 5.
In essence, while both swing and wave traders may trade the same “M” pattern, the wave trader approaches it with far deeper context, structure, and predictive insight—enabling more precise and confident trading decisions.
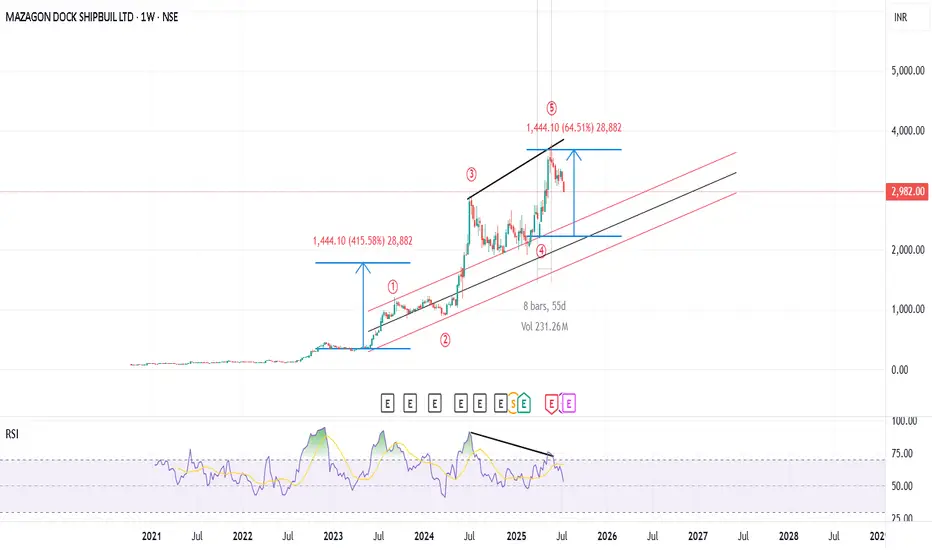
Are 5 waves over ? Lets interpret a wave (Weekly)1. Wave 3 is 2X wave 1 , externally and internally , since wave 2 is shallow.
2. Since wave 3 is the longest (basics) wave 1 and wave 5 should have a Fibonacci connection.
3. Wave 5 is exactly 1.618% of wave 1.
4. Wave 5 should not be more than 0.618% of wave 3 (the longest wave) . Here wave 5 is exactly 0.618% of wave 3.
5. If it is a wave 5 then there should be negative divergence on RSI , which is there and it is strong as wave 5 RSI could not go over overbought range .
All of the above are top out signals and the stock should have been sold for CRT (Cost Reduction Technique). And if one sees the candles there is nothing green about them.
For long term investors wave 5 was made over 8 weeks (9 is a Ichimoku time cycle golden number) . Only if trendline connecting wave 2 and 4 is broken in lesser than 8 time periods , then we can think liquidating the stock , otherwise hold and live through the correction . Regards
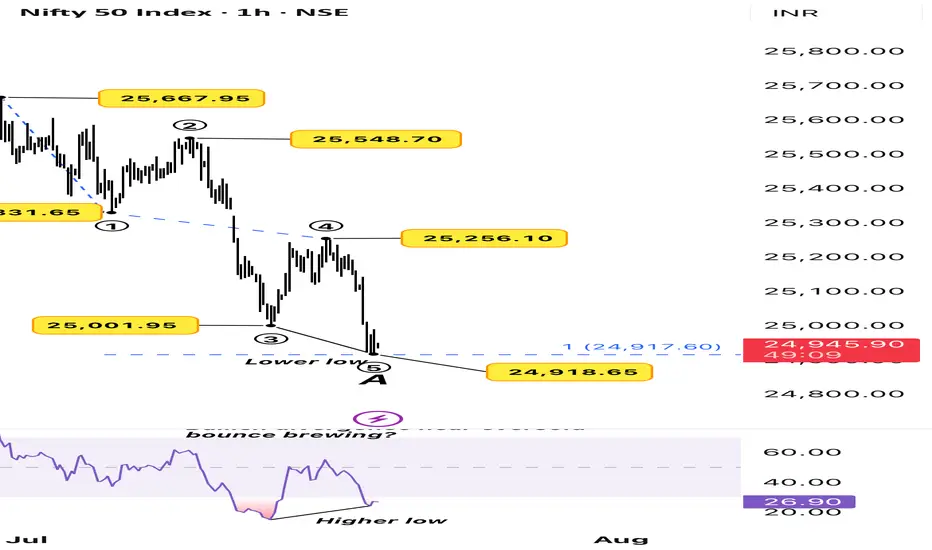
Is Nifty Signaling a Short-Term Bounce?The Nifty 50 has completed a 5-wave impulse on the 1-hour timeframe, with Wave ⑤ tagging a fresh lower low at 24,918, just under the previous swing.
While price made a lower low, RSI made a higher low, forming a bullish divergence just above the oversold zone. This often indicates weakening bearish momentum and a potential for a short-term bounce or a larger correction depending on the context.
We now have:
• ✅ A completed 5-wave(wave A) decline
• ✅ Price at a key support zone
• ✅ RSI divergence adding confluence
If this structure holds, we may have completed wave A and be entering Wave B of correction.
Disclaimer: This analysis is for educational purposes only and does not constitute investment advice. Please do your own research (DYOR) before making any trading decisions.
TATVA LONGElliott Wave analysis shows that the stock has completed waves (i), (ii), (iii), (iv) and (v) downside. Currently, the stock is undergoing correction wave (a), (b), and (c) in a daily time frame.
stock is currently in Wave (a).
Wave (a) will unfolded in five sub waves in red colour.
Wave iii (in red colour) of wave (a) will unfold in five sub waves ( in black circle) on the chart.
Wave levels are shown on the chart.
Level of Invalidation
The starting point of Wave (i) has been identified as the invalidation level at 788.5. If the price falls below this level, it can indicate that the expected Elliott Wave pattern is not as it seems.
I am not a registered Sebi analyst. My research is being done only for academic interests.
Please speak with your financial advisor before trading or making any investments. I take no responsibility whatsoever for your gains or losses.
Regards
Dr Vineet

Varun Beverages Ltd (VBL)VBL in monthly chart completed wave 3rd
and corrective 4th wave's min target 432 too done on down side.
38% 432
50% 357
Expecting it to start the 5th wave up for 700++ target
VBL : Varun Beverages Limited is an Indian multinational company that manufactures, bottles and distributes beverages. It is one of the largest bottling company of PepsiCo's beverages in the world outside the United States.
The Company manufactures, distributes and sells a wide range of carbonated soft drinks (CSDs), as well as a large selection of non-carbonated beverages (NCBs), including packaged drinking water sold under trademarks owned by PepsiCo.
Disclaimer : I AM NOT SEBI REGISTERED . NO BUYING / SELLING RECOMMENDATION. VIEWS ARE JUST FOR STUDY PURPOSE and learning Elliott wave Analysis.

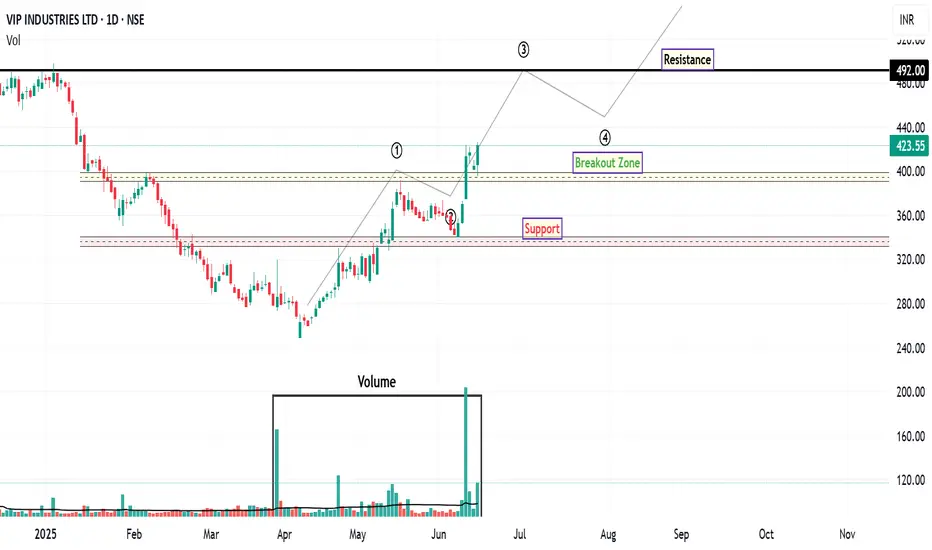
VIPIND: Unlocking Potential After Downtrend
VIP Industries has demonstrated robust bullish momentum over the past few trading sessions, signaling a notable shift in market sentiment. This upward trajectory is particularly significant given the stock's prolonged downtrend since October 2024.
From an Elliott Wave perspective, the recent price action suggests the potential completion of a corrective phase. The retracement from what appears to be Wave 1 to Wave 2 aligns closely with the 61.8% Fibonacci retracement level, which often precedes the initiation of a strong Wave 3 impulse. This potential wave structure, if confirmed, could indicate further upside potential.
A key development supporting this bullish outlook is the stock's recent decisive close above its 200-day EMA, accompanied by a significant surge in trading volume. This confluence of price action and volume confirms strong buying interest and suggests a potential long-term trend reversal. The increased volume further validates the strength of the breakout, indicating broader market participation.
While the immediate outlook appears constructive, traders should be mindful of potential profit-taking around the ₹446 level. This area may present a temporary resistance zone where some short-term corrections or consolidation could occur. However, should the stock successfully navigate this level, the next significant upside resistance target to monitor is ₹492 . This level aligns with prior price highs and could represent a more substantial challenge for further upward movement.
For risk management purposes, a prudent approach would involve considering a stop-loss order positioned below the identified support zone, as depicted on the chart. This strategy aims to mitigate potential downside risk in the event of an unexpected reversal in market sentiment.
Disclaimer: The information provided in this technical analysis is for informational and educational purposes only and should not be construed as financial advice. It is based on observations from the provided chart and commonly used technical indicators. Market conditions can change rapidly, and past performance is not indicative of future results. Always conduct your own comprehensive due diligence and consult with a qualified financial advisor before making any investment decisions.
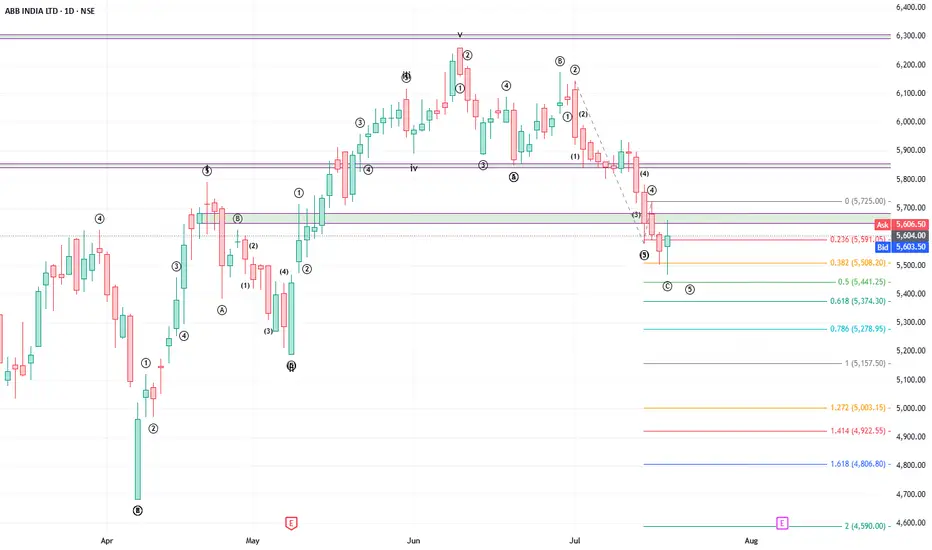
Buy ABB, first motive and corrective wave completed. Target 6255ABB after the long correction had completed its first motive wave on 10th June as a much shorter wave with sub-wave 1 extension.
The stock has been undergoing correction in the form of a zigzag which a 5-3-5 wave structure, generally named ABC. Wave A did not have any internal wave extension. Wave C had a third wave extension. All the wave markings can be found in the chart.
The stock in all probability has completed correction of Wave B at little over 0.382 fibo extension of sub-wave 2-3 to 4 taking support at 50% fibo retracement of the entire wave. I was expecting a fibo extension of 0.5 or higher.
A new impulse wave is expected to take the stock much higher as this will be third primary wave (of larger degree) which is generally a very strong wave.
Buy with an initial target of 6255 with a stop loss of 5409.
PS: In the even if the stock continues correction, it will take support of any of the fibo extension levels and please be guided accordingly.
Happy trading !!