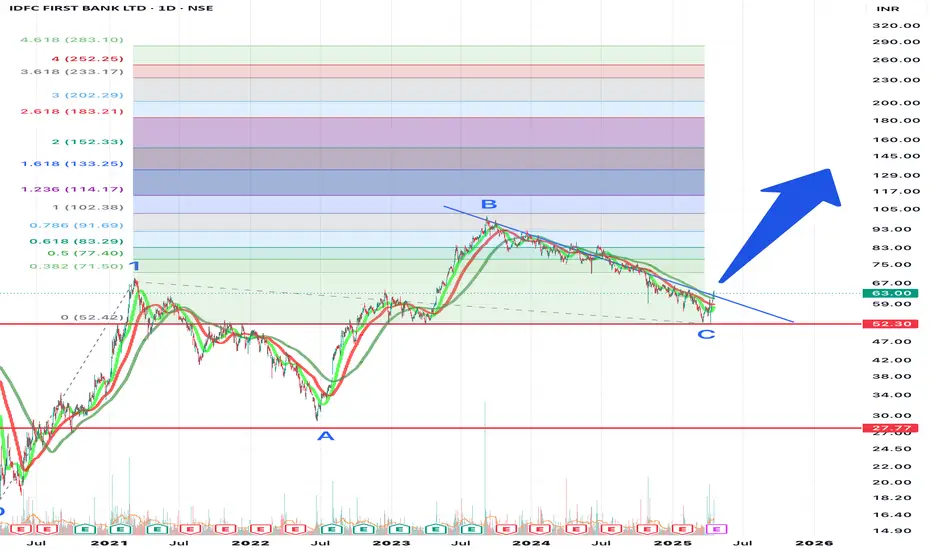
IDFC Elliot wave count (updated)IDFC First bank has a peculiar wave count. A wave was 61.2% of wave 1. Wave B was 161.6% of wave A. Wave C is 61.8% of wave B. I did not mark B as another sub wave 1 as it clearly looked three waves. Wave C low aligns with Wave 1 low and wave A low.
The target for Wave 3 using the channel extension is shown (as minimum) by this year. Looks like If time gets extended to complete wave 3 then wave 3 targets also gets extended.
Is this setup possible? Not sure of the counts. I am using logarithmic scale.
Elliott Wave

IDFC bank strange Elliot wave count IDFC First bank seem to have a peculiar wave count. A wave was 61.2% of wave 1. Wave B was 161.6% of wave A. Wave C is 61.8% of wave B. I did not mark B as another sub wave 1 as it clearly looked three waves. Is this setup possible?
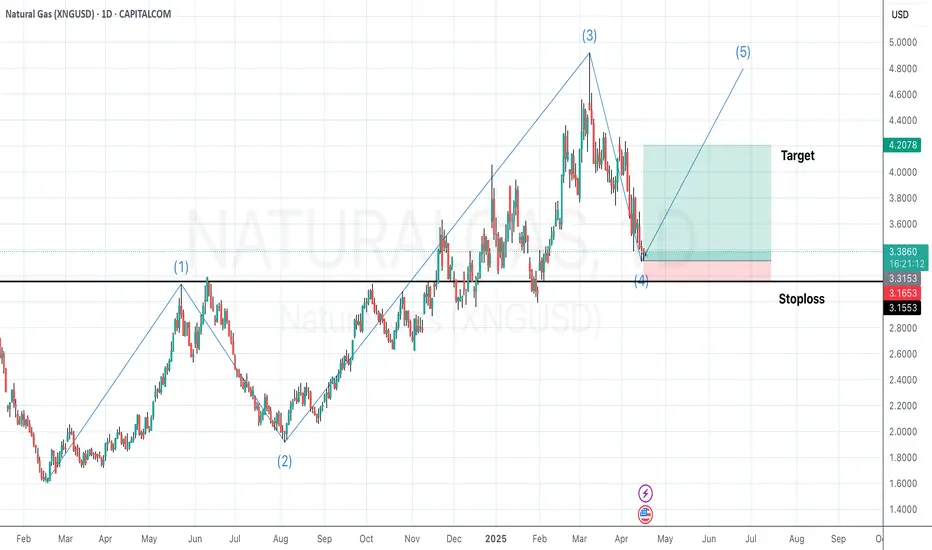
Elliott Wave Analysis on Natural Gas (XNGUSD) – Potential Wave 5We are observing a classic Elliott Wave structure unfolding on the Daily timeframe of Natural Gas (XNGUSD). Here's a breakdown of the current wave count:
Wave (1) started the initial impulse move up breaking the previous downtrend.
Wave (2) retraced sharply but respected the Fibonacci support zone.
Wave (3) extended significantly, following typical wave dynamics.
Wave (4) appears to have completed near a key support zone, aligning with previous structure and a possible Fibonacci retracement level.
🔹 We are now potentially entering Wave (5) — a final impulse leg to the upside in this cycle.
🔹 Entry is anticipated at the completion of Wave (4), with targets projected near the previous swing highs.
🔹 A stop-loss is marked just below the Wave (4) support zone to manage risk effectively.
This setup offers a favorable risk-to-reward ratio , especially if price continues to respect the Elliott Wave pattern.
📌 Disclaimer:
This analysis is shared purely for educational and study purposes. It does not constitute financial advice or a trading recommendation. Please do your own research and consult a financial advisor before making any trading decisions.
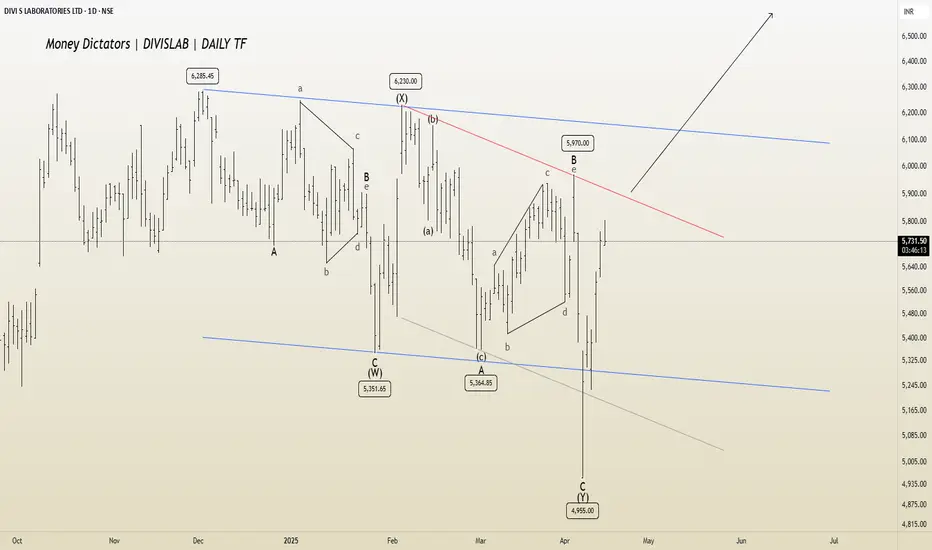
DIVISLAB: Eyeing Breakout from A-B-C Channel Daily TF
DIVISLAB is nearing the completion of a complex W-X-Y corrective pattern. A long position could be considered after a breakout from the A-B-C channel, with potential targets in the 6100–6400 range.
I will update more information soon.
XAU/USD Enters Fourth Wave ConsolidationCurrently, XAU/USD appears to have completed the third wave, and the beginning of the fourth wave seems to be underway, indicating the start of a corrective phase. This correction can potentially extend down to the 3118.486 level. In terms of targets, the key levels to watch are 3166.464 and 3117.451 . Following this correction, there is a possibility that the fifth wave may commence.

XAG/USD Eyes Upside Targets as Wave C MaturesXAG/USD is currently trading in a corrective phase where wave B appears to have completed, and wave C is currently forming. Based on the current price action, it doesn’t seem likely that this entire move will result in a full bullish recovery. The structure suggests that this could be sub-wave C of wave 4, potentially completing around the 26.79944 level. Going forward, if the 5th wave begins to unfold, potential targets could be in the range of 29.74182 to 30.57528.

Gold Long Term Neowave ForecastHello Everyone
FX:XAUUSD In this we are going to talk about gold in detail
## As long as we are above 2771, gold will bullish till May-June. But to confirm this we will need to wait for 2 or 3 more weeks, so buy in parts.
## Inner stucture is in correction of traditional ABC structure and still in developing phase. But i have remove them so that who dont understand neowave wont be confused.
## Apart from this i am adding Live link for fast updates. so if you have any query. Kindly leave a comment. I will be happy to guide you further more.
Live Link- in.tradingview.com

Comprehensive Research - McDonald’s Stock Set to SoarQuick read:
McDonald's stock is poised for a bullish move, with Wave 3 likely starting and strong support near 290.50–295.00. Traders should long on dips within this range, for next resistance levels, 326.00 and 348.00 with a invalidation below 276.00. This setup offers a solid risk-to-reward in a long-term uptrend. Alternative safe entry is possible after the break of corrective channel breakout of wave (2).
Elliott Wave Forecast:
TF - Daily
The chart suggests that McDonald’s stock is in the middle of a larger upward move known as Wave C, which comes after completing a complex correction. Wave C is expected to unfold in five smaller waves, a pattern that usually points to a strong uptrend. It appears the correction is behind us, and a fresh bullish phase is underway.
Starting from the low at 276.53 , marked as Wave B, the price climbed to 326.32 , forming Wave one. After that, the stock pulled back to 290.50 , forming Wave two. This pullback followed a typical ABC pattern within a corrective channel, which often signals the end of a downturn and the beginning of an upward move.
Now, Wave three seems to be starting, and this is usually the strongest part of Wave C. The price is expected to move above 335 , take a small pause for Wave four, and then rise again to complete Wave five somewhere around 345 to 350 dollars. This positive outlook remains intact as long as the price stays above 290.50 . With the breakout from the corrective channel, the setup looks strong and clear for buyers.
Fibonacci levels:
Fibonacci Extension Targets:
1.000 extension: 326
1.618 extension: 348
Correction Retracement Levels:
Wave 2 retracement: 78.6%
A = C in A-B-C correction: 289.21
Price Action & shifting of value:
TF: Weekly
McDonald’s stock has been steadily climbing inside a rising channel since late 2020, showing a clear long term uptrend. The price has respected both the top and bottom edges of this channel very well, and interestingly, the middle line has acted like a pivot, providing support or resistance multiple times over the years.
Recently, the stock made a higher low at 276.53 and bounced back strongly, keeping the bullish structure intact. It then pulled back to 290.50 , right around the middle line of the channel, and held above an upward sloping trendline. This kind of price action shows strength and suggests buyers are stepping in.
The sharp move from 276.53 up to current levels looks like a strong bullish leg, possibly driven by accumulation. If the stock can break above its recent high of 326.32 , it could head toward the upper end of the channel. As long as the price stays above 290.50 and especially above 276.53 dollars, the bulls remain in control. Even if the price dips a bit, the long term trend stays positive unless the lower boundary of the channel breaks down.
I will update more Information here.

GBPCAD - Is Bullish Breakout Ahead?TF: 4h
GBPCAD is initiating along opportunity by completing 4th intermediate wave at 1.83464 . We can expect a retracement then reversal with near the lower trendline of the parallel channel.
Once price comes down, we will have the opportunity to go long with minimum stop level at low of the wave 4 at 1.83640 . The bullish scenario is capable GBPCAD to provide 1.8654 - 1.8748 targets to the buyers.
If the breakdown occurs, wave (4) will go deep. We update this chart time to time. Traders should only buy after a clear reversal.

NSE IONQ - Are we ready for a breakout?The corrective phase is complete and an impulse move appears likely. A strong buy above the A-B-C channel could target levels around 30 - 37 - 45 or higher. Good entry is possible above 26 . However, if conditions worsen, further corrections may ensue.
I will update further information soon.

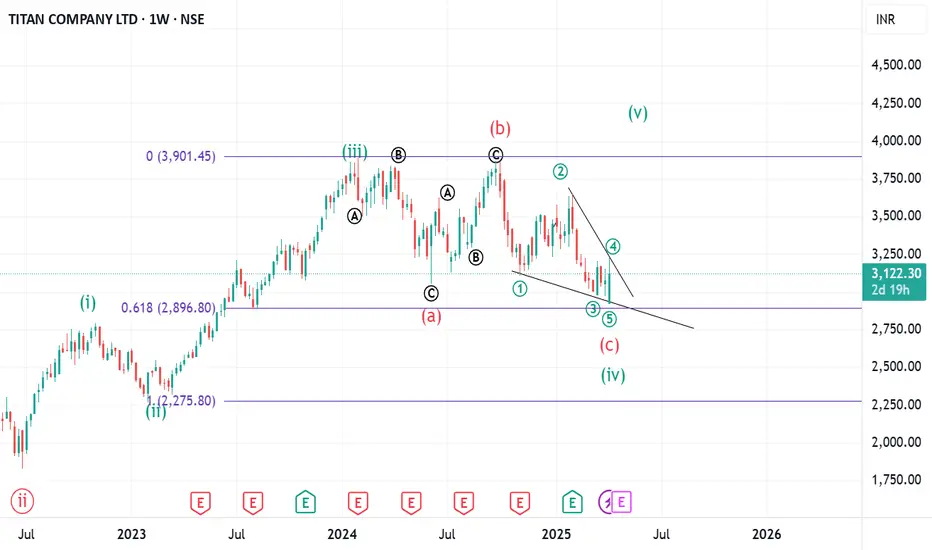
End of correction Assuming a wave 3 with 5th wave extensionThe only possible internal relationship between wave (i) and wave (iii) , when when wave (v) extends is w(iii) = 1.618 w (i) , which is the case here . If internal relationship is there then
w(v) = 1.618 w(0) - w(iii) measured from the end of w(iv) , ie internal count and this is the case here .
Next question is where this impulse is the end of a larger w(3) or end of a larger w(5) .I am assuming this is the end of a larger w(3) since w(v) overshoots trendline drawn from the end of w(i) and wave (iii) , that means the extended w(v) is the steepest .
Depth of corrective waves - When an extended 5th corrects it gives 99% retracement and ends at previous w(iv) of one lesser degree . Normally w-x-y (double correction is common) and w-x-y-x-z (triple correction is rare) . Had a wave 5 of a higher degree was been corrected the correction would have taken lesser time that it took to form w(v) . In this case time taken is more , hence the assumption that it correcting a higher degree w(3) . It means the correction is over .
End of correction in form of a complex flat for wave 4Titan has ended correction . It has made a time consuming complex flat . More it consolidates more better is accumulation and the next move may be explosive .
Complex flat a-b-c (A)--a-b-c (B)--1-2-3-4-5 (C)
Regards
RUSSIA UKRAIN FALL ACHIEVED Technical Analysis Report: Nifty 50
Prepared by: Sucrit Patil Date: April 8, 2025
Overview: This report analyzes the weekly price movements of the Nifty 50 Index from mid-2021 to early 2025, highlighting significant trends, market events, and future projections. The focus is on two critical periods: the Russia-Ukraine War (2021–2022) and the Results + Global Tariffs (2024–2025).
Key Observations:
Russia-Ukraine War (2021–2022):
Price Movement: The Nifty 50 Index experienced a sharp decline of 3,421.05 points, representing an 18.39% drop.
Volume: A total of 68,421 shares traded, indicating heightened volatility during this geopolitical conflict.
Indicators:
Moving Average (SMA): The index breached its 50-week moving average, signaling bearish sentiment.
RSI: Dropped below 30, suggesting oversold conditions.
Results + Global Tariffs (2024–2025):
Price Movement: The index declined further by 4,835.75 points, an 18.39% drop.
Volume: A surge to 96,715 shares traded, reflecting intensified market reactions to global economic policies and tariff announcements.
Indicators:
Moving Average (SMA): 200-week SMA acted as a resistance level during recovery attempts.
RSI: Currently at 39.30, indicating a shift from oversold to neutral territory.
Conclusion: The Nifty 50 Index remains at a critical juncture influenced by global events. Monitoring support/resistance levels, coupled with technical indicators, will be essential for navigating the current market landscape.
Disclaimer: This report is for educational purposes only and does not constitute investment advice or recommendations. I am not SEBI-registered. Please consult a financial advisor before making any investment decisions.

Bearish Setup on NFLX: Correction Wave (C) UnfoldingTF: 4h
NFLX appears bearish at the moment. The corrective structure on the 4-hour timeframe suggests a potential decline. The current formation indicates that wave B likely completed at 998.61, and the stock has now begun its descent into wave (C) of the correction.
The correction may extend to the 100% projection of wave A at 788.67, or potentially deepen to 659.06, aligning with the 1.618 Fibonacci extension of wave A. After the completion of wave (C), traders can buy for the target up to wave B at 998.61.
I will continue to update the situation as it evolves.

NVDA’s Final Act: A Breakout Waiting to HappenNVDA appears to be nearing the completion of its corrective phase, setting the stage for a potential move to new highs. The current pattern resembles a falling wedge, indicative of an ending diagonal formation, which often signals a reversal and the start of an upward trend.
The structure of the corrective channel, along with the termination of the diagonal pattern, suggests a high likelihood of a running flat formation. Buyers are likely to intensify demand pressure as the price approaches the lower boundary of the trendline. A trend reversal may occur if there is a decisive breakout above the Wave 4 level of the ending diagonal.
Buying opportunity with minimal stop is possible after the reversal from lower side of the channel. Targets can be 112 - 120 - 132 - 140.
I'll be sharing more details shortly.

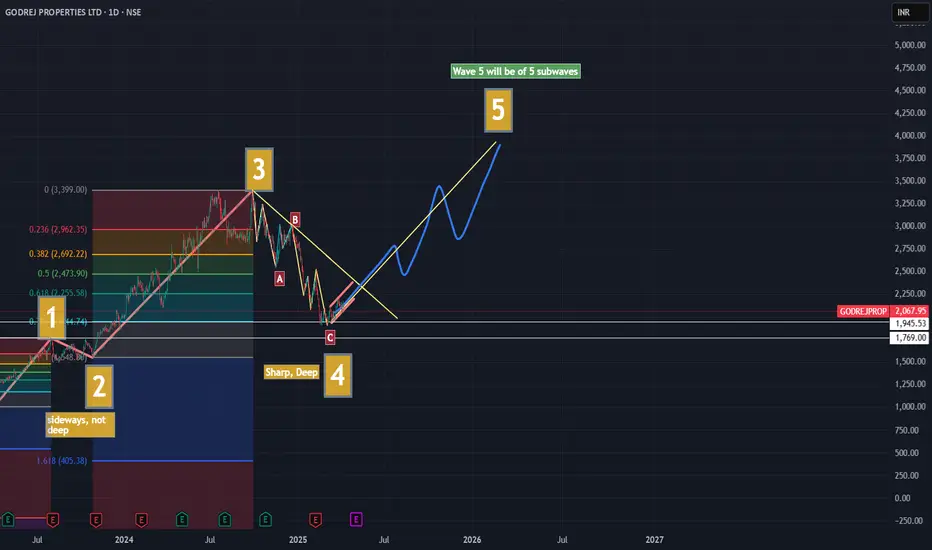
Godrej Properties is About to Start UptrendElliot Wave analysis of the stock shows following important things:
1. We are currently at the end of Wave 4 (Correction Wave)
2. Wave 2 was sideways and not deep. Thus as per the rule of alternation, the wave 4 was going to be sharp (zigzag) and deep. It has turned out to be so. It retraced as much as 78% of the Fibonacci levels.
3. Wave 4 - ABC had following waves -
- A - 3 Waves
- B - 3 Waves
- C - 5 Waves
Thus, the 3-3-5 Waves pattern has been established and verified.
What is current situation?
Currently, if analysis is correct, it is in the beginning of 5th Wave. It is ahead of Nifty 50 which is yet to start the 5th wave.
If it is not in beginning of 5th Wave, it still doesn't have much room anyway left to fall before it begins to reach into 1st Wave territory at 1769 Levels.
That is extremely unlikely event. If it happens so, then the wave count will change and entire 1st and 3rd wave will become 1st Wave.
This is my understanding. Open for the community views.
note: Personal Views only. No buy/sell recommendation.
GBP/USD Technical Outlook: Elliott Wave Mapping the Next MoveThis GBP/USD 4H chart presents an Elliott Wave analysis.
Wave (1) and (2): The market had an impulsive bullish movement in Wave 1, followed by a corrective Wave 2.
Wave (3): A strong bullish move with momentum.
Wave (4): A corrective phase, forming a triangle pattern (a-b-c-d-e), which suggests the market is preparing for another impulsive leg.
Entry Confirmation: A breakout above the triangle pattern.
First Target: 1.31457 (Fibonacci 0.382)
Second Target: 1.32105 (Fibonacci 0.5)

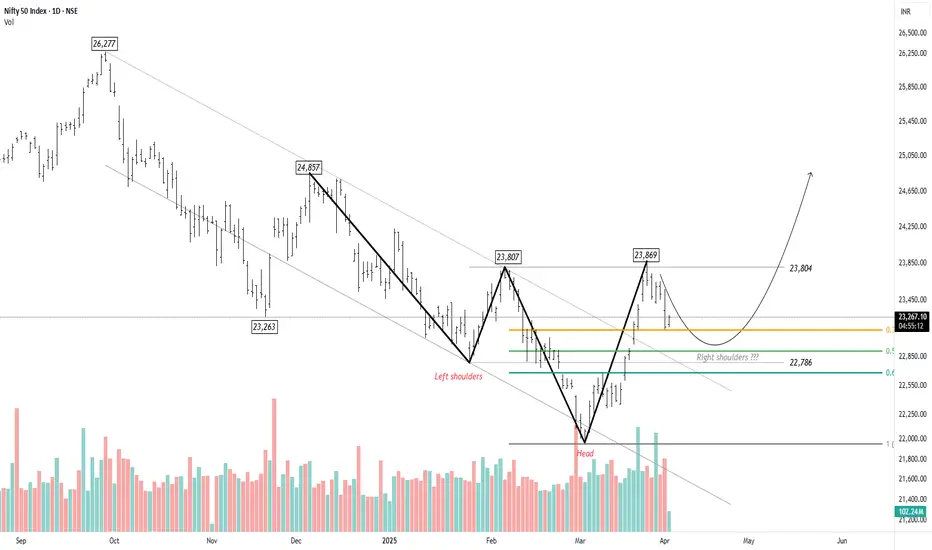
Nifty - Awaiting the Fifth Wave for a BreakoutNifty recently hit a low of 21,905 , marking a key reversal point in the trend. A well-defined Head and Shoulders pattern is emerging, with the right shoulder currently forming. The ongoing pullback has retraced to the 38.2% level, but there is potential for it to extend towards the 50% mark at 22,906 . However, the upward move appears to be losing momentum, with buying interest remaining subdued.
Based on the chart, the head of the pattern signifies the beginning of a new impulse wave. This appears to be the fourth wave within the larger first wave. Once Nifty completes this corrective phase, the fifth wave is expected to present a trading opportunity. If wave equality holds, Nifty could potentially rise to 24,857 .
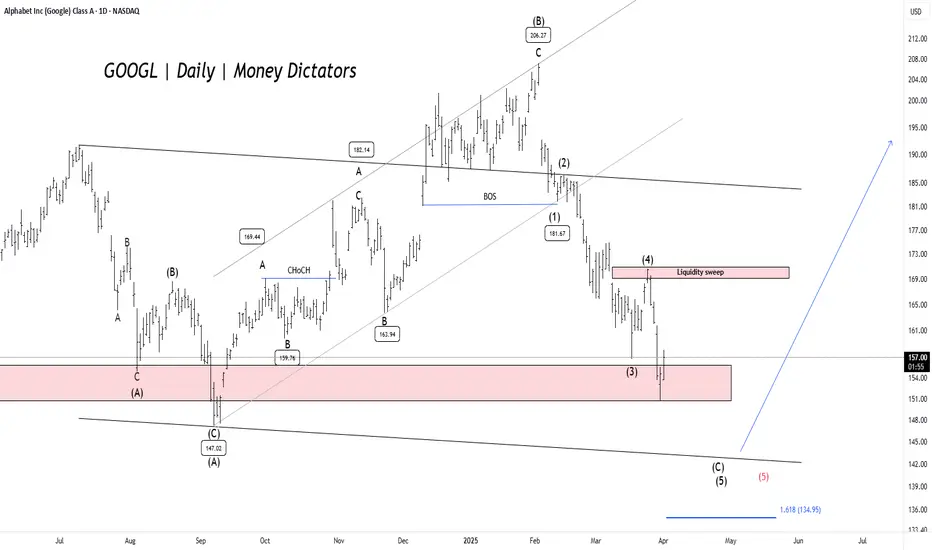
GOOGL - Elliott Wave Final ShowdownGOOGL has dropped over 27.28% , reaching a minor profit-booking zone. The $150 level serves as a key demand zone, where a potential price reversal could occur. The formation is either expanded flat or a running flat on the daily timeframe chart.
Confirmation is best observed near the lower trendline of the parallel channel. If bearish momentum persists, prices may decline further to the $142-$140 range before a strong rebound. Once the correction ends, the upside targets are $168, $180, and $195.
A new low will form if the previous low is breached. Further research will be uploaded soon.
Is Bitcoin on the Verge of a Massive Breakout?Bitcoin's wave ((4)) has successfully completed a W-X-Y corrective formation. If Bitcoin manages to decisively break above the key resistance level of 88,826, it could trigger a powerful impulsive rally, potentially driving prices toward the next major targets at 95,250 - 99,508 - 109,176.
Additionally, the parallel channel's lower trendline is offering substantial support, preventing further downside movement. A strong breakout above this channel could significantly enhance bullish momentum, increasing the probability of Bitcoin reaching new all-time highs. We will update you soon!

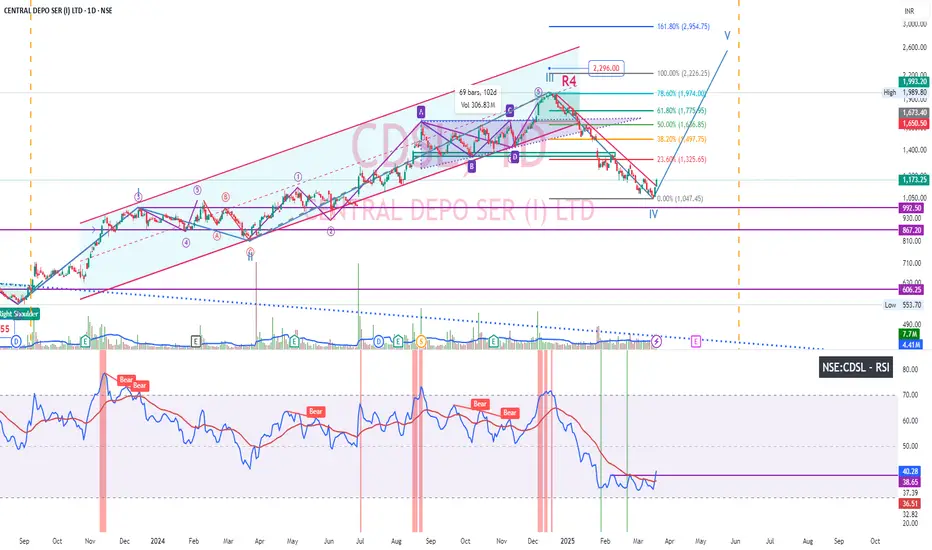
CDSL Price & RSI Breakout - D timeframeCDSL after reaching ascending triangle target exited parallel channel and corrected 37% and now taking up bullish reversal. Could see breakout in price chart of Daily timeframe. Also RSI breaking out after base formation. Weekly chart Bullish engulfing candlestick pattern.
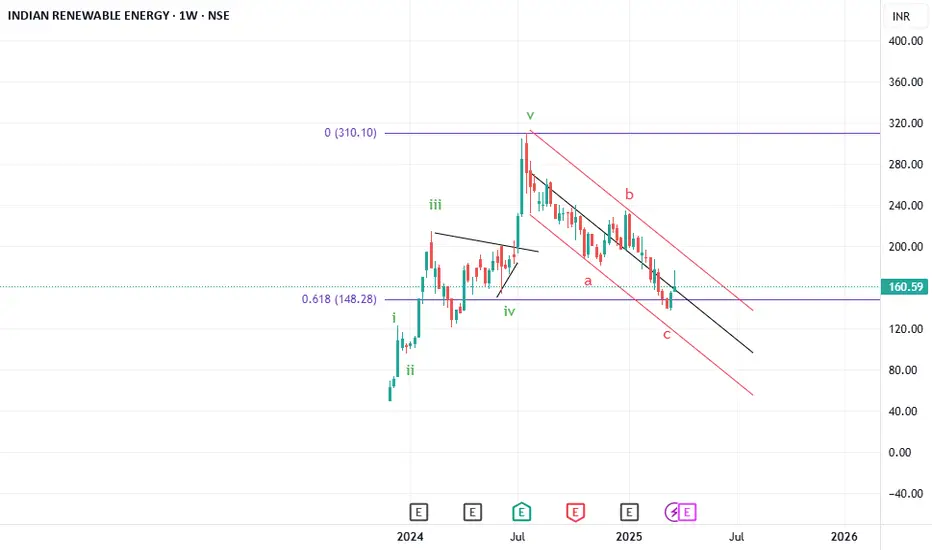
IREDA - End of CorrectionAfter completing a 5 wave impulse . The correction
1. Has retraced 61.8% of the impulse
2. Has reached the lowest of wave 4 (ie wave A of the triangle)
Thus correction is over . Its an aggressive buy.
Is gold going to be eclipsed?
-------------------------
Timeframe: 240 Min
-------------------------
The price action suggests a completed impulse structure originating from the 2833 low, with gold now trading at an all-time high. Based on cluster zones and Fibonacci extensions, wave (5) still has the potential to extend toward the 3150-3200 range. This zone represents a key resistance level where buying momentum may slow down, signaling an impending shift in market dynamics.
Once wave (5) completes, it will mark the end of wave ((3)) of a higher degree, setting the stage for a corrective move. A retracement toward the previous wave (4) level is expected as wave ((4)) develops, aligning with historical corrective behavior after extended rallies. This phase will provide crucial insights into the market’s next major move. Stay tuned for further updates.
