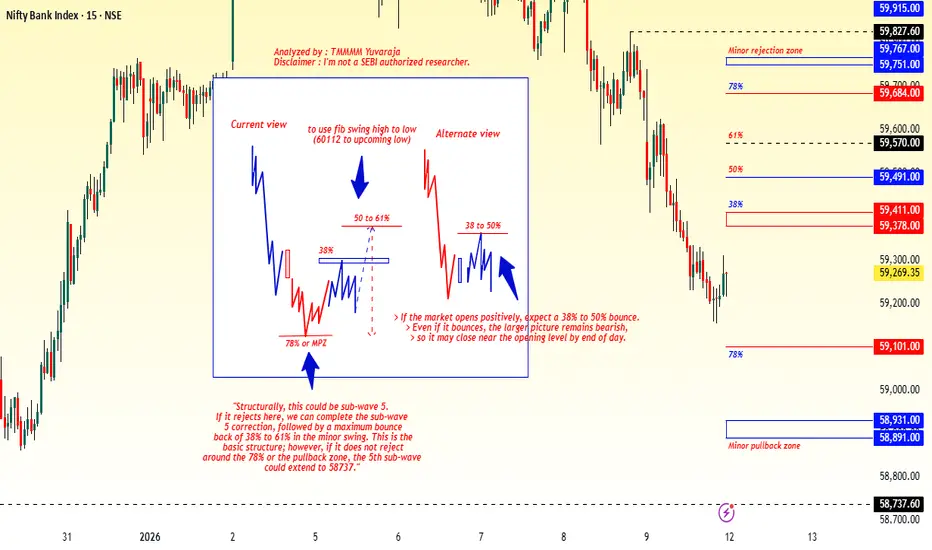
#Banknifty Directions and Levels for Jan 12thCurrent View
> If the market declines initially, the immediate support zone is expected to act as a strong support.
> If price gets rejected from this zone, structurally this could be a 5th sub-wave. In that case, the 5th sub-wave correction may complete here, followed by a bounce of around 38%–61% of the minor swing.
> This is the base structure. However, if price does not reject around the pullback zone, the 5th sub-wave could extend toward 58,737.
Alternate View
> The alternate scenario suggests a range-bound market with a bearish bias.
> If the market opens positive, we can expect a bounce of around 23%–38%. However, even if a bounce occurs, the broader outlook remains bearish, and the market may return to its opening level by the end of the day.
Elliott Wave
Short term Analysis of HDFC BankWrap up:-
HDFC Bank is making a wxy pattern in wave c and has completed its wave w at 1018 and wave x is completed at 933. Thereafter, HDFC Bank will head towards wave y.
What I’m Watching for 🔍
Buy HDFC Bank @933 sl 927 for a target of 1027-1078.
Disclaimer: Sharing my personal view — only for educational purpose not financial advice.
"Don't predict the market. Decode them."

Major Crash Ahead?The Diametric Pattern completed.
2-stage confirmation achieved.
The Major impulsive downtrend has begun - Unless there is a sharp reversal upside by next week.

Updated Nifty Analysis for Jan 09, 2026Wrap up:-
As updated earlier, wave 1 was completed at 26057 but wave 2 counts have now been changed due to a sudden fall and is expected to be completed in the range of 25800-25850. Thereafter, nifty will head towards wave 3.
What I’m Watching for Jan 09, 2026 🔍
Buy Nifty only above @25971 sl 25858 (15 min. candle closing basis) for a target of 26447-26630.
Short Nifty in the range @25935-25921 sl 25971 (15 min. candle closing basis) for a target of 25818.
Disclaimer: Sharing my personal market view — only for educational purpose not financial advice.
"Don't predict the market. Decode them."

Tube Investments of India Ltd — Wave X Triangle in PlayAfter the sharp decline from ₹4,810, the recent advance initially looked like a potential leading diagonal of a new impulse. However, the internal overlaps and choppy rhythm point instead to a Wave X triangle, likely part of a larger corrective sequence (W–X–Y).
As long as price holds below ₹3,419.90, the bearish outlook remains intact, with the next leg — Wave Y — possibly aiming toward the 0.5–0.618 retracement zone (₹2,511–₹1,968). That region, close to the golden ratio, may act as a potential termination zone for the entire correction.
Disclaimer: This analysis is for educational purposes only and does not constitute investment advice. Please do your own research (DYOR) before making any trading decisions.

Nifty Analysis for Jan 09, 2026Wrap up:-
As updated earlier, wave 1 was completed at 26057 but wave 2 counts have now been changed due to a sudden fall and is expected to be completed at 25858 if nifty breaks and sustains above 25971. Thereafter, nifty will head towards wave 3.
What I’m Watching for Jan 09, 2026 🔍
Buy Nifty above @25971 sl 25858 (15 min. candle closing basis) for a target of 26447-26630.
Disclaimer: Sharing my personal market view — only for educational purpose not financial advice.
"Don't predict the market. Decode them."

Nifty Analysis for Jan 08, 2026Wrap up:-
As updated earlier, wave c is an impulse wave. But, now the counts have been changed with wave 1 at 26057, wave 2 at 26067 and now, nifty heading towards wave 3.
Buy Nifty @26140 sl 26008 (15 min. candle closing basis) for a target of 26432.
Disclaimer: Sharing my personal market view — only for educational purpose not financial advice.
"Don't predict the market. Decode them."

Corrective RiseCoal India seems to have completed Wave D of a triangle/diametric and now entering Wave E
The minimum target is around 450-455 on a daily level.
Profit booking could be done on other mentioned intermediate levels according to your trading style

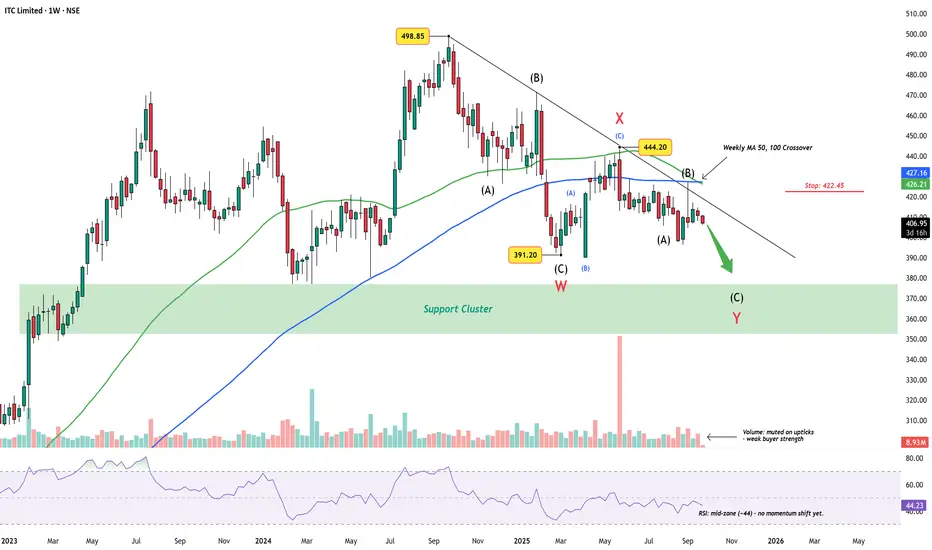
ITC Limited Weekly Chart – Wave Y Targets Support ClusterITC has been trending lower since the ₹498.85 peak, carving out what appears to be a complex W-X-Y correction. The first leg (W) found support near ₹391.20, followed by a corrective bounce into X at ₹444.20. The decline since then has kept price under a descending trendline, respecting the larger corrective rhythm.
Wave Count
Wave W: Completed into the ₹391.20 low.
Wave X: Counter-trend rally capped at 444.20.
Wave Y: Now unfolding, with sub-wave (C) still incomplete.
The broader structure hints that ITC may continue toward the support cluster (₹350–375) before this correction runs its course.
Indicators
Volume : Muted on upticks – rallies lack buying strength.
RSI (~44) : Mid-zone, leaving space for further downside before oversold conditions.
Weekly 50/100 MA crossover : Adds weight to the ongoing corrective bias.
Invalidation
A decisive break above ₹422.45 and sustained strength beyond 427 would question this bearish view, hinting at a possible shift back to bullish sequences.
Summary
Unless ITC reclaims higher ground above 422.45, the bias stays toward a Wave Y completion in the support cluster zone.
Disclaimer: This analysis is for educational purposes only and does not constitute investment advice. Please do your own research (DYOR) before making any trading decisions.
Nifty Analysis for Jan 07, 2026Wrap up:-
As updated earlier, wave c is an impulse wave with wave 1 at 26057, wave 2 at 25878, wave 3 at 26373 and wave 4 is expected to be completed in the range of 26212-26113. Thereafter, heading towards wave 5.
Now, wave 4 is completed at 26124 and heading towards final wave 5.
Buy Nifty @26124 sl 26113 (75 min. candle closing basis) for a target of 26544-26804.
Disclaimer: Sharing my personal market view — only for educational purpose not financial advice.
"Don't predict the market. Decode them."

End of ABC correction - Only for long term investorsThe correction in Solar Industries is complete
1) A(impulse) - B (triangle) - C (Impulse)
2) Wave C is exactly 0.618% of wave A extended from the end of wave B.
3) The entire correction has lasted for 26 weeks , which is an Ichimoku Time (Actual time is 27, but +1/1 is permissible)
4) Wave C rests exactly at the middle line for the ABC channel.
5) Wave C ends exactly at 0,618 of the impulse it is correcting
Buy a pullback for a target of 14765 and a SL of 11616.

Nifty Analysis for Jan 06, 2026Wrap up:-
As updated earlier, Nifty has fallen before achieving 26421 so it is not a Ending diagonal formation in wave c. It is an impulse wave with wave 1 at 26057, wave 2 at 25878, wave 3 at 26373 and wave 4 is expected to be completed in the range of 26212-26113. Thereafter, heading towards wave 5.
Buy Nifty @26212-26113 sl 26113 (75 min./1 hr candle closing basis) for a target of 26630-26890.
Disclaimer: Sharing my personal market view — only for educational purpose not financial advice.
"Don't predict the market. Decode them."

Copper : expecting another 5th wave on the upsideKey level : 5.5600
we are still on B wave of higher degree which will take prices to higher zone
if prices goes below key level, then we will switch to bearish scenario

Updated Positional View for Nifty from January to March, 2026Wrap up:-
After breaking ATH of 26277 dated 27.09.2024, Major wave X has been shifted further and pattern counts has been changed at major level. Now, wave w of major wave x has been completed at 26277 and wave x is in progress.
In wave x, a is completed at 23263 and b is expected to be completed in the range of 26630-26890. Thereafter, Nifty will head towards wave c for a min. target of 23635.
Now, we have to check internal pattern of Nifty which is currently in progress i.e. wave 5 from 24337. In this pattern, Nifty is forming a wxy pattern. Wave w has been completed at 25448 and wave x at 25318 and wave y is expected to be completed in the range of 26630-26890.
In wave y, wave a is completed at 26010 and b is completed at 25693 and heading towards wave c through impulse wave.
In wave c of y of 5, wave 1 was completed at 26057, wave 2 at 25878, wave 3 at 26373 and wave 4 is expected to be completed in the range of 26212-26113. Thereafter, wave 5 is expected to be completed in the range of 26630-26890.
What I’m Watching for 🔍
Short Nifty in the range of 26630-26890 sl 26890 (daily closing basis) for a target of 25220-25031-24772-23635-23200.
Disclaimer: Sharing my personal market view — only for educational purpose not financial advice.
"Don't predict the market. Decode them."

Nifty Analysis for Jan 05, 2026Wrap up:-
Nifty forming a Ending Diagonal pattern in wave c.
In wave c of y of 5, wave 1 is completed at 26057, wave 2 at 25726, wave 3 at 26236, wave 4 at 25878 and now, nifty is in final wave 5 of wave c.
In wave 5 of c of y of 5, nifty forming abc pattern. In wave c, nifty is in 5th wave.
Short Nifty @26421 sl 26450 (daily closing basis) for a target of 26300-26135.
Disclaimer: Sharing my personal market view — only for educational purpose not financial advice.

XAUUSD (D1) – Elliott ABC pattern activeLana sells the pullback, waits to buy at major liquidity 💛
Quick summary
Timeframe: Daily (D1)
Elliott view: Price is likely developing an ABC corrective structure after a strong rally
Strategy: Sell the B-wave pullback into supply, buy only when price returns to strong liquidity
Context: Precious metals started 2026 strong, but short-term volatility and re-accumulation swings are still expected
Fundamental backdrop (supports the bigger trend)
Gold and silver opened 2026 with strong momentum, extending the best run since the late 1970s. Goldman Sachs remains bullish on precious metals and continues to highlight an aggressive long-term target (around $4,900 for gold).
Lana’s key point: the long-term bull cycle can remain intact, but the market still needs healthy corrections to reset liquidity and build new structure.
Technical view (D1) – Elliott ABC structure
On the Daily chart, after the powerful top, gold dropped sharply, forming a clean Wave A. The current structure suggests:
Wave B: a corrective rebound into resistance/supply
Wave C: a potential move back down into liquidity zones before the next major direction is confirmed
This ABC lens helps avoid getting trapped when the news looks bullish, but price is still in a corrective phase.
Key levels from the chart
1) Sell zone (B-wave supply)
Sell: 4435 – 4440
This zone aligns with marked resistance and a Fibonacci pullback cluster (0.236 / 0.382). If price retraces here and shows rejection, it’s a strong area to look for B-wave selling pressure.
2) Buy zone (major liquidity – potential C-wave completion)
Buy Liquidity: 4196 – 4200
This is the strongest liquidity area on the chart. If Wave C plays out, Lana will look for buying opportunities here with clearer risk control.
3) Deeper accumulation liquidity
Accumulate liquidity: the lower accumulation area highlighted on the chart
If the market sweeps deeper than expected, this is the region where longer-term buyers may step in.
Trading plan (Lana’s approach)
Primary idea: Sell rallies into 4435–4440 if price shows weakness (B-wave rejection).
Primary buy plan: Wait for price to revisit 4196–4200 and confirm support (liquidity absorption).
If price breaks and holds above the sell zone, Lana stops selling and waits for a new structure to form.
Note on early-year behavior
The first weeks of the year often bring “messy” moves as liquidity returns and positioning resets. Lana will only trade at planned zones and avoid entries in the middle of the range.
This is Lana’s personal market view and not financial advice.

Updated Positional View for Nifty from January to March, 2026Wrap up:-
After breaking ATH of 26277 dated 27.09.2024, Major wave X has been shifted further and pattern counts has been changed at major level. Now, wave w of major wave x has been completed at 26277 and wave x is in progress.
In wave x, a is completed at 23263 and b is expected to be completed at 26420 and thereafter nifty breaks and sustains below 24633 (which is 38.2% of 21743 to 26420). Thereafter, Nifty will head towards wave c for a min. target of 23406.
But, the range is very large in between 26420 and 24633. So, we have to check internal pattern of Nifty which is currently in progress i.e. wave 5 from 24337. In this pattern, Nifty is forming a wxy pattern. Wave w has been completed at 25448 and wave x at 25318 and wave y is expected to be completed at 26420.
In wave y, wave a is completed at 26010 and b is completed at 25693 and heading towards wave c, Nifty forming a Ending Diagonal pattern in wave c.
In wave c of y of 5, wave 1 is completed at 26057, wave 2 at 25726, wave 3 at 26236, wave 4 at 25878 and now, nifty is in final wave 5 of wave c.
Short Nifty @26420 sl 26600 (daily closing basis) for a target of 25133-24962-24633-23530-23146.
Disclaimer: Sharing my personal market view — only for educational purpose not financial advice.

Positional View for Nifty from January to March, 2026Wrap up:-
After breaking ATH of 26277 dated 27.09.2024, Major wave X has been shifted further and pattern counts has been changed at major level. Now, wave w of major wave x has been completed at 26277 and wave x is in progress.
In wave x, a is completed at 23263 and b is treated as completed at 26325 once nifty breaks and sustains below 24581 (which is 38.2% of 21743 to 26325). Thereafter, Nifty will head towards wave c for a min. target of 23311.
But, the range is very large in between 26325 and 24581. So, we have to check internal pattern of Nifty which is currently in progress i.e. wave 5 from 24337 to 26325. In this pattern, Nifty is forming a wxy pattern. Wave w has been completed at 25448 and wave x at 25318 and wave y at 26325.
Nifty already break 38.02% of 25318 to 26325 i.e. 25941 also sustains below that. Therefore, we assume once that wave 5 or wave y or wave b of wave x is completed at 26325 and Nifty is heading towards wave C.
In wave c, wave 1 is completed at 26066, Nifty again forming a wxy pattern in wave 2. Wave 2 is treated as completed once nifty breaks and sustains below 26041. Thereafter, Nifty will head towards wave 3 of wave c of wave x.
Short Nifty below 26041 sl 26325 (daily closing basis) for a target of 25097-24934-24575-23494-23311-23118.
Disclaimer: Sharing my personal market view — only for educational purpose not financial advice.

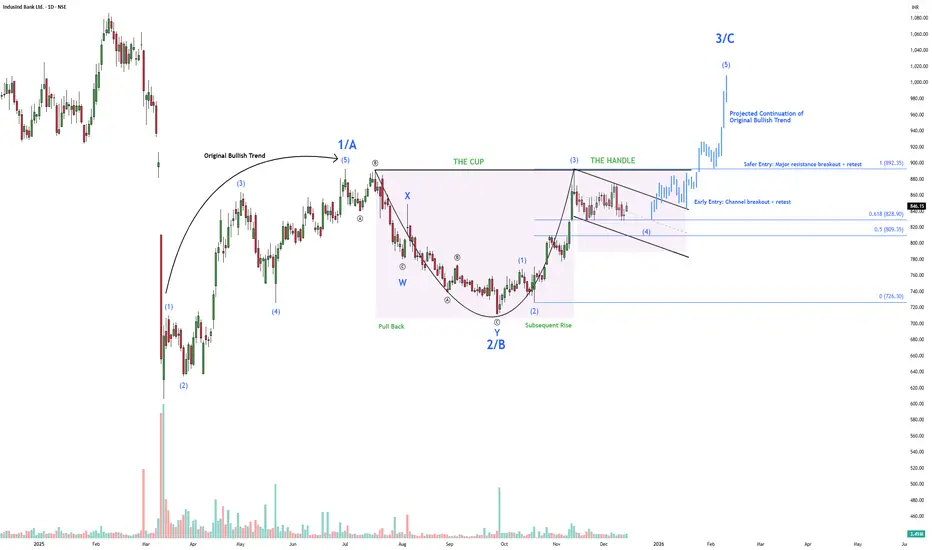
IndusInd Bank: Cup Formed, Handle ConsolidatingIndusInd Bank is forming a classic Cup & Handle continuation pattern , which aligns cleanly with a major-degree Elliott Wave structure , strengthening the bullish case.
The prior advance established the primary bullish trend (Wave 1 / A) . The subsequent decline unfolded as a complex Wave 2 / B correction , expressed visually as the cup — a rounded, time-consuming base formed through a W–X–Y corrective structure . This phase allowed price to correct without breaking the broader trend, signalling accumulation rather than distribution.
The recovery from the base completed the cup and transitioned into the handle , which is developing as a shallow consolidation above key Fibonacci supports . From an Elliott Wave perspective, this handle reflects a pause before expansion , not a reversal, keeping the larger bullish structure intact.
With the handle holding above the 0.618–0.50 Fibonacci retracement zone (₹828.90–₹809.35) , the setup favors a major-degree Wave 3 / C advance , typically the strongest and most impulsive phase of a trend.
Structure & Bias
Pattern : Cup & Handle (Continuation)
Elliott Wave alignment:
Wave 1 / A: Prior impulsive advance
Wave 2 / B: Complex correction forming the cup (W–X–Y)
Wave 3 / C: Expected expansion leg post-breakout
Bias : Bullish continuation
Entry Strategy
Early Entry (Aggressive):
Channel breakout within the handle, followed by a successful retest — offers early exposure with higher volatility risk.
Safer Entry (Conservative):
Breakout above the major resistance near ₹892, followed by a retest — confirmation-based entry aligned with Wave 3 / C acceleration.
Invalidation
Sustained trade below ₹809 invalidates the Cup & Handle thesis and weakens the Wave 3 / C outlook.
Bottom line:
This is a Cup & Handle powered by Elliott Wave structure . As long as price holds above key Fibonacci support, the path of least resistance remains higher.
Disclaimer:
This analysis is for educational purposes only and does not constitute investment advice. Please do your own research (DYOR) before making any trading decisions.
Nifty Analysis for Jan 01 to 06 Jan, 2026Wrap-up:
Nifty breaks 25941. Therefore, our long term/positional targets are open and heading towards it step by step it. Nifty has completed wave 1 of major wave C at 25945 and wave 2 at 26236. Now, Nifty heading towards wave 3.
In wave 3, internal wave 1 has completed at 25878 and wave 2 at 26195. Now, heading towards internal wave 3.
What I’m Watching for Jan 01 to 06 Jan, 2026 🔍
Short nifty at 26195 sl 26236 for a target of 25097-24934.
Disclaimer: Sharing my personal market view — only for educational purpose not financial advice.

Nifty Analysis for Dec 31, 2025Wrap-up:
Nifty breaks 25941. Therefore, our long term/positional targets are open and heading towards it step by step it. Nifty has completed wave 1 of major wave C at 25945 and heading towards wave 2.
In wave 2, Nifty is making a wxy pattern of which w is completed at 26098 and heading towards x.
In wave x of wave 2, Nifty again making a wxy pattern of which w is completed at 25693, x at 26236 and y is in progress.
In wave y of x of 2, Nifty has completed wave a at 26008, b at 25976 and heading towards wave c.
What I’m Watching for Dec 31, 2025 🔍
Short nifty below 25878 sl 26106 for a target of 25100.
Disclaimer: Sharing my personal market view — only for educational purpose not financial advice.

12 MONTHS HIGH_HINDALCO INDUSTRIES_LONGTERM TRADEHi traders,
Posting the interesting Topic on HINDALCO INDUSTRIES with Technical Analysis long-term view.
Currently HINDALCO INDUSTRIES is trading at INR 884.15 with longer term bullish basis along with strong Commodity demand at global level.
Entry at current level with stoploss of 12 Months low. Ride the trend until it closes previous yearly low price or Market Structure.
Note:_ Only for Educational purpose Since investments in Securities and market are subjected to market risk.

EURCAD Elliot Wave_LongI’m anticipating an upside move in EURCAD around the 1.62200 level. It’s a low-risk, high-reward setup. Please do your own research before making any trading decisions.
