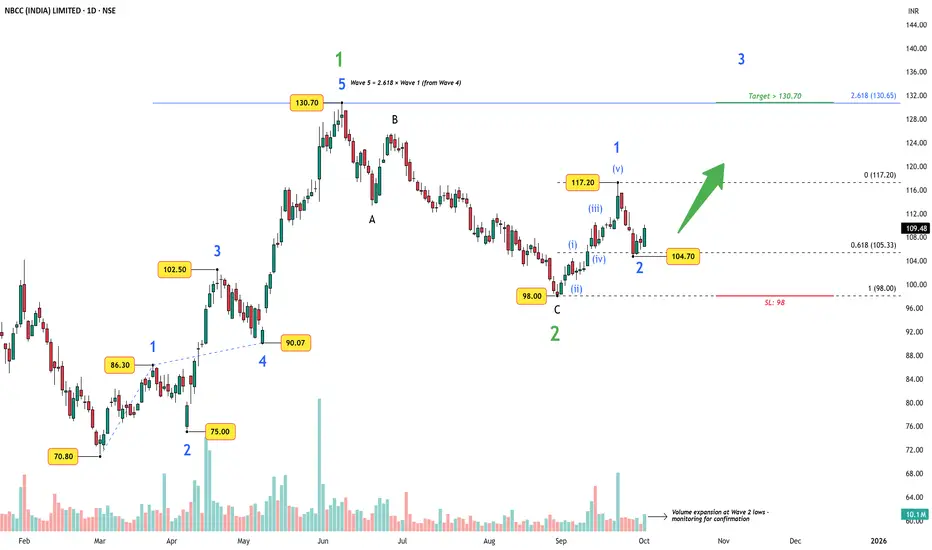
NBCC (India) – Wave 3 Setup Backed by Strong Project PipelineAfter completing a textbook 5-wave advance into 130.70 , where Wave 5 aligned exactly with the 2.618 extension of Wave 1 projected from Wave 4, NBCC corrected into 98. That low now marks a clean green Wave 2.
The recent bounce to 117.20 formed Wave 1 of a higher-degree Wave 3.
Price has retraced into the 104–105 zone (0.618 Fib) with visible volume expansion, suggesting accumulation.
Invalidation/SL sits at 98 , making risk well-defined.
Breakout above 117.20 opens the path toward 130.70+ and potentially much higher, in line with the 2.618 Fib target around 130.65.
Fundamentals in Brief
Market cap: ₹295.9B
P/E ratio: ~50.8, indicating premium valuation but supported by steady order book growth.
Revenue (FY24): ~₹115.9B, with Project Management Consultancy (PMC) as the major contributor.
Debt: Effectively zero – NBCC runs a net cash balance sheet, giving it flexibility.
Dividend yield (TTM): ~0.8% – small, but consistent payouts.
Margins: Net margin steady around 5–6%.
NBCC’s fundamentals support its technical setup: low leverage, steady revenues, and government backing in project management give confidence that the bullish Elliott Wave count has room to play out.
Disclaimer: This analysis is for educational purposes only and does not constitute investment advice. Please do your own research (DYOR) before making any trading decisions.
Elliott Wave
Nifty 50 – Wave 2 Correction and the Confluence ZoneDisclaimer: This analysis is for educational purposes only and does not constitute investment advice. Please do your own research (DYOR) before making any trading decisions.
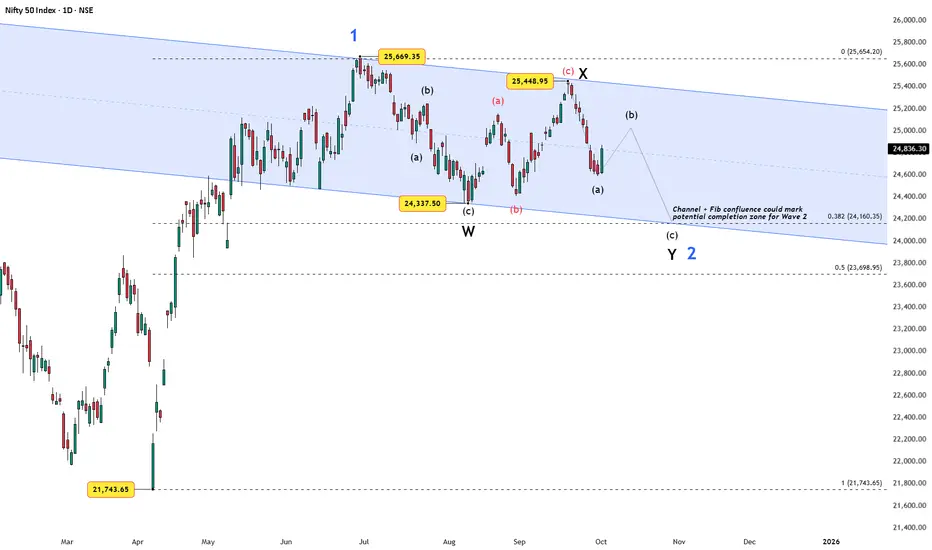
After bottoming at 21,743.65 in March 2025, Nifty launched a strong impulsive rally that topped at 25,669.35, marking Wave 1 of a new higher-degree advance.
Since then, price has been moving inside a downward-sloping channel , forming what appears to be a Wave 2 correction.
The subdivisions so far suggest a W–X–Y structure :
Wave W ended at 24,337.50.
Wave X topped at 25,448.95.
Wave Y is now unfolding, with (a) in place, (b) potentially in progress, and (c) likely still pending.
To assess possible completion zones, Fibonacci retracements of Wave 1 offer key checkpoints:
0.382 retracement at ~24,160, aligning with the channel base.
0.5 retracement at ~23,699, a deeper but still acceptable Wave 2 target.
This channel + fib confluence provides a meaningful area where Wave 2 could terminate, setting the stage for the next bullish leg — Wave 3.
Key Levels:
Resistance : 25,450 – 25,670 (breakout here invalidates the immediate Wave 2 scenario).
Support : 24,160 (0.382 fib and channel base).
Deeper support : 23,700 (0.5 fib).
Alternate scenario: If price continues sideways without decisive weakness, the correction may evolve into a triangle for Wave 2 instead of a W–X–Y.
Takeaway: As long as price respects the channel and fib zones, Wave 2 remains corrective in nature. A sustained break higher would open the path for Wave 3 — the next impulsive advance.
Gold |Power of Neowave AnalysisIf you have any doubts related to your stocks and portfolio, ask in the comments we will provide you Neowave Chart for that.
To understand my view Kindly watch the videos-
Video Analysis 01/10/2025
Video Analysis 30/09/2025
Video Analysis 29/09/2025
Neowave Forecast| Gold|Bitcoin|Nifty|Bank Nifty|30/09/2025If you have any doubts related to your stocks and portfolio, ask in the comments we will provide you Neowave Chart for that.
Discussed Instruments
#Gold
#Bitcoin
#Nifty
#Bank Nifty
Yesterday Video-

TCS – Bearish Outlook Intact, But a Wave B Bounce in Play?Chart Structure (Weekly)
TCS has been locked in a corrective decline since the 4592.25 peak. The latest fall into the historical support cluster (near 3056–2890) completed a five-wave structure within wave A. From here, a bounce toward wave B is possible, with resistance around 3350–3600.
Bullish trigger: RSI shows a bullish divergence (price made a lower low, RSI made a higher low).
Upside potential: A move towards the 3350 resistance zone.
Downside risk: If support fails, the next major level sits near 2292 — aligning with a larger wave C.
So the long-term outlook remains bearish, but a short-term bounce looks probable.
Fundamental Headwind
Adding to the technical picture, the looming H1-B visa fee hike is a structural negative for Indian IT companies. TCS, Infosys, and peers with heavy US revenue exposure could see margin pressure in the quarters ahead. This reinforces the larger bearish bias, making any bounce counter-trend in nature.
Illustrative Option Play – Bull Call Spread
For those looking to play the short-term bounce while limiting risk, one way is to structure a bull call spread:
Buy 3000 CE (Oct Expiry) at ₹42.1
Sell 3040 CE (Oct Expiry) at ₹31.25
Lot size: 175
Net Cost: ₹1,899
Max Profit: ₹5,101 (~26%)
Max Loss: ₹1,899 (~10%)
Breakeven: 3011(4%)
Reward/Risk: 2.7
(Note: Prices are as of EoB 29th September 2025. This is only an example to demonstrate risk-managed structures. Not a trade recommendation.)
Summary
Long-term: Bearish, with risk of a wave C drop toward 2292.
Short-term: Bounce into wave B likely, targeting 3350–3600.
Strategy: A bull call spread provides a clean, limited-risk way to play this bounce, while respecting the larger bearish setup.
Disclaimer: This analysis is for educational purposes only and does not constitute investment advice. Please do your own research (DYOR) before making any trading decisions.

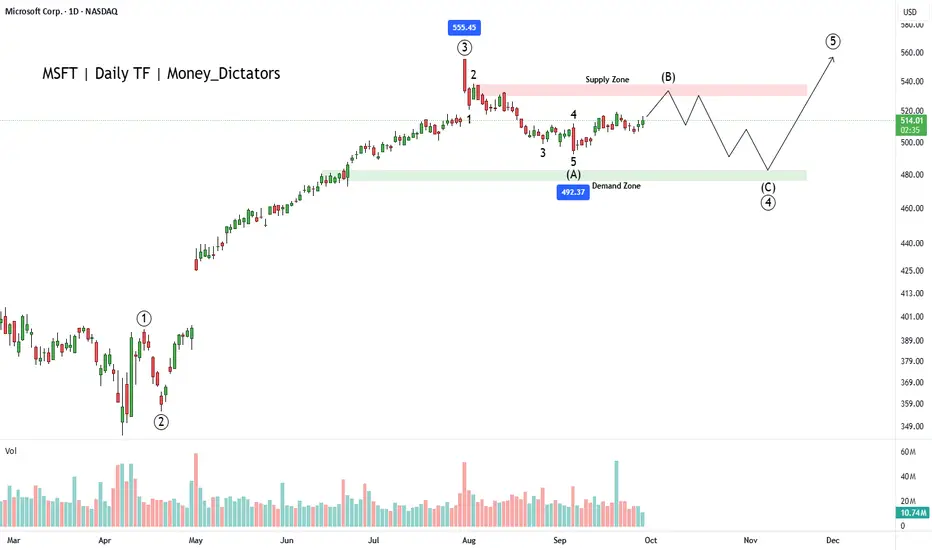
Why MSFT Could Be a Smart Pick in 2025?MSFT has bullish signals from the multiple moving averages, RSI and volume analysis. However, wave principle asks evidence from the buyers. The wave count suggests that the corrective wave (B) is ongoing, and bears will control the final wave of the primary wave 3.
Wave C will start falling nearby the supply zone and high of the 2nd wave of wave intermediate wave A. Wave C can fall up to 476 which will be the strength for wave primary wave 5. As per the chart, breakout above 540 will be a good signal for bulls to take charge back.
Zones:
Supply zone: 538 - 528
Demand zone: 482 - 476
I will update the chart and details shortly.
Nifty is ready for 26000We are expecting Nifty to reverse from the important demand zone of 25050.
After the reversal, we can expect Nifty to reach above 26000. RSI is also indicating the reversal signal on the 30-minute timeframe.

Info Edge India – Wedge in Wave X, Bearish Continuation in PlayAfter topping near 1825.80 , price has been locked in a W–X–Y double zigzag :
Wave W ended at 1157.00 with an ending diagonal.
The bounce into 1550.00 formed a wedge-like structure , completing Wave X .
From there, Wave Y kicked off with a leading diagonal in Wave A down to 1287.10 .
The recovery into 1437.80 looks like a completed Wave B , capped by trendline resistance.
As long as price stays below 1437.80 , the bias is bearish with downside potential into:
Target 1 : 1174.90 (equality with Wave A)
Target 2 : 1012.45 (1.618 extension of Wave A)
RSI remains capped under 50 with its own trendline resistance, supporting continuation of bearish momentum rather than reversal.
Invalidation: Above 1437.80
Disclaimer: This analysis is for educational purposes only and does not constitute investment advice. Please do your own research (DYOR) before making any trading decisions.

BITCOIN Neowave ForecastNamaskaram
Watch the video to understand my view...
following instruments Discussed in the video...
#XAUUSD
#BTCUSD
#NIFTY 50
#BANK NIFTY
FX:XAUUSD OANDA:XAUUSD COINBASE:BTCUSD

Gold | Bitcoin | Nifty | Bank Nifty | Neowave AnalysisNamaskaram Everyone
We have discussed following instruments in this video, if you have any query you can ask in the comments.
#Gold
#Bitcoin
#Nifty
#Bank Nifty
COINBASE:BTCUSD FX:XAUUSD OANDA:XAUUSD NSE:BANKNIFTY NSE:NIFTY

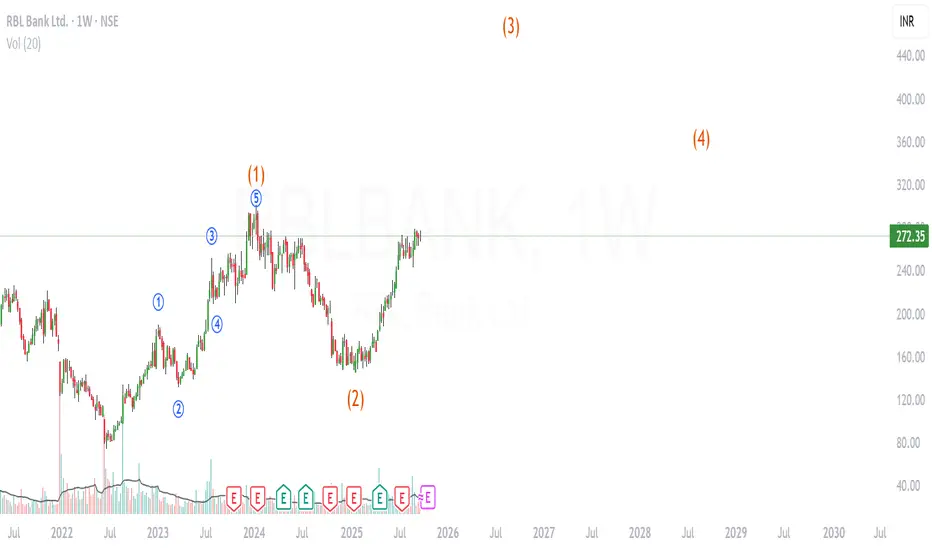
RBL Bank - Looks like Wave 3 CandidateOne can start accumulating RBL for a period of 1 year or so
Might head towards 400 levels
SL 220 WCB
Disc: DYOR
SBI BANK |Neowave AnalysisNamaskaram Everyone
I trade using Neowave and on that I have created an trading setup, which is kind of automatic entry and exit with Neowave.
Neowave is kind of a method in which you synchronize all the price action across all the time frames. It hides all the noise and tells you market is bullish or bearish.
About Stock
This is not a trading idea, it would have been if updated few weeks back. Just a neowave counts update for some one who is already holding the stock.
Stock already started its rally in correction, if you get some retracement than buy it.
For coding style read the below post
If you have the stock than hold it and trail it as the counts proceed in future.
Like and share is appreciated.
Thank You
To understand how our coding works read the below post-
NSE:SBIN

IndusInd Bank BearishNamaskaram Everyone
I trade using Neowave and on that I have created an trading setup, which is kind of automatic entry and exit with Neowave.
Neowave is kind of a method in which you synchronize all the price action across all the time frames. It hides all the noise and tells you market is bullish or bearish.
About Stock
This is not a trading Idea, just a structural update for someone who is thinking to invest.
Creating Nifty 50 Neowave Charts Library for all of you, Like and share is appreciated if you like our work.
Thank You
To understand how our coding works read the below post-
NSE:INDUSINDBK

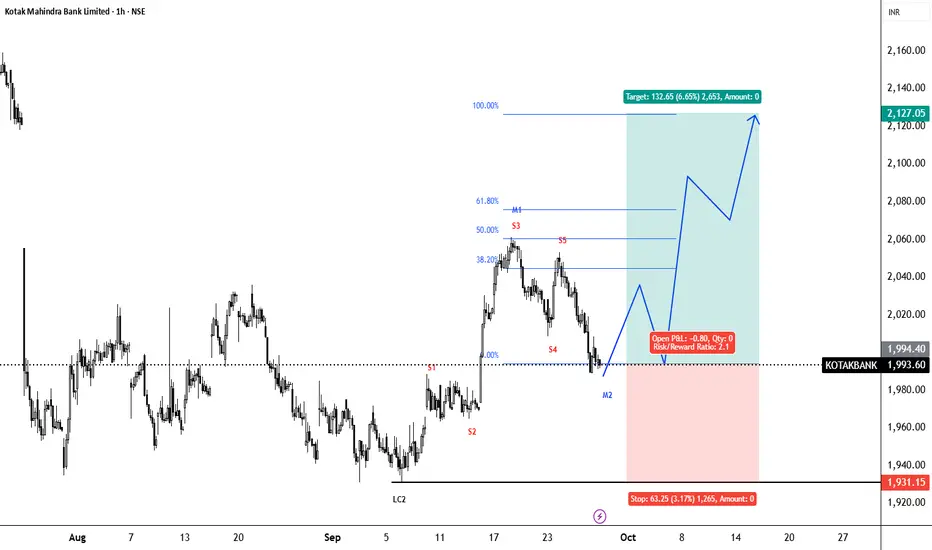
Kotak Mahindra Bank Neowave Trading IdeaNamaskaram Everyone
I trade using Neowave and on that I have created an trading setup, which is kind of automatic entry and exit with Neowave.
Neowave is kind of a method in which you synchronize all the price action across all the time frames. It hides all the noise and tells you market is bullish or bearish.
About Stock Structure
Entry Type- Medium Term Forecast mean Entry will take 4 to 8 weeks and some times more.
Wave Structure- We are at starting point of wave, which kind of gives you an edge in riding the wave when you above your buying level
60 percent Retracement- Mean you will have easily 1:2 or 3 easy risk reward.
Doubts-If you are fearing in taking trades that mean you are taking stop loss amount more than you & your capital can handle.
Follow 1 percent rule and trail, that's it. Don't complicate life and trading.
Simply live and die. HaHA
Like and share is appreciated.
Thank You
To understand how our coding works read the below post-
NSE:KOTAKBANK NSE:KOTAKBANK1!
Part 1 Ride The Big Moves 1. Introduction to Option Trading
Option trading is one of the most versatile and dynamic segments of financial markets. Unlike traditional equity trading, where investors directly buy or sell shares, options give the right, but not the obligation, to buy or sell an underlying asset at a predetermined price on or before a specific date. This flexibility allows traders to hedge risks, speculate on market movements, and design strategies for income generation or protection against adverse price movements.
Options are derivative instruments, meaning their value derives from an underlying asset, which can be stocks, indices, commodities, currencies, or ETFs. The global options market has grown exponentially over the last few decades due to its ability to provide leverage, risk management tools, and strategic investment opportunities for both retail and institutional traders.
2. Basic Concepts of Options
To understand options trading, it’s essential to grasp some foundational concepts:
2.1 What is an Option?
An option is a contract that grants the holder the right, but not the obligation, to buy or sell a specific asset at a predetermined price (called the strike price) within a defined period (expiry date).
Call Option: Gives the holder the right to buy the underlying asset at the strike price.
Put Option: Gives the holder the right to sell the underlying asset at the strike price.
2.2 Key Terminology
Underlying Asset: The security on which the option is based.
Strike Price / Exercise Price: The price at which the underlying asset can be bought or sold.
Expiry Date: The date on which the option contract expires.
Premium: The price paid by the buyer to the seller for the option.
In-the-Money (ITM): Option has intrinsic value (e.g., a call option where strike price < current market price).
Out-of-the-Money (OTM): Option has no intrinsic value (e.g., a call option where strike price > current market price).
At-the-Money (ATM): Option strike price is approximately equal to the market price.
3. Types of Options
Options can be broadly categorized based on style, market, and underlying asset.
3.1 Based on Style
American Options: Can be exercised anytime before expiry.
European Options: Can only be exercised on the expiry date.
Bermuda Options: Can be exercised on specific dates prior to expiry.
3.2 Based on Market
Exchange-Traded Options (ETOs): Standardized contracts traded on regulated exchanges.
Over-The-Counter Options (OTC): Customized contracts traded directly between parties.
3.3 Based on Underlying Asset
Equity Options: Based on individual stocks.
Index Options: Based on market indices like Nifty, Sensex, S&P 500.
Commodity Options: Based on commodities such as gold, oil, or agricultural products.
Currency Options: Based on foreign exchange rates.
ETF Options: Based on exchange-traded funds.
4. How Options Work
Option trading involves two parties: the buyer and the seller (writer).
Buyer (Holder): Pays the premium and holds the right to exercise the option.
Seller (Writer): Receives the premium and has the obligation to fulfill the contract if the option is exercised.
For example:
Buying a call option gives the potential to profit if the underlying asset's price rises.
Buying a put option profits if the underlying asset's price falls.
Selling options can generate premium income but carries higher risk.

Gold Neowave Stuctural UpdateNamaskaram Everyone
Welcome to intelligent investor, we provide market insights by synchronising and combining all the price action waves from different time frames and gives you single trend.
How To Read My Charts...Click Below
FX:XAUUSD FX:XAUUSD OANDA:XAUUSD MCX:GOLD1!

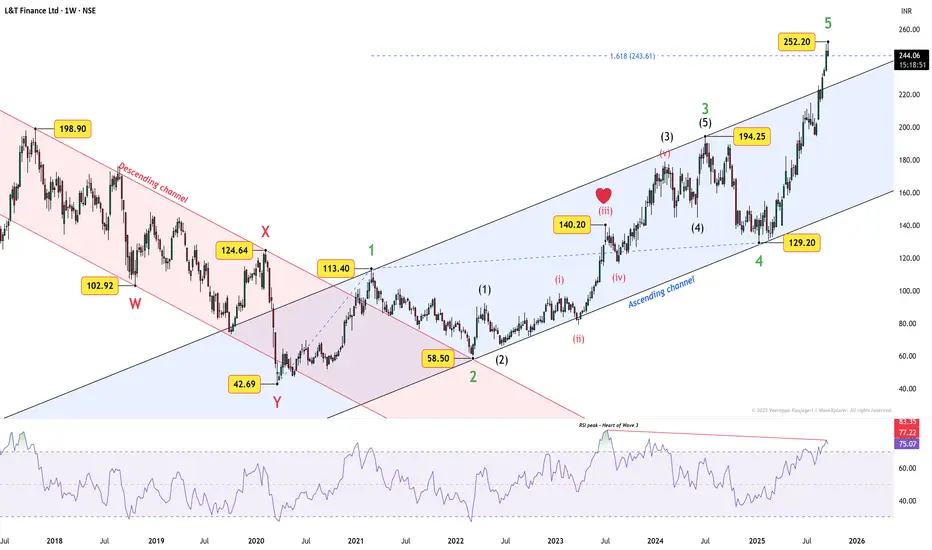
L&T Finance – Story of Two Channels and the Heart of Wave 3The chart of L&T Finance tells a neat Elliott Wave story through channels and Fibonacci.
First, notice the two channels. The old descending channel captured the corrective W-X-Y down to ₹42.69. From there, price shifted into an ascending channel .
Look how cleanly price respected this structure:
Green Wave 1 kissed the upper line of the ascending channel.
Green Wave 2 bottomed at ₹58.50 — right at the intersection of both channels.
Green Wave 3 again touched the channel’s upper line, marking its high with precision.
Green Wave 4 rested at the lower line of the channel.
Within Wave 3, the strongest push came at ₹140.20 — the famous heart of Wave 3 (what traders call the 3-of-3-of-3). RSI also peaked there, confirming it as the most powerful thrust of the sequence.
Now, price has surged into Green Wave 5 , reaching ₹252.20 , which is already above the 1.618 Fibonacci extension. It could extend higher, but RSI is diverging — momentum is not confirming the new highs.
That makes me cautious. While my view is leaning bearish, I don’t want to chase the upside here. Confirmation will come only if price falls back inside the ascending channel . Once that happens, I’ll update bearish targets based on fresh price action.
For now, the chart has delivered a textbook lesson: two channels, a Fibonacci story, and the heart of Wave 3 flashing exactly where it should.
Disclaimer: This analysis is for educational purposes only and does not constitute investment advice. Please do your own research (DYOR) before making any trading decisions.
Bank Nifty Neowave UpdateNamaskaram Everyone
Welcome to intelligent investor, we provide market insights by synchronising and combining all the price action waves from different time frames and gives you single trend.

USDJPY (Neowave Trading Idea)FX:USDJPY Namaskaram Everyone
Welcome to intelligent investor, we provide market insights by synchronising and combining all the price action waves from different time frames and gives you single trend.
Now Risk Reward is highly favourable
Trading with risk management, that is 1 percent rule with my charts.
How to Read My Charts-

Hindustan Copper – Breakout or Double Top?After completing an impulse up to 287.65 (Wave 1) and correcting down to 226.70 (Wave 2), Hindustan Copper is now powering higher in what looks like Wave (iii) of 3.
Wave count : Wave 2 bottomed at 226.70, setting the stage for Wave 3.
Current move : Sub-waves (i) and (ii) are done, and price is pressing into resistance at 287.
Breakout zone : A decisive move above 287 could confirm the Wave 3 extension. Failure here risks a pause or even a double top.
Retracement supports : 272.75 (0.236) and 263.95 (0.382) are likely pullback zones if Wave (iv) comes into play.
Momentum check : Volume has spiked aggressively, adding weight to the bullish case, while RSI is overbought — suggesting short-term cooling is natural.
Summary : 287 is the key make-or-break zone. Break it cleanly, and Wave 3 marches forward. Fail, and we may see a corrective detour first.
Disclaimer: This analysis is for educational purposes only and does not constitute investment advice. Please do your own research (DYOR) before making any trading decisions.

Gold Neowave UpdateFX:XAUUSD Namaskaram Everyone
Welcome to intelligent investor, we provide market insights by synchronising and combining all the price action waves from different time frames and gives you single trend.
GOLD & BTCUSD Video Analysis
How To Read My Charts...Click Below

Gold & BitCoin (Neowave Forecast)Namaskaram Everyone
Welcome to intelligent investor, we provide market insights by synchronising and combining all the price action waves from different time frames and gives you single trend.
How To Read My Charts...Click Below

USDJPY Becoming BearishFX:USDJPY
Namaskaram Everyone
Price is currently at very good structure and price to sell
If stop loss is big for you, than dont trade. Mean do not take more than 1 percent, on my charts. If you really wants to grow your capital.
I think price will easily go towards the febnachi .61 and further target will be seen after mc2 and mc3.
Additionally this structure will take some time, so you need to hold the trade for 15 days easily.
Still if you have a query, than leave a comment plz.
For How To Read My Charts.....Click Below
