Panic Bottom only for long term investors.The chart is displayed on Log scale. As we can see it is a complete impulse wave where wave 1 is the longest. When wave 1 is the longest the correction ends at the bottom of wave 2 (which is also a long term SL). It is a panic bottom . Since Bear is established here it will take a long time to recover . But it is a buy for long term investors
Elliott Wave

Nifty Analysis for Dec 09/10/11, 2025Wrap-up:
Nifty is forming a wxy pattern in wave C of major wave 5 has completed wave w at 25153 and wave x at 24587 and heading towards internal wave y of wave 5. In wave y, wave a is completed at 26104 and b is expected to be completed at 25728 once nifty breaks and sustains above 25908. Thereafter, Nifty will head towards its final wave c of wave y of wave 5.
What I’m Watching for Dec 09/10/11, 2025 🔍
Buy nifty if it breaks and sustains above 25908 for at least 25 min. SL 25728 for a target of 26142-26093.
Disclaimer: Sharing my personal market view — only for educational purpose not financial advice.

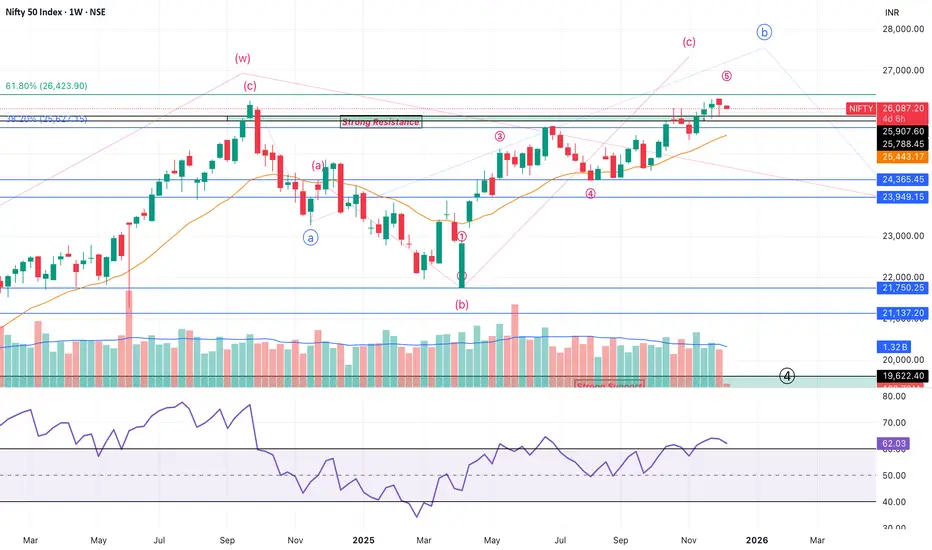
Nifty Short term view from December, 2025 to March/April 2026Wrap up:-
After breaking ATH, Wave X of Nifty has been shifted further and whole of the pattern has been changed. Now, wave w of major wave X is treated as completed at 26277 and wave x of Major wave X is running of which wave a of x of X was completed at 23263 and wave b of x of X is running. Internal wave b of wave b of x of X is completed at 21743 and heading towards wave c.
Min. projection of final wave 5 of internal wave c is achieved at 25627 and heading towards its second target 26423. Final target can be found from its internal wave 5 in lower time frame.
Expectation:- Wave 5 is expected to be completed in Dec, 2025 or Mid of January, 2026 and thereafter, correction in Nifty starts from Mid January, 2026 to March/April 2026.
Disclaimer: Sharing my personal market view — only for educational purpose not financial advice.
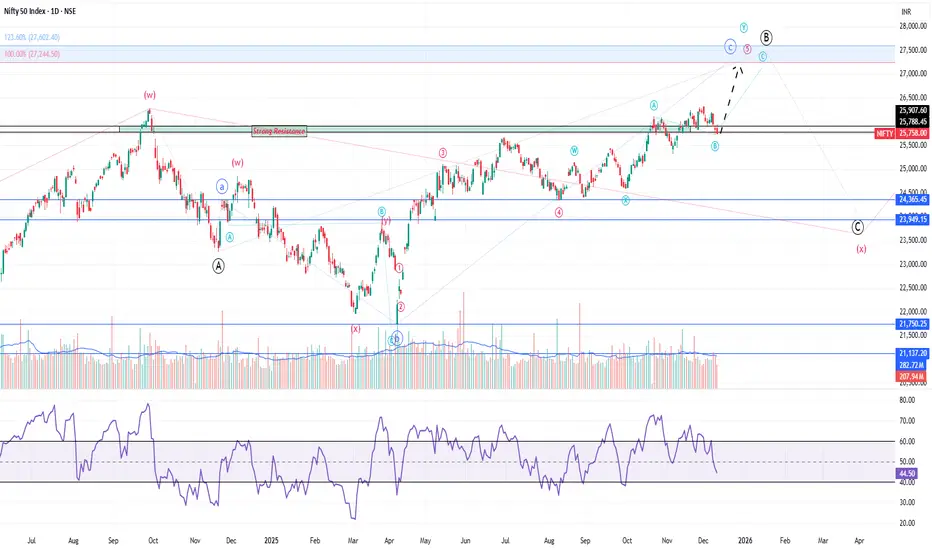
Positional View in Nifty till december, 2025 and January, 2026Wrap up:-
In wave 5 of c of b of X, Nifty is making wxy pattern. Wave w has been completed at 25153 and wave x at 24587 and heading towards internal wave y of wave 5.
In wave y of wave 5, Nifty has completed wave a at 26104 and b at 25728 and heading towards its wave c for a target of 27244.
Buy Nifty at cmp 25758 sl 25728 for a target of 27244 till december, 2025 or mid of january, 2026.
Disclaimer: Sharing my personal market view — only for educational purpose not financial advice.
Hindalco: Terminal Wedge, Reversal Risk HighStructural Context
Initially, I considered the decline from 864 toward 770 as a standard ABC correction. But the drop from Wave 2 was far too sharp and drove RSI into deep oversold territory — behaviour that aligns better with impulsive price action.
Because of this, the move is treated as a developing 1-2-3 rather than a corrective ABC.
This adjustment also aligns perfectly with the broader structure: a completed Wave 3 at 770.15, followed by a three-wave recovery into Wave 4.
Wave 4 Completion – Ending Diagonal + Fibonacci Symmetry
Wave C of the larger Wave 4(ABC Flat) shows a clean ending-diagonal wedge, and Wave (v) within it reached the 1.618 extension of Wave (i) measured from Wave (iv).
This Fibonacci precision adds strong weight to the interpretation that Wave 4 has completed at 833.50.
With this level established, the minor bounce into Wave (ii) now acts as the corrective pullback before the expected third wave down.
Invalidation remains at the 1.618 level around 833.50 — any move above that would negate the immediate bearish view.
Path Ahead – Toward Wave 5
As long as 833.50 holds, the expectation is for a five-wave decline toward the previous structural support near 770.15, completing Wave 5.
Wave (iii) should ideally accelerate, and momentum confirmation will be key as price moves into the mid-780s.
Disclaimer
This analysis is for educational purposes only and does not constitute investment advice. Please do your own research (DYOR) before making any trading decisions.

Nifty Analysis for Dec 12, 2025Wrap-up:
Nifty breaks and sustains above 25908. Therefore, b is completed at 25695 and now, Nifty will head towards its final wave c of wave y of wave 5 but before that it will retest the breakout level of 25908.
What I’m Watching for Dec 12, 2025 🔍
Sell nifty only intraday if it breaks and sustains below 25965 SL 26038 for a target of 25916-25900-25887.
Disclaimer: Sharing my personal market view — only for educational purpose not financial advice.

XAUUSD Long IdeaExpecting XAUUSD to move toward the 4220 area, with a risk-to-reward ratio of 1:1.5.The stop-loss should be placed strictly below 4170, and the target is 4222.Please ensure you conduct your own research before entering any trades.

Coforge: Ending Diagonal Signals Exhaustion Near Wave (D) HighCoforge has likely completed Wave c of (D) with a clean ending diagonal near the upper boundary of the multi-month triangle structure. This raises the probability of Wave (D) being complete — if price turns down from here.
Technical View
Ending Diagonal: The final leg into ₹1,986 shows a wedge structure — typical of terminal C-waves inside corrective patterns.
Structural Resistance: This move hits the B–D trendline, a natural pivot for Wave (D) completion.
Pivot Zone: The 52-week high at ₹2,005.35 is a clean external invalidation. A sustained move above it would contradict the triangle scenario.
Trade Setup (If Reversal Confirms)
Bias: Short-term bearish (potential Wave E)
Trigger: A confirmed bearish reversal candle in the ₹1,985–₹1,995 zone
Target: ₹1,700–₹1,750
Invalidation: Close above ₹2,005.35
Note: This is a countertrend short inside a strong rally. Wait for the actual reversal signal — the ED alone is not a sell trigger.
Disclaimer: This analysis is for educational purposes only and does not constitute investment advice. Please do your own research (DYOR) before making any trading decisions.

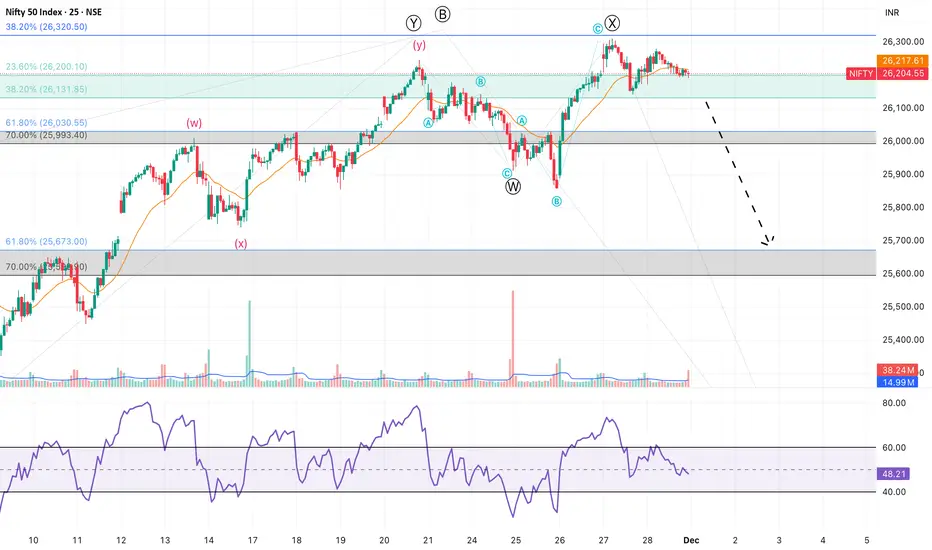
Why Nifty’s Ending Diagonal Turns the Bias BearishAfter my previous bullish take on Nifty (see linked related publications), the view has now flipped.
And no — it’s not because the US indices are cracking.
And no — it’s not because Bitcoin is collapsing and draining liquidity.
Those may add pressure, sure.
But the core reason I’m turning bearish is right on the chart — in the structure itself.
Daily Chart – Why the Tone Has Changed
The key shift came from the overlap at 25,448.95 , which strongly hints that the rally from 24,404.70 unfolded as an ending diagonal , with all five legs subdividing into 3-wave structures (a-b-c).
This overlap is what invalidates the impulsive interpretation and turns the structure corrective.
That means the entire rise into wave (B) likely finishes a B-wave top , and Nifty may now be moving into wave (C) down.
At this point, Nifty could be forming either:
An ABC Expanded Flat , or
A Running Flat
Both are bearish in the short-term and typically resolve with a deeper C-wave.
And honestly, there is zero point chasing this market unless we get a decisive close above the ATH — whether on the daily , the weekly , or especially the monthly , which is about to complete and should give a clean directional clue.
Until that happens, the risk–reward on fresh longs is questionable.
This entire bearish view gets invalidated only if Nifty posts a strong , sustained close above the ATH on higher timeframes.
Weekly Chart – Resistance Stack Remains Heavy
The weekly structure adds more weight to the bearish bias:
Nifty is testing the ATH zone , a major psychological resistance.
Price is also hitting the rising trendline , which has already rejected earlier attempts.
Both these zones converge right at current levels — not the best place to be aggressive on longs.
This is a classic “let the market prove itself” zone.
Summary
The structure has shifted to corrective due to the ending diagonal overlap.
Daily chart suggests an Expanded or Running Flat scenario.
Weekly chart shows dual resistance — ATH + rising trendline.
No fresh longs unless there’s a clean breakout above ATH on higher timeframes.
Monthly candle close will be crucial.
Patience > prediction. Let the structure confirm before acting.
Disclaimer: This analysis is for educational purposes only and does not constitute investment advice. Please do your own research (DYOR) before making any trading decisions.

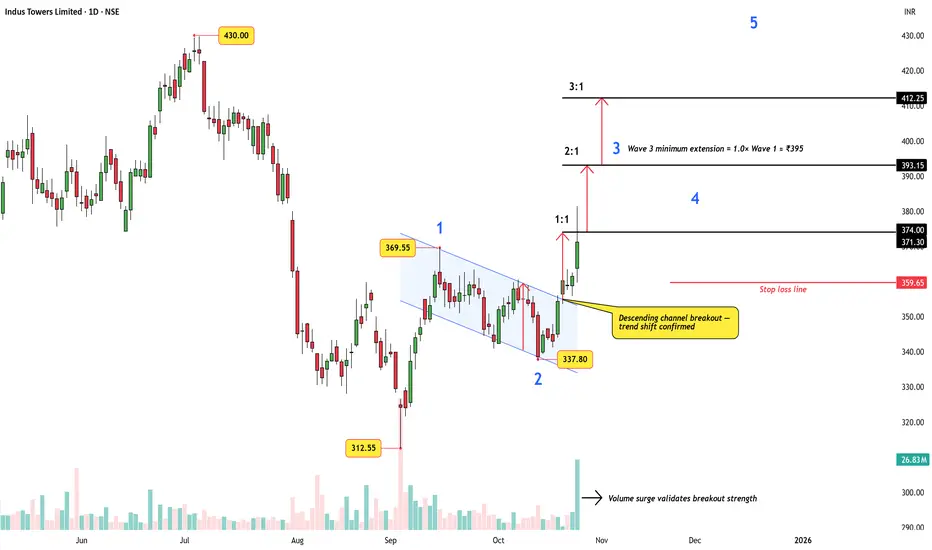
Indus Towers: Channel Breakout Meets Wave TheoryA simple but powerful concept from classical technical analysis — the channel breakout target — plays out beautifully here.
This idea, also discussed by Dr. Sudhir Dixit in his book on breakout signals, gives traders a disciplined way to estimate post-breakout targets.
After a steady five-wave advance from ₹312.55 to ₹369.55, Indus Towers entered a clean descending channel , forming the corrective Wave 2.
The breakout that followed came with a strong volume surge , confirming a clear shift in trend direction.
Concept Recap
In a channel breakout, the target can be derived by measuring the height of the channel (distance between support and resistance) and projecting it upward from the breakout point.
That gives the 1:1 projection , while stronger rallies often stretch toward 2:1 or 3:1 multiples of that range.
Wave Perspective
Elliott Wave traders can interpret this breakout as the early phase of Wave 3 , which typically extends 1.0 to 1.618× Wave 1 .
In this case, the 1.0× projection aligns near ₹395, while higher targets in the ₹412–₹430 zone fit naturally within Wave 3–5 progression.
Key Chart Highlights
Descending channel breakout — trend shift confirmed
Volume surge validates breakout strength
Wave 3 minimum extension ≈ ₹395
Stop-loss below ₹359 keeps the structure intact
Takeaway:
Even without labeling waves, the logic of a channel breakout offers a structured, rule-based method for identifying profit zones.
Combine it with wave theory, and you transform a simple pattern into a roadmap for impulsive rallies.
Disclaimer: This analysis is for educational purposes only and does not constitute investment advice. Please do your own research (DYOR) before making any trading decisions.
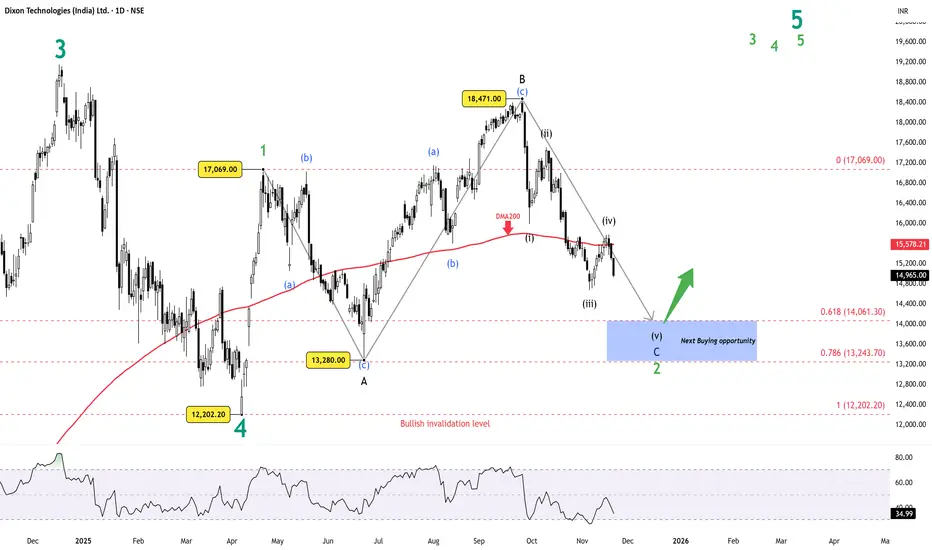
Dixon Technologies: Watching a Key Reversal Zone AheadDisclaimer:
This analysis is for educational purposes only and does not constitute investment advice. Please do your own research (DYOR) before making any trading decisions.
Dixon’s decline is developing as a running flat within Wave 2. Wave A and B are already in place, with Wave B stretching above the Wave A origin, which is typical behaviour when the larger trend is still strong. The final leg, Wave C, is still unfolding.
Inside Wave C, waves (i) through (iv) look complete, and the market appears to be working on wave (v). Momentum has been weakening throughout the drop, which often leads to an ending diagonal in the final wave of a running flat. The structure so far supports that possibility.
The 0.618 retracement near 14,061 is the critical zone for this setup. This level aligns with typical Wave 2 depth and sits right where wave (v) of C can complete. RSI has not yet shown bullish divergence, so a marginal lower low in price, paired with a higher low in RSI, would be the ideal confirmation signal.
If price forms the expected small ending diagonal into the 0.618 level and momentum improves, this would complete the running flat and set the stage for the next bullish sequence.
Summary
Wave 2 forming as a running flat.
Wave C still in progress; wave (v) pending.
Weak momentum favours an ending diagonal finish.
Key reversal zone: 0.618 retracement near 14,061.
Watching for bullish RSI divergence before confirmation.
USDCAD - Breakout Will Flip the Trend BullishUSDCAD has been sliding inside a well-defined descending channel, completing a full five-wave drop toward the support zone. The structure from the top looks corrective rather than impulsive. That means the downtrend is weakening as it reaches its final leg.
Your count shows Wave 3 finishing at the dashed red line zone, followed by a small Wave 4 bounce, and now the market is pushing into the last Wave 5. This final drop is expected to target the Fibonacci levels near 1.3915 and 1.3895 . Nothing suggests strength until those levels are tested.
The price is still trapped inside the downward channel, and every bounce has been getting sold. That confirms sellers are still in control for now. Wave (C) is close to completion, but buyers haven’t proven anything yet.
The bullish outlook only becomes valid after a clean breakout above the channel. Without that break, any upside move is just noise inside a bearish structure. The breakout must hold with a higher low to confirm a trend reversal.
If the channel breaks decisively, a strong bullish reversal toward 1.40+ becomes possible. The entire structure suggests the downtrend is aging, so a major upside swing is likely once sellers exhaust. Until then, downside targets remain open and caution is necessary.
Stay Tuned!
@Money_Dictators

XAUUSD Gold Long IdeaI’m expecting Gold to move toward the $4,240 level. The stop loss should be placed below the swing low at $4,162, maintaining a risk-to-reward ratio of 1:3.

XAUUSD – Clean Rejection from LTF Demand With Potential Upside EGold tapped into a refined LTF demand pocket and instantly showed rejection, indicating buyers are stepping in exactly where they should. This aligns well with the ongoing HTF bullish bias and maintains the broader structure intact.
The strong wick + immediate reclaim of the micro-range suggests absorption and willingness to push higher if structure follows through.
Bullish Path:
• Tap into LTF demand
• Rejection + recovery inside the zone
• Micro structure shift
• Expansion toward the next HTF imbalance

Nifty Short term view (Till December)Wrap up:-
Nifty has completed its wave B of major wave 2 @26306 and heading towards wave C of major wave 2.
I’ll be watching for the market to sustain above 26104 atleast 25 min. for a target of 24365-22949 with a SL of 26247 (SL daily candle close).
Disclaimer: Sharing my personal market view — only for educational purpose not financial advice.

Nifty Analysis for Dec 01, 2025Wrap-up:
Nifty is forming a wxy pattern in wave C of major wave 2 has completed wave x @26310 and heading towards internal wave y.
What I’m Watching for Dec 01, 2025 🔍
Short nifty if it breaks 26131 SL 26310 for a target of 26030-25993 and 25673-22596 (SL on 15 min. candle close).
Disclaimer: Sharing my personal market view — only for educational purpose not financial advice.
usdinr alert for long sideusdinr wonderful monthly weekly illiot 5th wave completion stage , 5th wave might goes upto 90.57 level .. keep 91 as sl ..nd sell with every rise .. till 90.57 ..day close above 91 sl.... target 86/80/76/69... it might be temporary pose of usd era nd inr uprise we might see... jai hind..this is purely study purpose

ICICI Bank — 200-DMA Rejection Keeps the Downtrend IntactMarket Context
ICICI Bank continues to trade inside a broad descending channel that has governed price since the 1500 peak. Every counter-trend rally has been corrective so far, and the recent recovery has shown the same character — overlapping candles, choppy subdivisions, and clear respect for channel resistance.
Key Technical Drivers
1. Rejection at the 200-DMA
The rally stalled exactly at the 200-Day Moving Average. This is the same zone where price lost momentum earlier, reinforcing that the long-term bias remains downward. A failed attempt to reclaim the 200-DMA in a corrective environment typically signals trend continuation rather than reversal.
2. Channel Resistance Still Untouched
Even though momentum carried the stock above short-term levels, the broader upper channel boundary continues to act as the main ceiling. Price behaviour near this level is corrective, not impulsive — another sign that the move is still part of a larger complex structure.
3. Structure Supports a Triple Zigzag (W-X-Y-X-Z)
This entire decline is best interpreted as a higher-degree W-X-Y-X-Z correction.
W bottomed at 1342.60
X rallied to 1445
Y bottomed at 1317.40
The ongoing rally fits well as the second X wave
Wave (c) of this X leg may be close to completion, but the subwaves allow room for a marginal push to retest the channel top before turning lower. Nothing in the current leg looks impulsive enough to suggest a larger trend reversal.
Trading Plan
Direction: Expect the next leg to unfold downward as Wave Z begins.
Target Zone: Break below 1317.40 is likely, with measured support near 1280–1300 at the lower boundary.
Invalidation: A sustained break above 1411.90 invalidates the bearish Z-wave view and opens the door for a trend reassessment.
Conclusion
The failed 200-DMA retest, corrective price structure, and channel resistance all point to the current recovery nearing exhaustion. Whether Wave X makes one more marginal high or not, the broader path remains lower toward the Wave Z terminal zone.
Disclaimer: This analysis is for educational purposes only and does not constitute investment advice. Please conduct your own research before taking any trading decisions.

Silver - CorrectionSeveral signals indicate that a correction is possible around the 60k level (slightly below or above). There’s also an interesting setup in gold, but more on that later in the next chart/idea.”

Bank of Baroda: Impulsive Breakout or Running Flat Trap?The recent All-Time High at 303.95 looks like a breakout to the naked eye, but the internal structure suggests a classic Elliott Wave Trap .
The Technical Disconnect : While the move above the previous peak (299.70) was strong, it lacks the characteristics of a genuine Wave 3 impulse:
Structure : The rally from 190.70 subdivides into a clear 3-wave (a)-(b)-(c) corrective pattern, not a 5-wave motive sequence.
Precision Resistance: The price reversed exactly at the 100% Fibonacci extension, a common termination point for corrective B-waves, not impulsive breakouts.
Momentum : RSI hitting 72.42 at resistance signals exhaustion rather than sustained trend strength.
The Setup: Running Flat Correction This price action confirms a Running Flat scenario. The "breakout" was likely a Wave B bull trap designed to clear stops before the final leg down.
Outlook : We are entering Wave C (down).
Target Zone : 234 – 247. This green box aligns with the 50-61.8% retracement cluster of the recent rally.
Invalidation : A weekly close above 304 . If bulls sustain price above this level, the corrective view is invalid, and a true breakout is in play.
Disclaimer: Educational view only. DYOR.

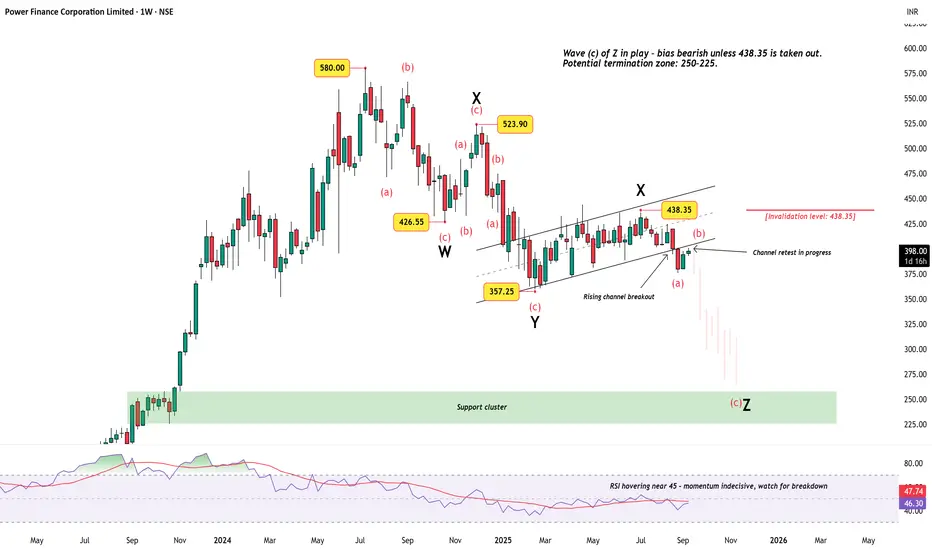
Power Finance Corporation – Complex Correction Still in PlayAfter topping out near ₹580, Power Finance Corporation (PFC) has been locked in a prolonged corrective structure. The price action since mid-2023 suggests a triple correction (W-X-Y-X-Z) , with the final leg (Wave Z) now unfolding.
Technical View
Price broke down from a rising channel and is currently retesting the underside of that channel – a classic setup to watch for continuation.
Wave (c) of Z appears to be in progress, keeping the near-term bias tilted bearish unless price crosses above ₹438.35 (invalidation level).
A potential termination zone lies around ₹250–225, aligning with the highlighted support cluster.
RSI is hovering in the mid-40s, showing lack of upside strength and leaning toward further weakness.
Summary
Bias remains bearish while below ₹438.35. A deeper leg into the ₹250–225 support cluster cannot be ruled out before this complex correction completes.
Disclaimer: This analysis is for educational purposes only and does not constitute investment advice. Please do your own research (DYOR) before making any trading decisions.
BTCUSD — extending the declineThe most likely scenario I see is a move to the 70k area or slightly lower. From that level we can then look for the next move.

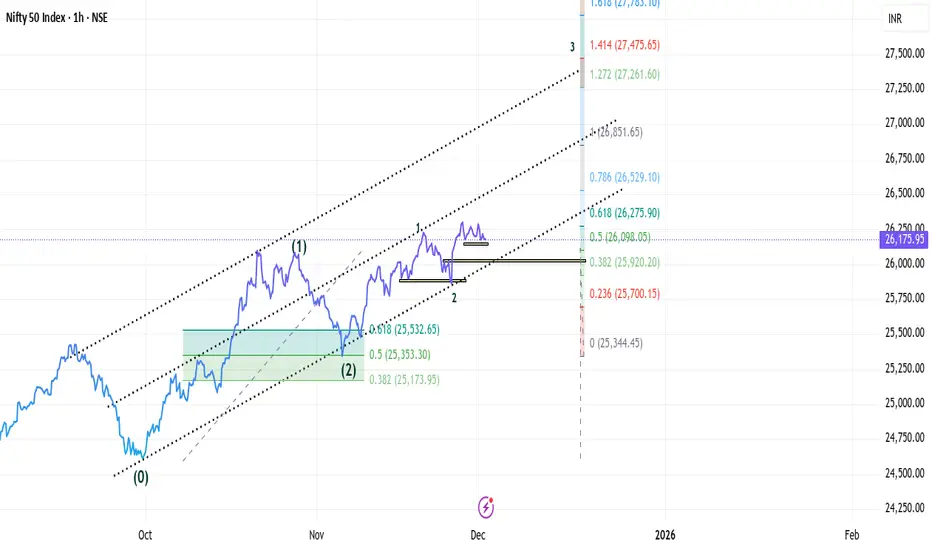
NiftyElliote wave analysis
Nifty is starting now 3rd of 3rd wave as per count..
Buy at CMP (26175)
SL (25850) OR break of 0-2 trend line
Target 1 (27058)
Target 2 (27783)