GBPNZD_Short Idea Elliot WaveI anticipate GBPNZD to decline below 2.3090, with a strict stop-loss set at 2.3450. Please conduct your own research before considering this trade.
Elliott Wave

Nifty Analysis for Nov 17, 2025Wrap-up:
Nifty after breaking 38.20% level; retraces back in its strong resistance zone 25917-25937.
What I’m Watching for Nov 17, 2025 🔍
Short nifty in the strong resistance zone 25917-25937 SL 26011 for a target of 25582-25526 and 25042-25167 (SL on 15 min. candle close).
Disclaimer: Sharing my personal market view — only for educational purpose not financial advice.

PAYTM (NEOWAVE Analysis)Namaskaram Everyone
I have made a video on paytm, kindly watch that to understand my view.
If you want to know about your stock than feel free to ask me in comment.
Thanks.
PAYTM Video Analysis

PAYTM | Neowave AnalysisHi everyone
This is an neowave analysis as you asked about paytm in comment so here it is.
If you have more query or anyone else wants to know my view on particular stock, than simply leave a comment, i will be happy to help.
Thank You

Gold (Neowave Trading Idea)Hello everyone
# Gold is started walking again in daily charts and its going or atleast try for the time being to break its all time again.
## Stoploss will be 3964 if breaks dont sell just exit.
Thanks

Kotak Mahindra Bank (Neowave Trading Idea)Namaskaram
Cycle - consolidated 5th up swing on Long Term Chart (Black Labelling).
Medium Cycle (Blue Labelling) giving an correction, which most likely completed.
Currently retraced 61 percent.
LTP = 2079.7
stoploss = 1,986
About Target- Well target should be above 2302.
But this price should reach before January. So if you see price is rising but not giving enough speed than exit where you get a good price.
I will also make a video on this one today and upload it here.
Thank You.

Kotak Mahindra Bank (Neowave Forecast)NSE:KOTAKBANK
Namaskaram
Cycle - consolidated 5th up swing on Long Term Chart (Black Labelling).
Medium Cycle (Blue Labelling) giving an correction, which most likely completed.
Currently retraced 61 percent.
LTP = 2079.7
stoploss = 1,986
About Target- Well target should be above 2302.
But this price should reach before January. So if you see price is rising but not giving enough speed than exit where you get a good price.
Thank You.

Nifty Analysis for Nov 14, 2025Wrap-up:
Nifty has formed a impulsive pattern and internal wave 5 of internal wave b has been treated as completed once nifty breaks 25746.
What I’m Watching for Nov 14, 2025 🔍
I’ll be watching for the market to break 38.2% level i.e. 25746; thereafter short nifty below 25685 for a target of 25580-25150 SL 25870 (SL on 15 min. candle close).
Disclaimer: Sharing my personal market view — only for educational purpose not financial advice.

XAUUSD Gold ShortI expect Gold to decline toward the 3700–3800 range. A trade can be considered with a stop-loss set at 4382, maintaining a risk-to-reward ratio of 1:1.5. Please do your own research before entering any trade.

Updated Nifty Short term viewNifty has completed its wave x of major wave B @25318 and heading towards wave y of major wave B.
I’ll be watching for the market to sustain above 25616 atleast 25 min. for a target of 25800-25864 with a SL of 25456 (SL on 15 min. candle close).
Disclaimer: Sharing my personal market view — only for educational purpose not financial advice.

Nifty Analysis for Nov 11, 2025Wrap-up:
Nifty has break its 38.20% retracement i.e. 25616 as mentioned earlier and completed its wave a @25653. Now, heading towards its wave b for a target of 25515-25531.
What I’m Watching for Nov 11, 2025 🔍
I’ll be watching for the market to retrace upto min. 38% level i.e. 25597; thereafter short nifty below 25583 for a target of 25515-25531 SL 25614 (SL on 15 min. candle close).
Disclaimer: Sharing my personal market view — only for educational purpose not financial advice.

Nifty Analysis for Nov 13, 2025Wrap-up:
Earlier we have wrongly marked internal wave a @ 25551. The internal wave a of nifty has been completed @25653 and wave b has been completed @25449 and wave c has been treated as completed once nifty breaks 25699.
What I’m Watching for Nov 13, 2025 🔍
I’ll be watching for the market to break 38.2% level i.e. 25699; thereafter short nifty below 25640 for a target of 25492-25150 SL 25800 (SL on 15 min. candle close).
Disclaimer: Sharing my personal market view — only for educational purpose not financial advice.

AUDCAD_Short Elliot Wave I anticipate AUDCAD to form an ABC pattern targeting 0.9060, with a strict stop-loss at 0.9216. The risk-to-reward ratio is 1:4. Please conduct your own research before executing any trade.

Nifty long term elliot wave update.Looks like we are in wave (v) of larger wave (3).
Once this wave (3) ends there is likely to be painful correction for about +250days to wave (4). Which will be more than the time taken by (2) in 2021-22.

Nifty Analysis for Nov 12, 2025Wrap-up:
Nifty has completed its major wave B @25715. Now, heading towards its major wave C.
What I’m Watching for Nov 12, 2025 🔍
I’ll be watching for the market to break 38.2% level i.e. 25614; thereafter short nifty below 25555 for a target of 25150 SL 25654 (SL on 25 min. candle close).
Disclaimer: Sharing my personal market view — only for educational purpose not financial advice.

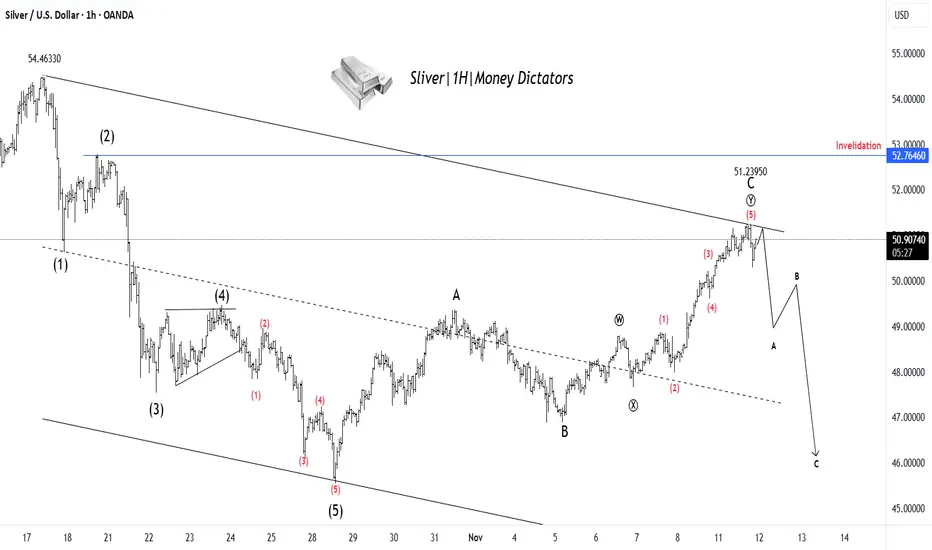
XAG/USD Set for Decline After Finishing Wave YSilver has completed a clear 5-wave upward move, ending near the 51.23 zone, which likely marks the completion of Wave C of the corrective structure. Price action shows rejection from the upper trendline, signaling that buying momentum is fading. This suggests the start of a new A–B–C corrective decline, where Silver could first drop toward 48–47 levels before any temporary bounce. The overall structure remains bearish in the short term unless the price breaks above the 52.76 invalidation zone. In simple terms: rally looks complete → downside correction likely ahead.
Stay tuned!
@Money_Dictators
Thank you :)
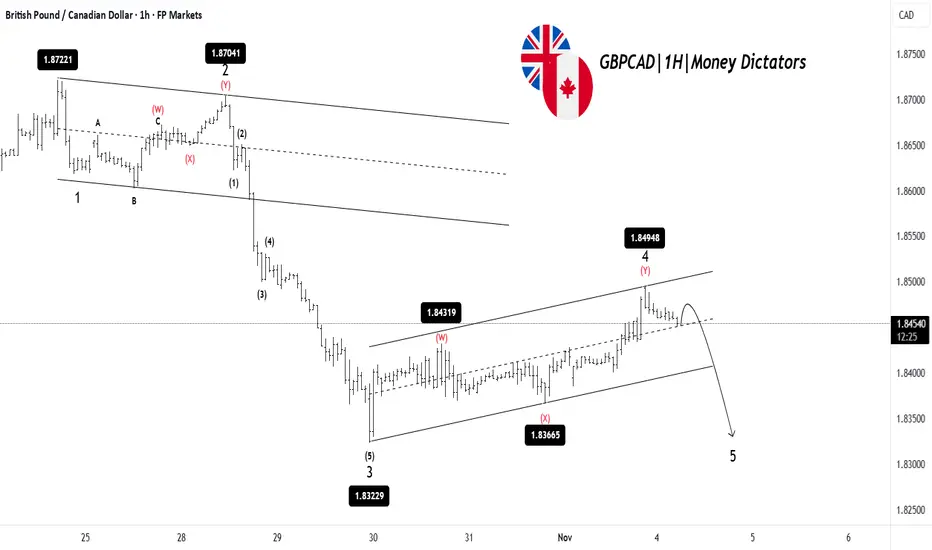
GBPCAD: Bears Ready to Push Into Wave 5GBPCAD has completed a clear 1-2-3 move to the downside, followed by a corrective Wave 4 that has pushed the price higher inside a rising channel. This correction now looks nearly complete, as the price is struggling to break above the resistance. Once Wave 4 is finished, the chart suggests a final drop into Wave 5 toward the lower support zone. That would complete the overall bearish structure before any larger reversal can happen. In simple terms: correction is almost done → one more leg down expected.
Stay tuned!
@Money_Dictators
Thank you :)
DOTUSDT_Short Elliot WaveI'm anticipating DOT to move toward the $3 level, so a potential short position could be considered around $3.30. Make sure to do your own research before taking any trade.

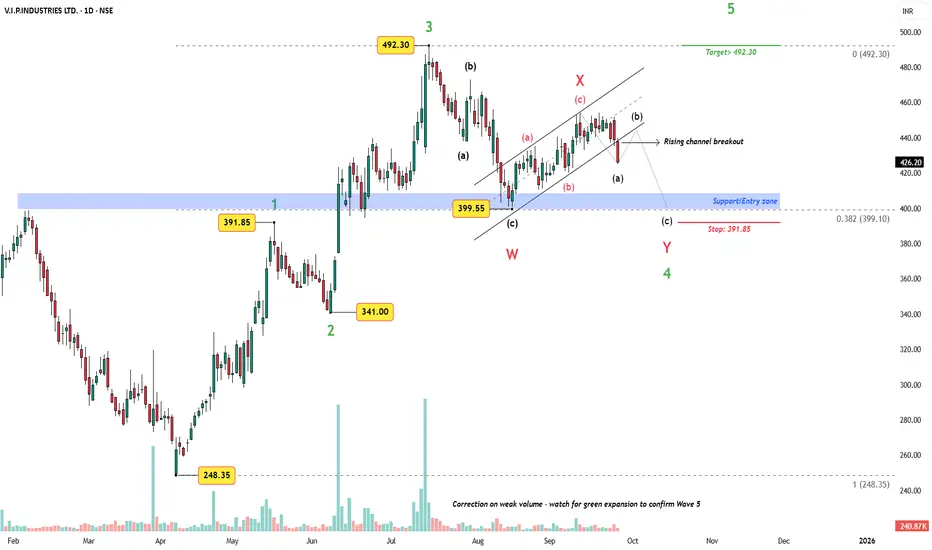
VIP Industries – Rising Channel Breakdown, Support Zone in FocusChart Structure
The stock completed a wave 3 advance up to 492.30. What followed is a corrective W–X–Y structure, which probably might test the previous breakout zone around 408–400. This aligns with the 0.382 Fibonacci retracement and previous Wave 1 high, providing strong support.
Key Observations
The corrective leg has unfolded on weak volume, typical of a Wave 4 structure.
Recent breakdown from the rising channel suggests a final (c) leg of Wave Y into the blue support zone.
A possible wave (b) retest of the broken channel cannot be ruled out before the final dip.
As per Elliott Wave rules, Wave 4 must not overlap Wave 2 (391.85) – keeping structural integrity intact.
Trade Plan
Entry Zone: Strictly in the 408–400 support band.
Stop-Loss: 391.85 (under prior Wave 1 high, violation would invalidate the count).
Target: A new high above Wave 3, i.e., ≥492.30, as Wave 5 should extend beyond Wave 3.
Volume Insight
Correction is unfolding on weak volume – confirmation of Wave 5 will require a green volume expansion from the support zone.
Conclusion
As long as 391.85 holds, the Wave 4 correction is near its end. A rally into Wave 5 with targets above 492 remains the primary scenario. However, patience is key – entry only in the marked support band.
Disclaimer: This analysis is for educational purposes only and does not constitute investment advice. Please do your own research (DYOR) before making any trading decisions.
Trent Ltd – Double Zigzag Correction in PlayAfter topping out at ₹8,345, Trent has been locked in a larger corrective structure that now appears to be unfolding as a W–X–Y double zigzag on the weekly chart.
Wave Count
Wave W bottomed at ₹4,715 as a clear ABC.
The rally to ₹6,261 completed Wave X.
Price is now progressing in Wave Y, where:
Wave A has unfolded,
Wave B topped at ₹5,674,
Wave C is expected to continue lower.
Key Levels
Target 1 (1.0 extension): ₹4,370
Target 2 (1.618 extension): ₹3,565
Stop-loss / Invalidation:
Trading level: ₹5,674 (Wave B high)
Structural level: ₹6,261 (Wave X high)
RSI Check
RSI remains below 50, confirming bearish momentum.
Conclusion
The correction appears incomplete with scope for another leg down before a larger recovery can begin. While the working invalidation sits at ₹5,674, structurally the bearish count holds until ₹6,261 is broken.
Disclaimer: This analysis is for educational purposes only and does not constitute investment advice. Please do your own research (DYOR) before making any trading decisions.

Gold Neowave Forecast (10-11-2025)Hello everyone
Sorry for absence as I go in research mode with Neowave and found something interestin, anyway lets talk about gold.
# Gold is started walking again in daily charts and its going or atleast try for the time being to break its all time again.
# I also added a blue box on the chart which is an time box, mean price must cross high within this time limits.
## Stoploss will be 3964 if breaks dont sell just exit.
Rest we will talk in the video along with BTC and Tesla.
Thank You.

Bitcoin_Short Elliot WaveBitcoin appears to be completing an ABC pattern, potentially reaching up to 106,000. I anticipate a downside move below 99,000 once it tests resistance around 106,000. A short position could be considered near that level with a tight stop-loss.Please do your own research before taking any trade decisions.

Hyundai Motors – Impulse Wave Completed
Since listing on 22 Oct 2024, Hyundai bottomed on 7 Apr 2025 and has since been forming its first impulse wave.
It appears that the stock has completed its first impulse wave of minor degree with a Wave 1 extension.
The wave structure suggests that -
Wave 1 extension had sub-wave 1 extension (as per EWP, extended sub-waves behave similar to parent wave).
Wave 3 = 78.6% of Wave 1
Wave 5 = 78.6% of Wave 3
Internal wave counts align with the extension scenario.
In case of Wave 1 extensions, Waves 3–5 usually terminate within 0.618 – 1.414x of Wave 1.
Recommendation:
Investors who are long may consider exiting at current levels or trade with a strict trailing stop loss.
