SRF Ltd. Possible Elliott wave counts, looks corrective phaseHello Friends,
Here we had shared possible wave counts of SRF Ltd. which is clearly showing corrective phase in current scenarios, After completing impulse move as 1-2-3-4-5 now we are in correction, which is unfolding as A-B-C as a zigzag correction pattern, which should unfold in 5-3-5 subdivisions, and already we had finished wave A and B, now possibly we are unfolding wave C which should come as in five subdivisions as a 1-2-3-4-5, in which we had finished 1-2 and now possibly we are in 3 of C, Overall, as per Elliott wave structure, bias are bearish in this stock, with Invalidation level of price crossing above 2636. which may give good lower levels in upcoming weeks.
Still there is a support area shared and discussed in this video post which is horizontal support zone, once its broken then for bears, but it can provide support also, so be cautious, Some significant snap shots are shared below, please go throughout once. I am not sebi registered analyst. My studies are for educational purpose only.
Please Consult your financial advisor before trading or investing. I am not responsible for any kinds of your profits and your losses.
MACD Negative crossover in Daily time frame
MACD in weekly making lower high and now in down tick position
MACD in monthly already running Negative
RSI on daily down tick and broken trendline support
RSI on weekly breakdown as head n shoulder pattern and also broken support trendline
Price closed below 20DMA and also challenging lower Bollinger band on daily
Most investors treat trading as a hobby because they have a full-time job doing something else.
However, If you treat trading like a business, it will pay you like a business.
If you treat like a hobby, hobbies don't pay, they cost you...!
Hope this post is helpful to community
Thanks
RK💕
Disclaimer and Risk Warning.
The analysis and discussion provided on in.tradingview.com/u/RK_Charts/ is intended for educational purposes only and should not be relied upon for trading decisions. RK_Charts is not an investment adviser and the information provided here should not be taken as professional investment advice. Before buying or selling any investments, securities, or precious metals, it is recommended that you conduct your own due diligence. RK_Charts does not share in your profits and will not take responsibility for any losses you may incur. So Please Consult your financial advisor before trading or investing.
Elliotwaveanalysis

DR REDDY - Sideways to bearishStock is in ongoing impulse on a major timeframe.
In the short term, it is in an ongoing correction.
In the very short term, the Stock is in the B wave, a breakdown of the recent swing low with good volumes can ensure start of the C wave.
A negative divergence of RSI can be observed in the recent upmove.
Due to Ongoing Flat correction(3-3-5), the rule of equality will hold for A=C. The length of C downward will be at least the length of A.

ICICIBANK - EW - Short time correctionStock is trading in Impulse on Major (Weekly and Monthly) Timeframe.
Currently, trading in a short-term correction. Retracement levels are marked on the chart.
4 wave of Major 5 is going on.
Expected to complete short-term correction in max 2 weeks and again start up move.
The analysis is only for educational purposes. Please trade at your own risk

Bitcoin analyzing Elliot wave counts, Buy on Dips or on BreakoutHello Friends,
Here we had shared possible Elliott wave counts on 4 hourly chart of BTCUSD BITCOIN, which clearly indicates that we are in some kind of impulse wave, where we can get fresh opportunity to go long very soon, but, how and where, at which level, every thing is explained in this video post, so please go through out this video.
I am not sebi registered analyst.
My studies are for educational purpose only.
Please Consult your financial advisor before trading or investing.
I am not responsible for any kinds of your profits and your losses.
Most investors treat trading as a hobby because they have a full-time job doing something else.
However, If you treat trading like a business, it will pay you like a business.
If you treat like a hobby, hobbies don't pay, they cost you...!
Hope this post is helpful to community
Thanks
RK💕
snap shot of possible Elliott wave counts
Disclaimer and Risk Warning.
The analysis and discussion provided on in.tradingview.com/u/RK_Charts/ is intended for educational purposes only and should not be relied upon for trading decisions. RK_Charts is not an investment adviser and the information provided here should not be taken as professional investment advice. Before buying or selling any investments, securities, or precious metals, it is recommended that you conduct your own due diligence. RK_Charts does not share in your profits and will not take responsibility for any losses you may incur. So Please Consult your financial advisor before trading or investing.

MAINFRA trade set based on possible Elliott wave countsHello Friends,
Here we have shared possible trade setup in MARUTI INFRASTRUCTURE LTD. based on possible Elliott wave counts, One can go long above 118 or below 109, with invalidation level of 99.45 for Targets of 126.75 and 140++
I am not sebi registered analyst. My studies are for educational purpose only. Please Consult your financial advisor before trading or investing. I am not responsible for any kinds of your profits and your losses.
Some significant snapshots are shared below, please go throughout.
Thanks
RK💕
Most investors treat trading as a hobby because they have a full-time job doing something else.
However, If you treat trading like a business, it will pay you like a business.
If you treat like a hobby, hobbies don't pay, they cost you...!
Disclaimer and Risk Warning.
The analysis and discussion provided on in.tradingview.com is intended for educational purposes only and should not be relied upon for trading decisions. RK_Charts is not an investment adviser and the information provided here should not be taken as professional investment advice. Before buying or selling any investments, securities, or precious metals, it is recommended that you conduct your own due diligence. RK_Charts does not share in your profits and will not take responsibility for any losses you may incur. So Please Consult your financial advisor before trading or investing.

TvsmotorTvsmotor profit booking as 3rd wave target near 1.61% nearly achieved.
consolidation possible near 1320 -15 possible
note : views are for educational purpose
market is subject to risk

BANKNIFTY, Ending Diagonal with Elliott wave theoryBANKNIFTY
Ending diagonal
elliottwave
possible next move could be correction abc

IOC might be wave in wave 3 | Swing TradeIOC min target 1 if breaks 91.4 with stop loss given in chart.
Stock looks to be in wave 3 with should be 100% of wave 1 and more than 100% if extended.
Disclaimer : Not an investment or trading advice. Please do your own research and analysis before putting money.

Apollo Hospitals possible Elliot wave countsHello Friends,
Here we had shared possible Elliott wave counts of Apollo Hospitals, in which price has given breakout along with good intensity of volumes in daily time frame, as per Elliott wave structure, chart says that either we are in impulse or in correction, in both scenarios we have to go towards north direction first then whatever may be, as per Elliott wave structure, if we are in impulse then we should have to unfold it as wave (1)-(2)-(3)-(4)-(5) in which we already had completed wave (1) and (2) and currently we are unfolding wave (3), and in other scenario, means if we are in correction phase, then we should have to unfold it as wave (A)-(B)-(C) in which we had completed wave (A) and (B), and currently we are unfolding wave (C), So whatever scenario it may be, at least we are first going towards (3) or (C).
In this study whatever major trend may be ahead, at least we can enjoy this little upward bull run as a wave (C) or wave (3)
Now in wave (C) or (3) we have completed wave 1 and 2 and currently we are unfolding wave 3, also in wave 3 we have completed wave (i) and (ii) and currently we are unfolding wave (iii).
Overall, we are in (iii) of 3 of (C) or (3).
I am not sebi registered analyst. My studies are for educational purpose only. Please Consult your financial advisor before trading or investing. I am not responsible for any kinds of your profits and your losses.
Some significant snapshots are shared below, please go throughout.
Thanks
RK💕
Price has given Breakout along with good intensity of volume and RK's Magical cloud suggests same bullish bias in daily
Price above daily upper band
Price above weekly upper band
MACD in daily positive
MACD in weekly positive along with breakout in histogram
RSI positive above 60+ in daily
DMI ADX positive in daily
DMI ADX positive in weekly
Most investors treat trading as a hobby because they have a full-time job doing something else.
However, If you treat trading like a business, it will pay you like a business.
If you treat like a hobby, hobbies don't pay, they cost you...!
Disclaimer and Risk Warning.
The analysis and discussion provided on in.tradingview.com is intended for educational purposes only and should not be relied upon for trading decisions. RK_Charts is not an investment adviser and the information provided here should not be taken as professional investment advice. Before buying or selling any investments, securities, or precious metals, it is recommended that you conduct your own due diligence. RK_Charts does not share in your profits and will not take responsibility for any losses you may incur. So Please Consult your financial advisor before trading or investing.

EXPANDED / IRREGULAR FLAT CORRECTIONHello Friends,
Here we had shared some major points and characteristics of Expanded Flat Correction also known as Irregular Flat Correction in Elliott waves.
Principles of Irregular / Expanded Flat correction pattern
1) 3 waves corrective pattern which is labelled as A-B-C
2) Subdivision of wave A and B are in 3-3 waves
3) Subdivision of wave C is in 5 waves
4) Wave B of the 3-3-5 pattern completes beyond the starting level of wave A
5) Wave C completes beyond the ending level of wave A
Fibonacci measurements
Wave B is always 123.6% to 138.2% of measurement of wave A
Wave C completes at least 123.6% to 161.8% of wave A which starts from end of wave B
I am not sebi registered analyst.
My studies are for educational purpose only.
Please Consult your financial advisor before trading or investing.
I am not responsible for any kinds of your profits and your losses.
Hope this post is helpful to community
Thanks
RK💕
Most investors treat trading as a hobby because they have a full-time job doing something else.
However, If you treat trading like a business, it will pay you like a business.
If you treat like a hobby, hobbies don't pay, they cost you...!
Disclaimer and Risk Warning.
The analysis and discussion provided on in.tradingview.com is intended for educational purposes only and should not be relied upon for trading decisions. RK_Charts is not an investment adviser and the information provided here should not be taken as professional investment advice. Before buying or selling any investments, securities, or precious metals, it is recommended that you conduct your own due diligence. RK_Charts does not share in your profits and will not take responsibility for any losses you may incur. So Please Consult your financial advisor before trading or investing.

SOMICONVEYOR Elliott wave counts along with cup n handle Hello Friends,
Here we had shared possible Elliott wave counts on SOMI CONVEYOR BELT in which wave structure is clearly indicating impulse up move ahead, along with cup and handle chart pattern breakout, which is itself a fresh bullish signal.
I am not sebi registered analyst.
My studies are for educational purpose only.
Please Consult your financial advisor before trading or investing.
I am not responsible for any kinds of your profits and your losses.
Most investors treat trading as a hobby because they have a full-time job doing something else.
However, If you treat trading like a business, it will pay you like a business.
If you treat like a hobby, hobbies don't pay, they cost you...!
Disclaimer and Risk Warning.
The analysis and discussion provided on in.tradingview.com is intended for educational purposes only and should not be relied upon for trading decisions. RK_Charts is not an investment adviser and the information provided here should not be taken as professional investment advice. Before buying or selling any investments, securities, or precious metals, it is recommended that you conduct your own due diligence. RK_Charts does not share in your profits and will not take responsibility for any losses you may incur. So Please Consult your financial advisor before trading or investing.

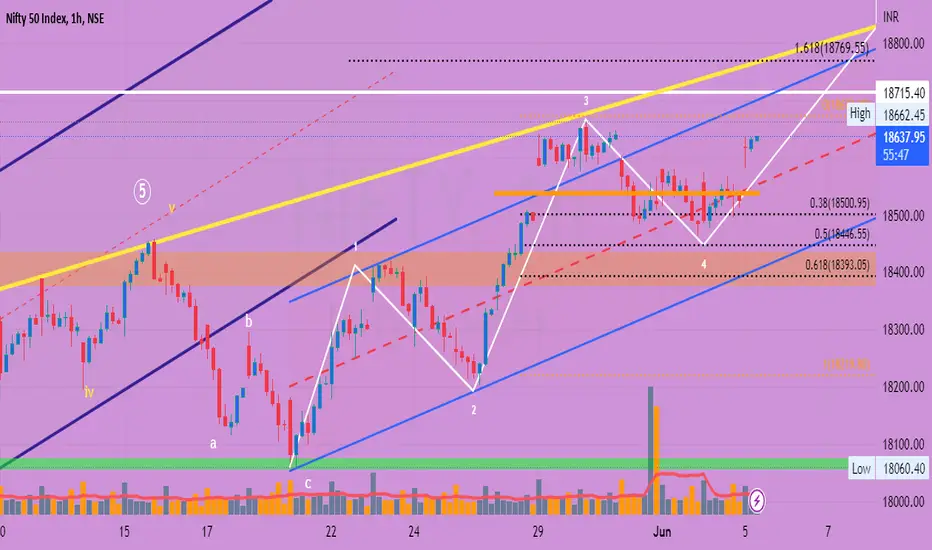
nifty 38% fib correction done#nifty50 hourly chart: NOW 18422-500 is the support zone being (astro &psychological level)..
38% retracement done.
power of control is at 18540 ...
"buy on dip" mode
RBLBANK possible Elliott wave countsHello Friends,
Here we had shared possible Elliott wave counts of RBLBANK, which is suggesting Bullish bias ahead, and chart itself says everything, some significant snapshots are shared below, you can go throughout.
Thanks
Elliott wave counts on chart
Breakout with good intensity of volumes on daily chart
MACD positive crossover in daily chart
MACD uptick and near to positive crossover in weekly chart
RSI uptick and above 60+ in daily chart
Price above upper bands in daily
RK's Mass psychological cloud suggesting bullish bias
DMI ADX i positive in daily
I am not sebi registered analyst.
My studies are for educational purpose only.
Please Consult your financial advisor before trading or investing.
I am not responsible for any kinds of your profits and your losses.
Most investors treat trading as a hobby because they have a full-time job doing something else.
However, If you treat trading like a business, it will pay you like a business.
If you treat like a hobby, hobbies don't pay, they cost you...!
Disclaimer and Risk Warning.
The analysis and discussion provided on in.tradingview.com/u/RK_Charts/ is intended for educational purposes only and should not be relied upon for trading decisions. RK_Charts is not an investment adviser and the information provided here should not be taken as professional investment advice. Before buying or selling any investments, securities, or precious metals, it is recommended that you conduct your own due diligence. RK_Charts does not share in your profits and will not take responsibility for any losses you may incur. So Please Consult your financial advisor before trading or investing.

Tata Motors wave 3 of 5 Self explanatory elliot wave chart if breaks previous swing high it will reach min. 550.
Alternatively it can wave X of WXY with W being flat but less possibility. Tomorrow open will decide whether it will go to 550 or again test 510-500

NIFTY50hello traders...
this is a intro post...
keep support & follow for more such amazing chart pattern analysis on live market...

What is Happening in Banknifty?BN has recently broken out it's life-time high and went higher at around 44500 by making a minor wave of last 5th wave. And, now it is correcting and reached almost 61.8% of its correction. I would expect it to recover from this zone. Or if it can't hold this level, it can go further down and bounch back from 70.7% fib level and the trendline.(very likely)
Anytime BN can start it's minor 3rd wave of major 5th wave. So, stay tunned to see facinating move up above 44000 level. What would you feel? Is it go up or down further?

MRF possible Elliott wave countsHello Friends,
Here we had shared possible Elliott wave counts of MRF chart, in which we can say that currently we are near to make one more top as a wave 5, so any dip could be used as an opportunity to go long with strict invalidation level of 95164, which is stoploss level of current view.
Thanks
I am not sebi registered analyst.
My studies are for educational purpose only.
Please Consult your financial advisor before trading or investing.
I am not responsible for any kinds of your profits and your losses.
Most investors treat trading as a hobby because they have a full-time job doing something else.
However, If you treat trading like a business, it will pay you like a business.
If you treat like a hobby, hobbies don't pay, they cost you...!
Disclaimer and Risk Warning.
The analysis and discussion provided on in.tradingview.com is intended for educational purposes only and should not be relied upon for trading decisions. RK_Charts is not an investment adviser and the information provided here should not be taken as professional investment advice. Before buying or selling any investments, securities, or precious metals, it is recommended that you conduct your own due diligence. RK_Charts does not share in your profits and will not take responsibility for any losses you may incur. So Please Consult your financial advisor before trading or investing.

BALUSDT can bounce on Elliot wave CBALUSDT can bounce on Elliot wave C or on 4hr orderblock BINANCE:BALUSDT.P

nifty crossed hurdle 18422-18500 after lot of struggle nifty crossed hurdle of 18422(astro level) & 18500 (psychological level).. now this will act as support..
and upside hurdle of trendline confluence 18720
play support resistance...

BankNifty is going higher.What will be it's next move?BN is rising higher after making yesterday's low of 43390 which was probably a A-B-C correction of 3rd wave move forming the end of 4th wave. Though it's not corrected as I expected for 43000 level (approx 23.6% of normal correction of 3rd wave), it has actually corrected as per wave theory where C=A and B went near about top of A. So, it's correction has completed and we would expect it to cross it's life-time high of 44152 in coming days, may be start of next week.
Thank you for viewing my analysis and agreed with me. Market is frequently changing its move and wave structure. Market is supreme and so we need to change our view frequently.

reliance industries immediate hurdle 2495-2500#reliance immediate hurdle 2495 -2500 (astro level).. above that 2585
if sustains above this level than more upsides..

VEDL:Trend Continuation + Elliott (ABCDE) Correction Triangle.NSE:VEDL
Vedanta Ltd. has been in a consolidation zone for more than 2.5 months after a bearish trend and there is also 5 waves correction triangle is forming.
Some more confirmation is mentioned below:-
1. The price will face resistance of the 200 EMA zone.
2. The volume is not supporting the Up movement the volume is declining and the price is increasing this is a sign of weakness in the up move.
3. Previous bear trend + consolidation triangle most likely a second leg down to the down.
Multiple resistance on the upside gets a better chance to short instead of going long.
:-Entry should be based on some reversal candle on the respected chart of 4 hour and break of that signal candle.
:-Stop loss should be above some points of a resistance Zone.
I hope you like the idea.
please like and comment with your views on this idea.
Keep learning,
Happy trading.
Thank you for reading.

banknifty future "sell on rise" mode#bankniftyfuture hourly chart: abc correction on .. of which wave c on..
1st sign of weakness is given... broken down the rising channel.. hurdle 44000
"sell on rise " mode
