FORCE MOTORS possible Elliot wave countsHere we had shared today possible Elliot wave counts of Force Motors ltd, on daily time frame, as per Elliot wave structure its clearly showing that we are in correction phase after impulse started from bottom of pandemic period of march 2020 and completed wave 1 till swing high of November 2021, well, if this phase was a fresh impulse as a wave 1, then currently we are in correction phase which had been unfolded as a zigzag pattern 5-3-5 subdivisions like (A)-(B) and now possibly we are in wave C, where we can say that of bigger degree wave 2 will be completed along with wave (C), now wave (C) should unfold in 5 subdivisions, in which we had completed wave 1 and now possibly we can retrace wave 2 as a contra trend. currently it may go bit upside as wave (a) - (b) and (c) inside of wave 2, which should not cross high of 1585 levels, and may turn down again to complete wave 3 - 4 and 5 of wave (C) of bigger degree wave 2.
On completion of wave 2 one can go long in this with invalidation level of 591 for targets above 1700 - 1800 and more.
In both upside and down side invalidation levels are mentioned on chart, if they breaches then we can assume that our study is missing something.
Thanks.
Most investors treat trading as a hobby because they have a full-time job doing something else.
However, If you treat trading like a business, it will pay you like a business.
If you treat like a hobby, hobbies don't pay, they cost you...!
Disclaimer.
I am not sebi registered analyst.
My studies are for educational purpose only.
Please Consult your financial advisor before trading or investing.
I am not responsible for any kinds of your profits and your losses.
Elliotwavecount


BANKNIFTY possible Elliott wave counts (now up then down)Hello Friends,
Hope you are doing well,
Today we are sharing banknifty possible Elliott wave counts along with invalidation levels and along with alternate wave counts, which can be overall road map for next moves expected further, in both current and alternate counts banknifty is looking good short candidate but only after some rally it means it looks like sell on rise along with strict stoploss of invalidation levels only, so it may go up side first then good move towards south is expected.
Our studies are only for educational purposes and not for trading purposes so we are not responsible for any kind of profits or losses in trading or in investing in market, so always please consult your financial advisor before trading or investing, do read disclaimer.
Thanks
Most investors treat trading as a hobby because they have a full-time job doing something else.
However, If you treat trading like a business, it will pay you like a business. If you treat like a hobby, hobbies don't pay, they cost you...!
Disclaimer.
I am not sebi registered analyst.
My studies are for educational purpose only.
Please Consult your financial advisor before trading or investing.
I am not responsible for any kinds of your profits and your losses.

Banknifty's Short-term Analysis on 15 Min ChartBN may remain range-bound today unless it breaks above 40725 or the day's high and breaks below 38.2% correction

Nifty spot Possible Elliot wave countsHere we have plotted possible Elliott wave counts of Nifty spot chart on hourly time frame, we are assuming equality level of (W) and (Y) near 16600 levels.
Currently we are unfolding wave (Y) in which we are still in wave v of wave A near yet to complete, post wave A we are assuming to start wave B, which can just be counter trend rally, and also it can generate new opportunity to short fresh positions on completion of wave B to start fresh fall as wave C of wave (Y).
here we are assuming small rally to complete wave B along with invalidation level of bottom of wave A swing low, and then big fall to complete wave C of wave (Y) along with invalidation level of high of wave B swing high.
I am not sebi registered analyst.
My studies are for educational purpose only.
Please Consult your financial advisor before trading or investing.
I am not responsible for any kinds of your profits and your losses.
Most investors treat trading as a hobby because they have a full-time job doing something else.
However, If you treat trading like a business, it will pay you like a business.
If you treat like a hobby, hobbies don't pay, they cost you...!
Disclaimer.
I am not sebi registered analyst.
My studies are for educational purpose only.
Please Consult your financial advisor before trading or investing.
I am not responsible for any kinds of your profits and your losses.

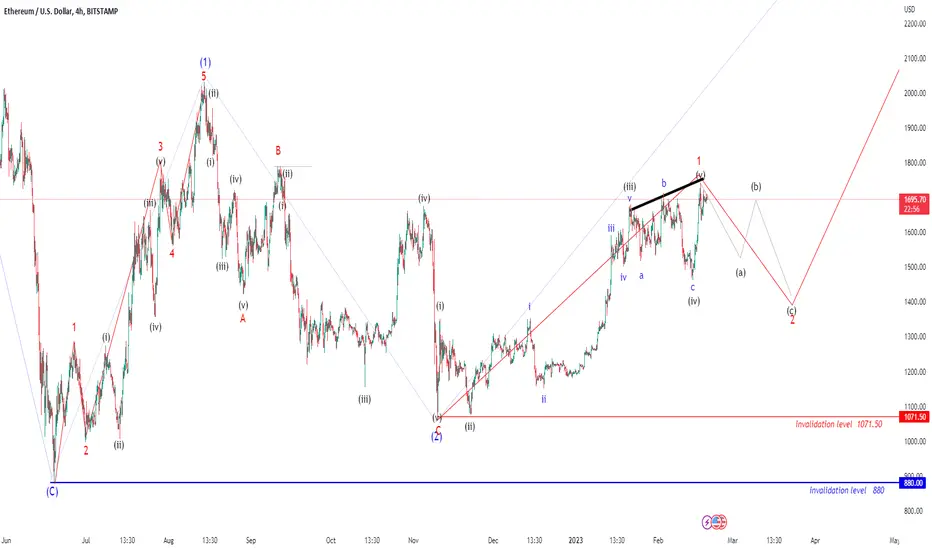
Ethereum possible Elliot wave counts Here we have shared possible Elliot wave counts of ETHUSD (for educational purpose only) which are suggesting correction for very short term and this correction can be used as good opportunity to go long for further trend which is expected post this correction, the invalidation level of further up move can be low of previous wave 1 which is pegged at 1071.50, if it breaks below this level then we can assume that our counting is missing something and we may invalidate this structure, Overall we are unfolding some impulse in which we had completed wave (1) and now possibly we are heading to unfold wave (2) and then, post correction we can start wave (3). wave (2) can unfold in three subdivisions like ABC and ABC can unfold in 5-3-5 structure or 3-3-5 structure. Lets see what happens next.
My studies are for educational purpose only.
Please Consult your financial advisor before trading or investing.
I am not responsible for any kinds of your profits and your losses.
Overall wave structure is shared below
Most investors treat trading as a hobby because they have a full-time job doing something else.
However, If you treat trading like a business, it will pay you like a business. If you treat like a hobby, hobbies don't pay, they cost you...!
Disclaimer.
I am not sebi registered analyst.
My studies are for educational purpose only.
Please Consult your financial advisor before trading or investing.
I am not responsible for any kinds of your profits and your losses.
USOIL CRUDE OIL possible Elliot wave countsUS OIL is looking good to go long as per Elliot wave structure with invalidation level of below $ 76.50, for target level of near $ 83.05.
My ideas as just for educational purpose only
I am not sebi registered analyst.
My studies are for educational purpose only.
Please Consult your financial advisor before trading or investing.
I am not responsible for any kinds of your profits and your losses.
Most investors treat trading as a hobby because they have a full-time job doing something else.
However, If you treat trading like a business, it will pay you like a business.
If you treat like a hobby, hobbies don't pay, they cost you...!
Disclaimer.
I am not sebi registered analyst.
My studies are for educational purpose only.
Please Consult your financial advisor before trading or investing.
I am not responsible for any kinds of your profits and your losses.

Info share Elliot wave Analysisthis stock all time high correct 5 wave . if any stock ya price go down 5 wave indicate zig zag correction and price move upside corrective wave A,b,c and price again go down 5 wave

TVS MOTORS possible Elliot wave countsHere we have shared possible Elliot wave counts of tvs motors, just for educational purpose, on monthly, weekly, daily and hourly time frames, all aligned with each other, so here we are getting both side confirmation levels for next possible moves.
Most investors treat trading as a hobby because they have a full-time job doing something else.
However, If you treat trading like a business, it will pay you like a business.
If you treat like a hobby, hobbies don't pay, they cost you...!
Disclaimer.
I am not sebi registered analyst.
My studies are for educational purpose only.
Please Consult your financial advisor before trading or investing.
I am not responsible for any kinds of your profits and your losses.

Bhel Elliot wave predictionBhel look like ABCDE pattern and expecting range bond for long term
last move trend line break
show week stock..

PAGEIND possible Elliot wave countsThis stock has completed wave 1 of higher degree wave cycle and now definitely we are in correction as wave 2 of same higher degree wave cycle, in which we are unfolding wave A of one degree lower wave cycle, in which possibly we are in wave iii or wave c of one more lower degree, that means possibly we are in wave iii or c of one higher degree wave A of one more higher degree wave 2, so we can unfold correction pattern as zigzag or as a flat or as an expanded flat as well. This post is not for any types of tips or advisory or any type of trading ideas, this is shared just for educational purpose only
I am not sebi registered analyst. My studies are for educational purpose only. Please Consult your financial advisor before trading or investing.
I am not responsible for any kinds of your profits and your losses.
Most investors treat trading as a hobby because they have a full-time job doing something else.
However, If you treat trading like a business, it will pay you like a business. If you treat like a hobby, hobbies don't pay, they cost you...!
Disclaimer.
I am not sebi registered analyst.
My studies are for educational purpose only.
Please Consult your financial advisor before trading or investing.
I am not responsible for any kinds of your profits and your losses.

Nifty for 10-Feb-2023Disclaimer.
I am not SEBI registered analyst.
My studies are for educational purposes only.
Please Consult your financial advisor before trading or investing.
I am not responsible for any kind of your profits and your losses.

BANKBARODA possible Elliot wave countsThis stock has shown almost aligned wave counts from weekly to daily and from daily to hourly and right now its in correction area of some lower degree wave counts
macd on hourly chart
momentum negative cross done on hourly
Price under and below RK's stopline in daily
Price made neutral candle under and below 20DMA in daily
Most investors treat trading as a hobby because they have a full-time job doing something else.
However, If you treat trading like a business, it will pay you like a business.
If you treat like a hobby, hobbies don't pay, they cost you...!
Disclaimer.
I am not sebi registered analyst.
My studies are for educational purpose only.
Please Consult your financial advisor before trading or investing.
I am not responsible for any kinds of your profits and your losses.

DelhiveryThis stock has given good breakout on daily time frame along with positive divergence in RSI along with macd positive crossover.
Also possible Elliott wave counts are suggesting same bias, one can go long with strict stop loss of swing low of 289.90
Overall chart along with possible Elliot wave counts
macd positive
rsi breakout and rsi positive divergence
Most investors treat trading as a hobby because they have a full-time job doing something else.
However, If you treat trading like a business, it will pay you like a business.
If you treat like a hobby, hobbies don't pay, they cost you...!
Disclaimer.
I am not sebi registered analyst.
My studies are for educational purpose only.
Please Consult your financial advisor before trading or investing.
I am not responsible for any kinds of your profits and your losses.

USDINR multi time frame aligned Elliott wave counts analysisUSDINR possible and aligned Elliott wave structure of multi time frames from monthly to hourly.
Monthly chart
Weekly chart
Daily chart
4 Hourly chart
1 Hourly chart
Most investors treat trading as a hobby because they have a full-time job doing something else.
However, If you treat trading like a business, it will pay you like a business.
If you treat like a hobby, hobbies don't pay, they cost you...!
Disclaimer.
I am not sebi registered analyst.
My studies are for educational purpose only.
Please Consult your financial advisor before trading or investing.
I am not responsible for any kinds of your profits and your losses.

Unbroken rules of impulsive waves Elliott
Elliott wave
Unbroken rules of impulsive waves
It would help you to check whether Any index or stock are in impulsive move or in correction phase.
Simple but the basic rules.
Simple method will improve your view towards market. Watch and learn.

Skipper ltdSkipper ltd, this stock is looking in good momentum on daily, weekly, and on monthly too, along with cup and handle chart pattern breakout along with good intensity of volumes too, also wave structure is suggesting bullish bias at the same time, one can go long at current levels and can add more in dips (if any), overall, its looking good candidate for longs.
Whole scenario chart pattern and breakout
Trendline breakout along with price challenging upper bollinger band in daily
RK's Magic Buy Signal along with RK's Mass psychological Cloud also suggesting positive bias ahead
wave structure is also suggesting bullish ahead
Weekly upper band challenged
Monthly upper band challenged
Macd in daily positive uptick
Macd in weekly positive uptick
Macd in monthly positive crossover and uptick
Rsi in daily positive uptick
RSI in weekly positive uptick also breakout
dmi adx positive in daily time frame
dmi adx positive in weekly time frame
dmi adx positive in monthly time frame
Most investors treat trading as a hobby because they have a full-time job doing something else.
However, If you treat trading like a business, it will pay you like a business.
If you treat like a hobby, hobbies don't pay, they cost you...!
Disclaimer.
I am not sebi registered analyst.
My studies are for educational purpose only.
Please Consult your financial advisor before trading or investing.
I am not responsible for any kinds of your profits and your losses.

Apollo tyresApollo tyres, is looking currently in good momentum upside, it has broken resistance trendline along with good intensity of volumes along with challenging upper Bollinger band, also trend indicator macd is supporting same trend right now.
As per Elliott wave projection it shows possibly we are in wave 3rd of wave 5th on daily time frame, which is a cautious sign to be ready for profit booking phase in near term and be very alert to book profits at near targets, also RK's mass psychological indicator is suggesting to go long, some highlights are shared below one can go through them to understand this study.
wave structure possibilities on daily chart
RK's mass psychological indicator signals positive
chart pattern breakout with good volumes
macd in daily positive crossover above zero line
macd running positive in weekly
rsi breakout in daily and its uptick above 60
price challenging upper bands on daily chart
dmi adx positive strenght
Most investors treat trading as a hobby because they have a full-time job doing something else.
However, If you treat trading like a business, it will pay you like a business. If you treat like a hobby, hobbies don't pay, they cost you...!
Disclaimer.
I am not sebi registered analyst.
My studies are for educational purpose only.
Please Consult your financial advisor before trading or investing.
I am not responsible for any kinds of your profits and your losses.

SAIL steel author India possible Elliot wave countsTrend indicator macd for SAIL is turned negative now on daily time frame, also with price closed below 20DMA along with follow up seen in today's session,
price retraced up to 50% Fibonacci level of recent fall and turned back towards south. Also, possible Elliot wave counts are suggesting correction is pending ahead, if our counts are going correct then price can unfold wave C of wave Y of wave 2, then we can assume for target of 50 where wave C would be equal to wave A, fingers crossed, on the way upside 88 is an invalidation level for current view.
Possible wave counts on daily chart
Retraced 50% of recent fall
Price closed below 20DMA with followed up
Weekly upper band pressuring down, once it close below 20WMA then more bearish
20WMA is now crucial support level, once it breaks then more bearish
MACD in daily negative crossover
RSI in daily is down tick and below 50
RSI in hourly is below 40
Most investors treat trading as a hobby because they have a full-time job doing something else.
However, If you treat trading like a business, it will pay you like a business.
If you treat like a hobby, hobbies don't pay, they cost you...!
Disclaimer.
I am not sebi registered analyst.
My studies are for educational purpose only.
Please Consult your financial advisor before trading or investing.
I am not responsible for any kinds of your profits and your losses.

US OIL ELLIOT WAVE COUNTS AND BREAKOUTCrude oil is looking Bullish ahead Reasons are mentioned below
Inverted head n shoulder Neckline Breakout
Price taking support from RK's Mass psychological cloud and RK's stopline in daily time frame
Possible wave counts on weekly chart
Possible wave counts on Daily chart
Possible wave counts on 4 hourly
Possible wave counts on 1 hourly
Price challenging upper band on daily time frame
macd positive cross in daily time frame
macd converging towards north uptick in weekly time frame
RSI uptick above 60 in daily time frame
DMI ADX positive uptick in daily time frame
Price closed above 50dema, 100dema & 200dema
Weekly close above 20WEMA, its also above 50 WEMA, 100 WEMA & 200 WEMA.
Most investors treat trading as a hobby because they have a full-time job doing something else.
However, If you treat trading like a business, it will pay you like a business. If you treat like a hobby, hobbies don't pay, they cost you...!
Disclaimer.
I am not sebi registered analyst.
My studies are for educational purpose only.
Please Consult your financial advisor before trading or investing.
I am not responsible for any kinds of your profits and your losses.

US Dollar Index - are we ready for new all time high ?US Dollar index has recently completed his fall of wave 4 inside the bigger degree wave 3, and now possibly wave 5 has been started of bigger degree wave 3, Inside 5 it has completed wave 1 and wave 2 of 5, and possibly started to unfold smaller degree wave 1 of 3 of 5, now should retrace as wave 2 of 3 of 5, it would be a buying opportunity with invalidation level of 111.9040, One can go long in dip of wave 2, or can go long on breakout above wave 1's high, in both scenarios stop loss could be same as invalidation level 111.9040, which is nothing but low of wave 1, because as per waves principle wave 2 will never retraces 100% of wave 1.In 1 hour time frame RK's Mass psychological cloud is suggesting to go long only, Because it's above cloud, so don't go short.
possible wave counts on 1 hourly chart
possible wave counts on 4 hourly chart
possible wave counts on Daily chart
RK's Mass Psychological cloud in 4 hour
RK's Mass Psychological cloud in 1 hour
Most investors treat trading as a hobby because they have a full-time job doing something else.
However, If you treat trading like a business, it will pay you like a business. If you treat like a hobby, hobbies don't pay, they cost you...!
Disclaimer.
I am not sebi registered analyst.
My studies are for educational purpose only.
Please Consult your financial advisor before trading or investing.
I am not responsible for any kinds of your profits and your losses.

Natural Gas Possible Elliot wave countsNatural Gas, wave 2 of some lower degree is possible completed now, and now at same degree wave 3 may unfold next, with invalidation level of wave 1's low, which is pegged at $ 6.426
If it breaks low of wave 1 ($ 6.426) then it may be invalidate our current bias.
Most investors treat trading as a hobby because they have a full-time job doing something else.
However, If you treat trading like a business, it will pay you like a business.
If you treat like a hobby, hobbies don't pay, they cost you...!
Disclaimer.
I am not sebi registered analyst.
My studies are for educational purpose only.
Please Consult your financial advisor before trading or investing.
I am not responsible for any kinds of your profits and your losses.
NLong

Natural Gas Looking good to go longNatural Gas is looking good to go long as per wave structures suggesting impulse to unfold, with invalidation levels of $ 6.725.
RK's mass psychological cloud is also suggesting positive ahead, along with macd positive support.
Natural gas had given trendline breakout along with good intensity of volumes on hourly chart.
After positive divergence, breakout with good intensity of volume
Overall wave counts
Double positive Divergences
MACD in hourly positive and now above zero line
MACD in 4 hourly positive crossover and uptick.
RSI in hourly above 60.
Most investors treat trading as a hobby because they have a full-time job doing something else.
However, If you treat trading like a business, it will pay you like a business. If you treat like a hobby, hobbies don't pay, they cost you...!
Disclaimer.
I am not sebi registered analyst.
My studies are for educational purpose only.
Please Consult your financial advisor before trading or investing.
I am not responsible for any kinds of your profits and your losses.
NLong
