BAJAJ AUTO LONG SETUPLogic: BAJAJ AUTO is creating an up flag pattern on the weekly, followed by uptrend on the Daily.
The marked demand is strong setup.
Inspite of the fact that a stronger zone exist below that zone, but with understanding that if prices retrace into the below level the strength might be lost for an upmove.
The zone also is near 21 DEMA level.
Hence considering that and keeping strict SL below the marked level of atleast 10%DATR, long opportunities can be seen.
EMAS

BEL I think here it create small strong base ,with good accumulation volume
Comapare to nifty 50 index stock more strong ,
Here risk 6% if price 1day close below 392 exit .
Target 20% after 50% book half trailing with ema

Buy, Sell, Retest or Sit Out? | Ep. 1 – Trade Decision SeriesCharts in this video are over 3 months old. This is for educational purposes only, using TradingView’s replay feature to demonstrate strategy thinking and decision-making. Not financial advice.

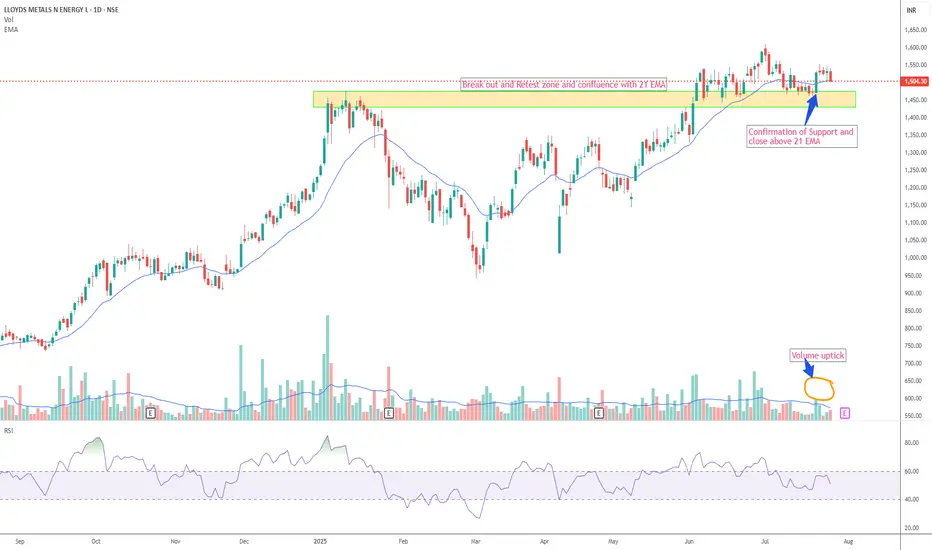
LLOYDSME – Breakout Retest with 21 EMA ConfluenceAs part of my personal trading strategy, I am closely watching LLOYDSME, which is currently retesting a recent breakout zone and hovering near a key support level. This area also coincides with the 21 EMA on the daily chart, adding to the technical confluence.
I am considering a long position if the price action confirms support at this level, in line with my predefined risk management rules. From my perspective, the current chart structure offers a potentially favorable risk-reward setup, with scope for upward movement if the retest holds.
Disclaimer
This analysis reflects my personal views and is shared for educational and informational purposes only. It does not constitute investment advice or a recommendation. I am not a SEBI-registered investment advisor. Please consult a qualified financial advisor and do your own due diligence before making any investment decisions.
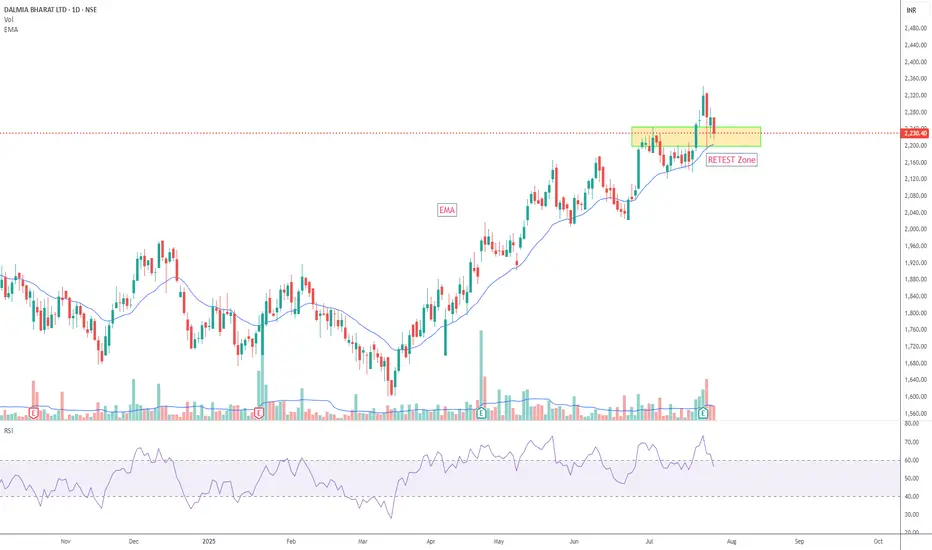
DALBHARAT Retesting Breakout Zone Near 21 EMAThe stock DALBHARAT is currently testing the breakout region between ₹2200–₹2250, which aligns with the 21 EMA — a potential confluence zone.
Traders may observe price action near this level for signs of a bounce. If the retest holds, there could be scope for upward movement toward previous highs.
Note: The risk-reward setup appears favorable based on current chart structure.
Disclaimer
This is a personal technical analysis and not a recommendation to buy or sell any securities. Please do your own research or consult a SEBI-registered investment advisor before making any investment decisions. Trading in financial markets involves risk.
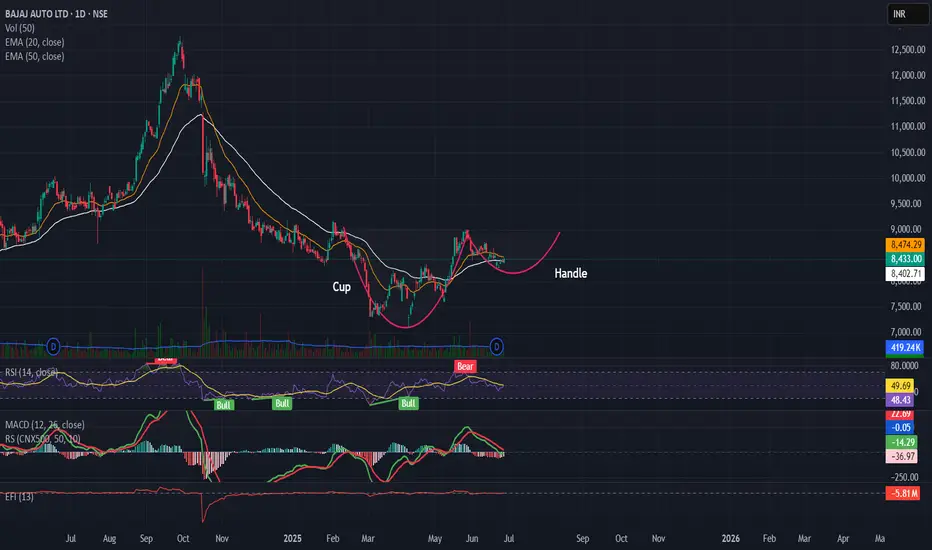
Cup and Handle Pattern in the makingAfter a 9 month long downtrend Bajaj Auto shows signs of reversal with a Cup and Handle pattern in the making with neckline breakout level at 9000
The stock trading close to the 20 and 50 EMA
RSI closing 50
MACD begins to stabalize
Target 11000
stoploss 8250
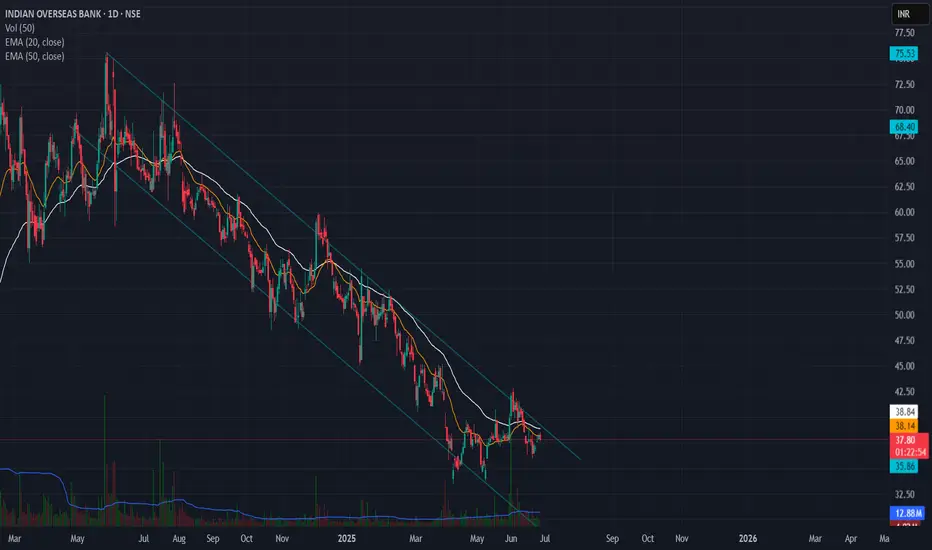
Falling Channel Pattern in Indian Overseas Bank📉 IOB (Indian Overseas Bank) - Falling Channel Setup
🔍 Daily Chart Analysis – June 26, 2025
IOB has been trading within a well-defined falling channel since early 2024. Price is currently testing the upper boundary of the channel but hasn’t confirmed a breakout yet.
🔑 Key Observations:
Structure: Clearly respecting the falling channel.
Moving Averages: Price is hovering around short-term EMAs (20 & 50) and below the both EMA, indicating weak momentum.
Volume: No significant volume surge yet to support a breakout.
Confirmation needed: A close above the trendline (~₹39–40) with volume would be an early sign of bullish reversal.
🎯 Watch for:
Breakout above ₹40 with increased volume = potential short-term rally.
Failure to break may result in retesting lower channel support near ₹33–34.
🧠 Adding this to my breakout watchlist. Will reassess if it closes outside the channel.
CANFINHOME - Higher Highs & Higher LowsCANFINHOME is making HH-HL formation.
Now giving breakout of resistance, moving above 20ema, RSI is also looking strong.
There is probability of an upside move, looks good above 759.
✅ If you like my analysis, please follow me as a token of appreciation :)
in.tradingview.com/u/SatpalS/
📌 For learning and educational purposes only, not a recommendation. Please consult your financial advisor before investing.

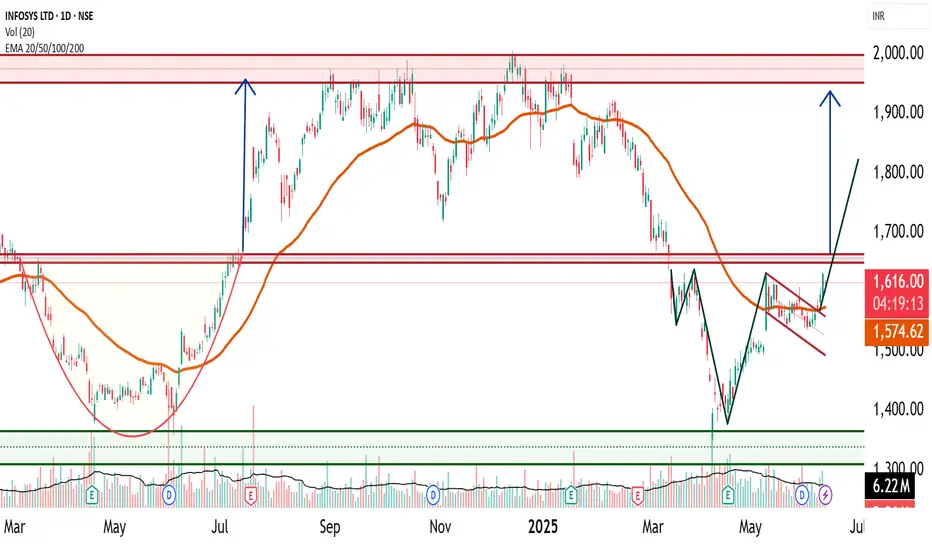
Infosys Technical Research- Flag and Head and shoulders🔍 1. Infosys Current Price Range and Key Levels
Since January 2021, Infosys has been trading in a broad range between ₹1300 and ₹2000, consolidating for over 4 years. Within this range, there are three key support and resistance levels to watch closely:
Support: ₹1300 (major floor)
Intermediate Resistance/Support Zone: ₹1600 – ₹1650
Strong Resistance: ₹2000 (upper bound)
📈 2. Bullish Flag Pattern: A Bullish Flag is a continuation pattern that forms after a strong upward price move "flagpole" , followed by a period of consolidation in a narrow downward or sideways channel "flag". It typically signals a pause before the uptrend resumes.
📊 2. Infosys Recent Technical Development
Infosys recently broke out of a bullish flag pattern and crossed above ₹1580 with a strong closing on higher volume, indicating renewed buying interest.
Price is currently trading above the 50-day Exponential Moving Average (EMA), confirming the continuation of the mid-term uptrend.
However, the zone around ₹1650 remains a strong and key resistance level to monitor closely.
🧩 3. Potential Bullish Head and Shoulders Pattern Above ₹1650
Should Infosys break decisively above ₹1650, it is likely to form another significant bullish pattern known as the Bullish Head and Shoulders (Inverse Head and Shoulders).
Bullish Head and Shoulders
This pattern signals a trend reversal from bearish to bullish and is considered highly reliable.
Trend: Appears after a downtrend or consolidation, signaling reversal
Touchpoints: Three lows – left shoulder, head (lowest point), and right shoulder, roughly at similar levels
Neckline: The resistance line connecting the highs between shoulders and head
Timeframe: Medium-term, often forming over weeks up to 6 months
Volume: Typically higher volume on left shoulder and head formation, volume dips on right shoulder, and surges on breakout
⚠️ 4. Key Concerns in Infosys Chart Pattern
Price-Volume Divergence: During the head formation, volume increased sharply as price fell — indicating strong selling pressure. However, volume was low when price approached the neckline — suggesting weak buying interest to confirm breakout. This divergence signals potential caution.
Resistance Zone: Price remains below the key resistance at ₹1650, which has acted as a ceiling multiple times. A decisive breakout is required to sustain further upside momentum.
⚠️ Disclaimer
This report is intended solely for educational and training purposes and does not constitute investment advice. Traders and investors should conduct their own research and consult financial advisors before making trading decisions.
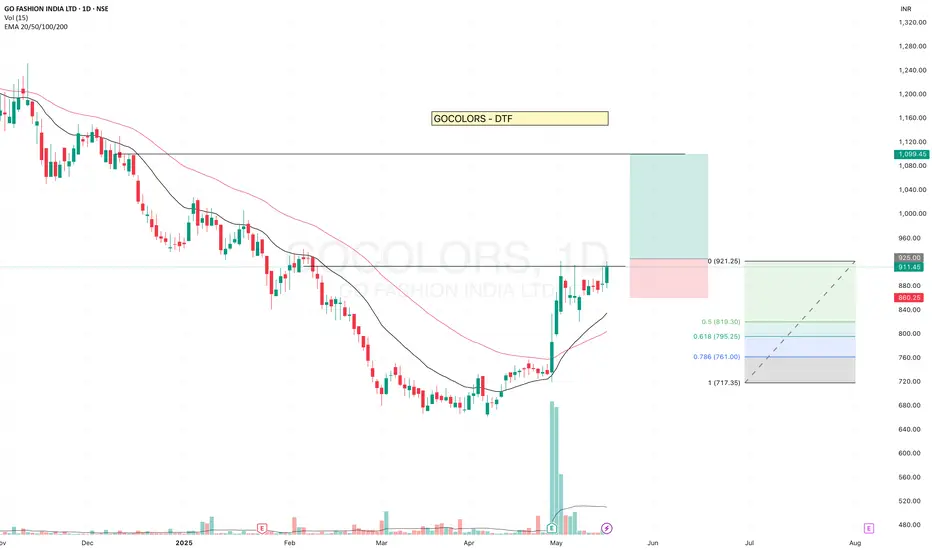
GOCOLORS - Getting ReadyGOCOLORS is getting ready and has been testing the resistance level.
- It is consistently trading above the 20 EMA. Recent high-volume candles suggest clear institutional participation. Although volume is currently drying up, the price is sustaining — a positive sign.
- The stock reversed after touching the 0.5 Fibonacci retracement level, indicating strength.
✅ If you like my analysis, please follow me as a token of appreciation :)
in.tradingview.com/u/SatpalS/
📌 For learning and educational purposes only, not a recommendation. Please consult your financial advisor before investing.
ETH/USD | Short Setup at 288‐Period EMA ConfluenceEthereum has been grinding higher into a well‑defined supply zone between $1,625 – $1,635, which also coincides with the 288‑hour EMA (currently ≈1,623). This area has acted as resistance on multiple occasions, making it a prime spot for a short entry on signs of rejection (bearish engulf, high‑volume wick, etc.). Our initial profit target is the demand region around $1,555 – $1,565, where buyers have previously stepped in, with a conservative stop placed just above the EMA/supply zone. A clean turn lower from here could carry price all the way back to the key support at $1,547. Watch for increasing selling volume and a rejection candle before committing. Good risk‑reward and clear levels make this an attractive opportunity.

COAL INDIA - Levels1. Trend Analysis
The stock (Coal India Ltd) had a strong uptrend from mid-2023 to early 2024. However, since reaching a peak around 544 INR, it has been in a clear downtrend, making lower highs and lower lows.
Currently, the stock is consolidating around the Fibonacci 0.618 level (348.50 INR), which is a crucial support level.
2. Fibonacci Retracement Levels
The stock has retraced from its peak and is now hovering near the 0.618 Fibonacci retracement level (348.50 INR). If this level holds, there could be a possible bounce. If the price breaks below 348 INR, the next key support is at 0.786 Fibonacci level (295.35 INR).
3. Exponential Moving Averages (EMA)
The stock is trading below both short-term and long-term EMAs, indicating bearish momentum. The short-term EMA (red line) is sloping downward, reinforcing the ongoing selling pressure. The longer-term EMA (blue line) is far below the price, acting as major support in the 300-320 INR zone.
4. Volume Analysis
The volume bars indicate declining interest, with some spikes during down moves, suggesting distribution. If a reversal is to happen, it needs strong buying volume confirmation.
Conclusion
Bearish Bias: The stock is in a downtrend and trading below key EMAs.
Support Levels: Watch 348 INR (0.618 Fibonacci) and 295 INR (0.786 Fibonacci).
Resistance Levels: If the stock bounces, first resistance is at 385 INR (0.5 Fibonacci) and stronger resistance near 423 INR (0.382 Fibonacci).
Watch for Volume: A bullish reversal needs an increase in volume near support.
Entry and Exit Points for Coal India Ltd
Entry Points (Buying)
Near 348 INR (0.618 Fibonacci level)
If the price holds above 348 INR and shows bullish price action (strong green candle, bullish engulfing, or a hammer pattern).
Confirmation with increased volume is necessary.
Stop-loss: Below 340 INR to limit downside risk.
If the price drops to 295 INR (0.786 Fibonacci level)
This is a stronger support level where the stock could find buyers.
Watch for bullish reversal signals and volume confirmation.
Stop-loss: Below 285 INR if support fails.
Exit Points (Selling)
First Resistance: 385 INR (0.5 Fibonacci level)
Partial profit booking if the stock bounces from current levels.
Second Resistance: 423 INR (0.382 Fibonacci level)
Stronger resistance level, suitable for further profit-taking if momentum sustains.
469 INR (0.236 Fibonacci level) – Longer-term target
If the stock enters a full uptrend again, this could be a potential higher target.
Risk-Reward Setup
Buying near 348 INR with a target of 385 INR gives a risk-reward ratio of approximately 1:2. If entering around 295 INR, a move back to 348 INR provides a higher risk-reward setup.

TNPL: A 20% Potential GainFollowing a prolonged downtrend lasting six months, TNPL has successfully closed above both the 20-day and 50-day EMAs. This deviation from the recent trend, coupled with a noticeable increase in trading volume observed on the daily chart, signals a potential reversal in market sentiment.
Based on historical analysis, a closing price above the 50-day EMA typically indicates strong bullish potential, especially when the 50-day EMA is below both the 100-day and 200-day EMAs. In such scenarios, it is not uncommon for stocks to experience upward movements of approximately 20% .
Current market conditions for TNPL appear favorable at the CMP . My analysis suggests that the next resistance level is positioned at approximately 240 . For risk management purposes, I recommend setting a stop-loss around 171 to protect against potential downside risk.
Disclaimer: The information contained in this technical analysis report is intended solely for informational and educational purposes. It should not be interpreted as financial advice or a recommendation to buy or sell any security. Investors are strongly encouraged to conduct their own research and consult with a qualified financial advisor before making any investment decisions.

Entry at SupportThis trade is based on Exponential Moving Average (9 &15) considered in the Weekly Time Frame.
A trade can start at the current level (Entry between 795 to 780). Maximum risk to be considered is 5% to 6%. However a strong Candle closing below 740 level will indicate EXIT from the trade.
The stock can show upward movement as below:
1) 1st Target is 20% from current level
2) 2nd Target is 30% from current level
3) 4th Target is 50% from current level .
**All targets to be observed in Weekly time frame**

Detailed Technical Analysis of SJVN LTDKey Observations:
1. Trendline Support: The stock is rebounding from a major trendline support, which also aligns with the support of an upward channel pattern.
2. Volume Activity: There is notable volume action, with current trading volumes being 4-5 times higher than typical daily volumes, indicating strong buying interest.
3. Relative Strength Index (RSI): The RSI is approaching its upper boundary/resistance while the stock price continues to perform well with high volumes.
4. 50-Day Exponential Moving Average (EMA): The stock has decisively bounced off its major support at the 50EMA.
Entry point : An entry point around 140 offers a favorable risk-reward ratio.
Targets:
Target 1: 150, which is the next resistance level.
Target 2: 160, near the all-time high (ATH) zone.

Aditya Birla Capital (ABCapital), one simple line setup-Posted great growth results 🚀
-overall sector strong
-Young stock, came out from long base breakout
-Tightness on daily n weekly timeframe too. (3WTC)
-Good shakeout (50 ema)
-Volumes good too


Electrosteel Castings another water theme related stockElectrosteel Castings (Electcast)
-from Strong Sector
-Clean setup
-Vol kickin in, clearly Grenn vol > Red vol
-Signal candle
-Good shakeout


BTSTBTST for monday 1july as yong trending stock leads to a small correction and b\out...undelay good strong long ema sma support

Data Patterns, a defence and aerospace proxy ready to move?-In a very long base, last time it breakout long base gave 80% move in just 20 days. (always read history of stock how it move, how to form base, how it react to moving averages, how volumes come etc etc)
-from strong sector (sector is always imp as strong sector's stocks move faster)
-Good shakeout and Fake-out also there means kicking weak players by hunting their SLs (stoplosses)
-Inside Bar on latest candle
-Volatility contraction

Thomas Cook, one simple horizontal line setupTraveling is booming in India post covid.
And travel companies are enjoying this piece of pie.
-Posted growth YoY EPS growth, OPM% also improving.
-Near Major resistance, under which it is consolidating for 50 days (good consolidation)
-Good Shakeout, when price went below major ema (here 21 dema) and rally back (also known as MAU&R: Moving Avg Undercut and Rally)
-Tightness near resisantance.
-Signal Candle (5th n 7th June candles are white dot, which is more than 5% move with 1M vol) suggesting big players are buying. Retailer buyers cant create such volumes.
If it breaks this resistance level. with good vol (basically more than 10 day avg) then can expect good move.
No buy/sell recommendations.

Capacite Infra, another good Infra stock-Posted good results
-Why i am liking this setup so much is : Its rejection from 200 ema(yellow line), that means its staying very little in Stage 4, means strong buying by Institutions (Lots of white dots : 5% move with 1M vol)
-Recovered fast from 4th June (election result day) bloodbath, again strong stock sign.
-in Tightness phase (volume drying), needed consolidation as already moved 25-30% from 200 ema
-21 ema slope up
