OIL | Breakout After Triangle ConsolidationThe stock has given a clear breakout after a long consolidation within a triangle pattern. Post breakout, the price action is respecting the breakout level, which indicates strength and growing momentum. Overall, the structure looks positive and promising.
Technical Observations:
Breakout observed after triangle consolidation
Price is holding above the breakout zone
Momentum looks strong, indicating buyer dominance
Chart structure suggests potential continuation on the upside
Fresh Entry Zone:
Buy Above: ₹522.50 (on confirmation and volume support)
Potential Targets:
Target 1: ₹595
Target 2: ₹767
Further upside possible if momentum sustains
This setup looks suitable for traders who are looking to catch a momentum move, provided risk is managed properly.
Important Disclaimer:
This post is strictly for educational purposes only.
It is meant to explain:
How a final breakout occurs
How price action can expand after consolidation
Please do not treat this as financial advice.
Before taking any trade:
Consult your financial advisor
Use your own analysis and judgment
Always calculate risk and position size
Remember:
Every trade involves risk.
We operate in the financial markets where capital preservation is as important as capital growth.
Final Note:
Trade safely.
Trade with discipline.
And most importantly — keep learning and growing
Energy Commodities

BUY TODAY SELL TOMORROW for 5%DON’T HAVE TIME TO MANAGE YOUR TRADES?
- Take BTST trades at 3:25 pm every day
- Try to exit by taking 4-7% profit of each trade
- SL can also be maintained as closing below the low of the breakout candle
Now, why do I prefer BTST over swing trades? The primary reason is that I have observed that 90% of the stocks give most of the movement in just 1-2 days and the rest of the time they either consolidate or fall
Resistance Breakout in OIL
BUY TODAY SELL TOMORROW for 5%

Energy Sector Breakouts: A Comprehensive Analysis1. Definition of Breakouts
Breakout Explained:
A breakout occurs when the price of an energy sector stock or index moves above a defined resistance level or below a defined support level with increased volume.
Types of Breakouts:
Bullish Breakout: Price moves above resistance, signaling potential upward momentum.
Bearish Breakout: Price falls below support, signaling potential downward momentum.
Key Elements:
Resistance and support levels
Trading volume confirmation
Price consolidation preceding the breakout
2. Importance of Energy Sector Breakouts
Market Indicator:
Breakouts indicate a shift in supply-demand dynamics, reflecting investor sentiment in the energy markets.
Profit Potential:
Traders can capitalize on strong momentum after breakouts, particularly in volatile energy stocks.
Risk Management:
Identifying breakouts early allows for setting stop-loss levels and avoiding false moves.
Sector Leadership:
Certain energy stocks often lead sector breakouts, influencing indices like the Nifty Energy Index or S&P Energy Sector ETF (XLE).
3. Technical Analysis of Energy Sector Breakouts
Chart Patterns:
Triangles: Ascending triangles often precede bullish breakouts; descending triangles signal bearish potential.
Head and Shoulders: Breakout below the neckline signals a potential decline.
Flags and Pennants: Continuation patterns often indicate that the breakout will follow the existing trend.
Support and Resistance Levels:
Resistance: Previous highs where selling pressure is strong.
Support: Previous lows where buying pressure appears.
Breakout occurs when price decisively crosses these levels.
Volume Analysis:
High trading volume during a breakout confirms legitimacy.
Low volume breakouts often result in false signals, leading to reversals.
Indicators:
Moving Averages: Crossovers (e.g., 50-day MA crossing above 200-day MA) can reinforce breakout signals.
Relative Strength Index (RSI): Values above 70 can indicate overbought conditions; below 30 indicates oversold, helpful to gauge breakout sustainability.
MACD (Moving Average Convergence Divergence): Bullish or bearish crossovers can complement breakout analysis.
4. Fundamental Drivers of Energy Sector Breakouts
Oil and Gas Prices:
Fluctuations in crude oil and natural gas prices heavily influence energy stocks. Rising prices often trigger bullish breakouts.
Energy Demand and Supply:
Seasonal demand changes (e.g., winter heating, summer cooling) can affect utilities and energy producers.
Geopolitical tensions or supply disruptions (OPEC decisions, sanctions) can spark breakouts.
Policy and Regulation:
Renewable energy incentives, carbon pricing, and subsidies can drive sector valuations and breakout trends.
Deregulation or privatization in power and utilities can lead to bullish momentum.
Corporate Earnings:
Strong quarterly results, production reports, or new project announcements often catalyze breakouts.
5. Market Sentiment and Energy Sector Breakouts
Investor Confidence:
Optimism about economic growth, industrial activity, and energy demand can lead to bullish breakouts.
Fear and Panic Selling:
Bearish breakouts are often driven by negative news, profit warnings, or declining energy prices.
Global Events:
Wars, conflicts, or global policy decisions (like climate agreements) can influence breakout trends.
6. Breakout Strategies for Traders
Entry Points:
Enter near the breakout above resistance or below support after volume confirmation.
Avoid premature entries during consolidation phases.
Stop-Loss Placement:
Place stop-loss just below the breakout point for bullish trades or above for bearish trades.
Helps minimize losses in case of false breakouts.
Target Setting:
Measure the height of the prior consolidation range and project it from the breakout point to estimate potential targets.
Risk Management:
Trade smaller positions in volatile energy stocks.
Combine technical breakout signals with macro and fundamental analysis.
7. Examples of Energy Sector Breakouts
Oil & Gas Companies:
Bullish breakout after crude oil prices surge due to geopolitical tensions.
Bearish breakout during oversupply or production increases.
Renewable Energy:
Stocks break out on government subsidy announcements or major solar/wind project approvals.
Utilities:
Breakouts often occur around regulatory changes, tariff revisions, or quarterly performance updates.
8. Common Challenges in Energy Sector Breakouts
False Breakouts:
Price briefly moves past resistance/support but returns, trapping traders.
Avoid by confirming with volume and technical indicators.
Volatility:
Energy markets are prone to high volatility due to global oil prices, weather events, and geopolitical risks.
News Sensitivity:
Sudden policy changes, sanctions, or natural disasters can invalidate technical setups.
9. Sector-Specific Considerations
Oil & Gas:
Highly correlated with crude oil futures.
Watch OPEC meetings, inventory reports, and geopolitical news.
Renewable Energy:
Sensitive to government policies, subsidies, and technological advancements.
Breakouts often occur with announcements of new projects or partnerships.
Power & Utilities:
Influenced by regulatory frameworks, tariffs, and infrastructure investments.
Breakouts may be slower but more sustainable due to stable demand.
10. Tools and Resources for Identifying Breakouts
Technical Platforms:
TradingView, MetaTrader, and NSE/BSE charting platforms.
Market News Feeds:
Bloomberg, Reuters, and industry-specific news portals.
Government & Policy Reports:
Energy Ministry releases, OPEC reports, renewable energy agencies.
Algorithmic Alerts:
Use automated tools to get breakout alerts based on predefined technical conditions.
11. Conclusion
Energy sector breakouts offer significant trading and investment opportunities, but they require careful analysis.
A successful approach combines technical patterns, volume confirmation, fundamental drivers, and market sentiment.
Traders must be vigilant about false breakouts, high volatility, and sector-specific nuances.
Long-term investors can benefit by linking breakouts with macroeconomic trends and structural shifts in energy demand.
The energy sector remains dynamic, and breakouts often precede strong trends, making them an essential tool for market participants.
✅ Key Takeaways:
Breakouts signal shifts in momentum; confirmation by volume is critical.
Technical patterns, support/resistance, and indicators provide actionable insights.
Fundamental factors (oil prices, demand, policy) often drive sector breakouts.
False breakouts are common; risk management and stop-losses are essential.
Energy sector breakouts are highly sensitive to global events and sentiment.

Natural Gas Zoooming Uppppp !!!Natural Gas has risen by almost 80% in the last 9 days, maybe due to the expectation of spike in Crude Oil prices, and also due to the energy requirement for heating purposes, in the western countries during the cold season of the year.

NATURALGAS BOOM Naturalgas gas make a high of 444on 21 Jan 26. It's good move. Entry was given near 297 . Keep Trial SL don't make new entry . It's news based Rally.
Tgt 350+

NaturalGas ShortGo with short as Natural Gas conditions are not favor to it. Check the entry and exit point for the NatGas.
It's just our analysis we're not responsible for your losses or gains. you must do strong analysis.

RELIANCE: Major Weekly Breakout & Long SetupTechnical Analysis
Structure Breakout: The stock has successfully broken out above a key multi-month resistance level at 1592.30 (marked by the green horizontal line). This level previously acted as a significant supply zone, forming the rim of a potential bullish consolidation pattern (resembling a Cup & Handle or Rounding Bottom).
Momentum: The recent weekly candles show strong bullish momentum, pushing through the resistance with conviction. The price is now sustaining above this breakout point, which validates the bullish thesis.
Trend Continuation: After a period of correction and consolidation, the primary uptrend seems to be resuming. The Higher High (HH) formation on the weekly chart confirms the strength of buyers.
Risk/Reward: The setup offers an excellent Risk-to-Reward ratio (approximately 1:3), making it a high-probability trade for positional traders.
Trade Setup (Long)
Entry Zone: 1592 - 1600 (On the retest or continuation above the breakout level)
Stop Loss: 1509.15 (Placed below the breakout candle and recent swing structure to invalidate the thesis)
Target: 1855.60 (Projected measured move based on the depth of the previous consolidation)
Potential R:R: ~ 1:3.1
⚠️ Disclaimer: This analysis is for educational purposes only and does not constitute financial advice. I am not a SEBI registered analyst. Trading involves risk; please consult your financial advisor and conduct your own analysis before executing any trades.

Nifty ATH vs. Trump’s War: Monday Levels to watchNifty just hit a historic All-Time High of 26,340 on Friday. But over the weekend, Donald Trump sent shockwaves through the world—attacking Venezuela and capturing Maduro. This Monday, we aren't just trading charts; we are trading geopolitics. Is this the end of the rally or a massive 'Buy the Dip' opportunity? Let’s look at the pre-market levels.

Crude Oil Long ??What could be the next move for Crude Oil after yesterday's attack of USA on Venezuela taking control of their Crude reserves. What does it mean for India, US Dollar and INR ?

USOil the zone 58.200 is retesting again and again The zone 58.200 is retesting again and again.if market again tap this zone we can take trade according to the market condition Buy or Sell .

$CRUDE will be very RUDE in upcoming months!on a weekly timeframe Crude consolidating in paraller channel making lower highs lower lows
in other angle its making a BULLISH FLAG pattern.
keep on watchlist.

HEG: Long consolidation breakout at 550HEG: CMP 550
Trend: Bullish.
Resistance: 612/683/727
Support: 520/496
Long consolidation breakout at 550. Needs volume to support sustained breakout.

Natural Gas Analysis in Daily TFNatural Gas completed in Leading Diagonal Pattern wave 1 cycle degree completed now in correction phase so don't go long immediately wait up to fib retrace 61.8% and wave ((4)) sweep then go long target Cycle degree wave 1 and 2 extension of 161.8 level may be reach in 2026 or 2027

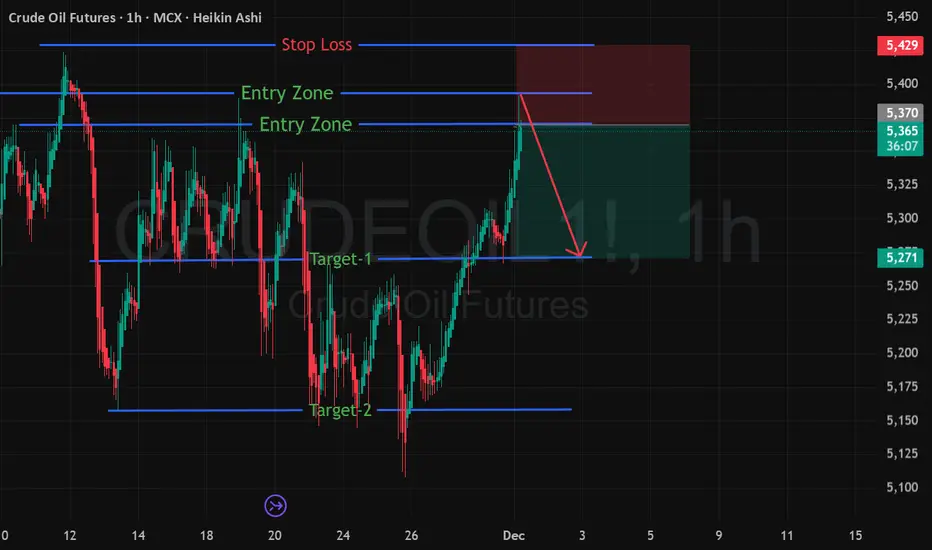
MCX CRUDE OIL (DEC-25) — Bullish Trend Setup IdentifiedA fresh Bullish Trend Entry Zone has been detected on MCX Crude Oil DEC-25, indicating a potential upside continuation from the demand zone.
📈 Trade Setup
🟢 Entry Range: 5370 – 5390
🔴 Stop Loss: 5430
🎯 Target 1: 5270
🎯 Target 2: 5170
📊 Chart Explanation
Crude Oil has recently shown strong accumulation behavior near the lower demand band. Price is now entering a bullish reversal range, supported by:
Prior demand zone retest
Higher-low structure
Increasing bullish momentum
Buyers absorbing supply near 5370–5390
This setup indicates a possible swing move towards the 5270 and 5170 zones.
⚠️ Risk Management
Keep SL strictly at 5430
Position sizing is crucial as volatility remains high
This analysis is for educational purposes—trade with discipline
📌 Summary
Crude Oil DEC-25 is showing a clean bullish continuation structure. If price sustains above the entry zone, we may see a strong move toward the mentioned targets.
FLUENCE ENERGYFLUENCE ENERGY MADE DOUBLE BOTTOM with DIVERGENCE in monthly chart and also in process of forming CUP & HANDLE FORMATION, and it is at resistence level at $24, if it breaksout resistance at $24 we can expect to reach $30 & $44.
Chart analysis done on best of my knowledge, it may reach or may not reach targets :-)

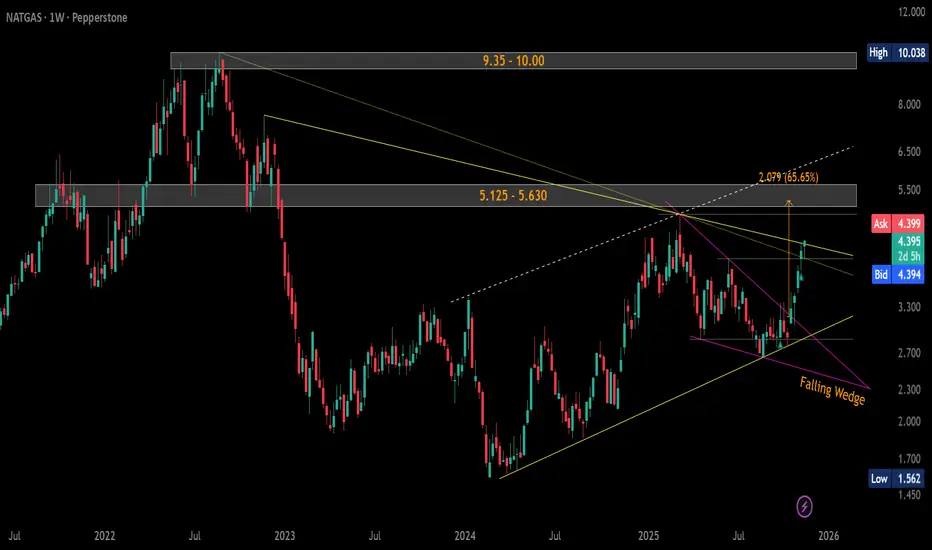
#NaturalGas ($NG) Weekly Update — Trading at Breakout ZoneCMP: $4.400
+54% from suggested levels and +58% from lows. 🚀
Price trading in the key resistance zone $4.339–4.417.
WCB > $4.417 = Symmetrical Triangle breakout → Falling Wedge target: $5.246 🎯
🛡 Supports: $4.067 / $3.803 / $3.625–$3.572
🚧 Major Resistances:
• ST: $5.125–$5.630
• LT: $9.35–$10.00
Tight structure… breakout looks close. 🔥
#NG VANTAGE:NG #NaturalGas #Commodities #PriceAction #SymmetricalTriangle #FallingWedge #ChartPatterns #Breakout
📌 #Disclaimer: This analysis is shared for educational purposes only. It is not a buy/sell recommendation. Please do your own research before making any trading decisions.
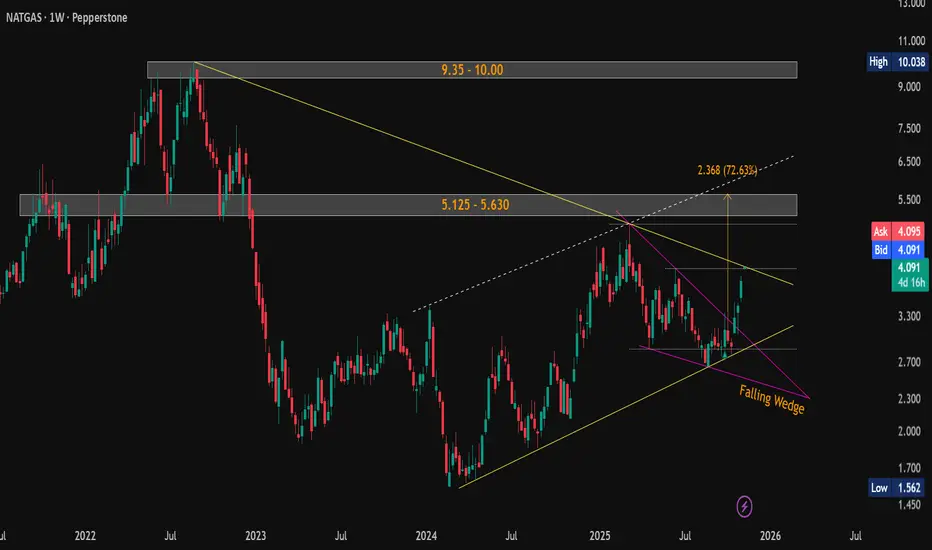
#NaturalGas ($NG) Weekly Update — Testing Critical Resistance!CMP: $4.092
💥 Up +38% from mentioned support ( $3.013–$2.956 ) and +46% from lows in a month . 🚀
The falling wedge breakout played out strongly, and price is now testing the critical resistance of the falling yellow trendline near the previous swing high $4.067 .
A weekly close above this trendline will confirm a major breakout , potentially triggering the next leg higher.
📊 Key Levels:
🛡 Supports: $4.067 / $3.013–$2.956 / $2.692–$2.643
🚧 Resistances / Targets: $5.125–$5.630 / $9.35–$10.00
Structure now forming a larger Symmetrical Triangle between rising and falling yellow trendlines — watch for breakout confirmation .
⚠️ Possible short-term pause/retest before continuation.
#NaturalGas #NG #Commodities #FallingWedge #RisingChannel #SymmetricalTriangle #ChartPattern #PriceAction
📌 #Disclaimer: This analysis is shared for educational purposes only. It is not a buy/sell recommendation. Please do your own research before making any trading decisions.
Oil India | Bullish Breakout with Institutional Volume Surge💹 Oil India Ltd (NSE: OIL)
Sector: Energy | CMP: ₹438.05 | View: Bullish Breakout Setup
📊 Price Action:
Oil India has shown a strong bullish candle breakout after weeks of consolidation between 410–420. Buyers stepped in aggressively with volume confirmation, pushing price above the short-term resistance. A sustained close above 435 could trigger a fresh up-move toward the 450–455 zone.
HNI Trade Levels (STWP Setup):
Aggressive Entry: 434.75–436.20 | Stop Loss: 416.08
Low-Risk Entry: 432.57 | Stop Loss: 411.75
HNI and institutional buyers are showing strong accumulation interest with rising volumes. The breakout candle indicates smart money entering early into the trend. Sustained buying momentum suggests continued institutional participation ahead.
VCP Analysis:
Oil India is forming a smooth Volatility Contraction Pattern with clear price tightening in recent weeks. Volume contraction followed by today’s strong expansion indicates a potential VCP breakout stage. The surge in volume confirms institutional activity aligning with the final contraction phase breakout.
STWP Trading Analysis:
Entry: 436.20 | Stop Loss: 410.30
Strong bullish momentum with a wide-range candle backed by heavy institutional volumes. The breakout structure signals renewed trend strength with clear directional intent. Sustaining above 430 will keep the momentum in favor of buyers.
Fibonacci Analysis:
Oil India’s Fibonacci structure is plotted from the Swing Low at 384.6 to the Swing High at 491.5, capturing the recent trend wave. The stock is currently trading near the 50% retracement level at 438.05, showing a strong recovery within the ongoing uptrend. Holding above the 38.2% zone at 425.44 will keep momentum intact, while a breakout above the 61.8% level at 450.66 could extend the move toward 468–491, confirming trend continuation.
STWP Support & Resistance:
Resistances: 440.53 | 446.32 | 456.43
Supports: 424.63 | 414.52 | 408.73
While we note the above technical levels, the chart displays resistance zones at 448–456 and 478–491 as relatively weak, indicating limited selling pressure. However, supports near 392–384 and 325–350 appear strong, reflecting firm institutional demand and accumulation interest. This structure suggests a bullish bias, where sustained buying above 440 could trigger continuation momentum toward higher levels.
STWP Volume & Technical Setup:
Oil India delivered a power-packed bullish session today, marked by a strong Marubozu candle that reflected uninterrupted buying momentum from open to close. The chart’s yellow label captures a perfect storm of bullish confirmations — from exceptional volume (6.03M vs 2.48M avg, ratio 2.43x) to a Bollinger Band breakout emerging right after a compression phase, signaling fresh volatility expansion. The RSI breakout, 200 EMA crossover, and BB Squeeze trigger all align to validate institutional accumulation and trend strength. With buyer dominance clearly visible, Oil India stands poised for a momentum-driven continuation in the sessions ahead.
STWP Summary View:
Final Outlook:
Momentum: Strong | Trend: Bullish | Risk: Low | Volume: High
Oil India displays a textbook bullish setup with strong price action, expanding volume, and visible institutional activity.
A high-volume breakout from a tight base confirms trend strength and upside potential. Holding above key supports keeps risk low and the bullish momentum intact.
________________________________________
________________________________________
⚠️ Disclosure & Disclaimer – Please Read Carefully
The information shared here is meant purely for learning and awareness. It is not a buy or sell recommendation and should not be taken as investment advice. I am not a SEBI-registered investment adviser, and all views expressed are based on personal study, chart patterns, and publicly available market data.
Trading—whether in stocks or options—carries risk. Markets can move unexpectedly, and losses can sometimes exceed the money you have invested. Past performance or past setups do not guarantee future results.
If you are a beginner, treat this as a guide to understand how the market works and practice on paper trades before risking real money. If you are experienced, always assess your own risk, position sizing, and strategy suitability before entering trades.
Consult a SEBI-registered financial adviser before making any real trading decision. By engaging with this content, you acknowledge full responsibility for your trades and investments.
Position Status: No active position in (OIL) at the time of analysis.
Data Source: TradingView & NSE India (Past Chart Reference) (Historical levels)
💬 Found this useful?
🔼 Give this post a Boost to help more traders discover clean, structured learning.
✍️ Drop your thoughts, questions, or setups in the comments — let’s grow together!
🔁 Share with fellow traders and beginners to spread awareness.
👉 “If you liked this breakdown, follow for more clean, structured setups with discipline at the core.”
🚀 Stay Calm. Stay Clean. Trade With Patience.
Trade Smart | Learn Zones | Be Self-Reliant 📊

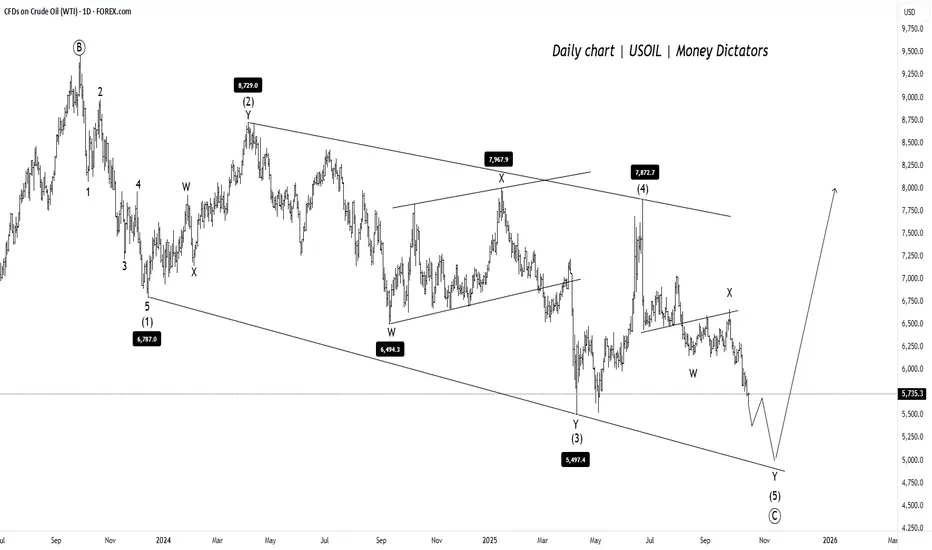
USOIL Near Final Leg USOIL is forming a clear corrective pattern inside a falling channel. Price is currently in the final leg of wave (5) of (C), suggesting one more dip is likely before reversal.
The downside target lies near 5,000–5,200 , where support from the channel base aligns. Once this level holds, a strong bullish reversal is expected, marking the end of the correction and the start of a new upward trend.
Stay Tuned!
@Money_Dictators :)
Crude Oil (WTI) Technical Analysis - October 17, 2025Current Price and OverviewAs
WTI Crude Oil is trading at 56.88 USD, down 0.58 (-1.01%) on the day. The market remains firmly in a bearish trend, with prices continuing to decline amid broader impulse wave C within a multi-month downtrend that began in July. Recent trading saw a brief rebound after testing support near 56.35, providing some positive momentum and easing oversold conditions, but the overall short-term outlook stays bearish. A bearish gap has formed below the key psychological level of 60.00, accelerating the downside.The technical summary across major indicators points to a Strong Sell, with no buy signals from moving averages and MACD confirming downward pressure.
Support and Resistance LevelsKey
Support Levels: 56.35 (immediate, recently tested), 49.5. (next major, deeper target zone 27 - 15 ).
Key Resistance Levels: 57.60–60.50 (Gold Zone, recent breakdown),
65.00 (major overhead resistance,
Price Action and Scenarios
Bearish Scenario (Primary): Prices have broken key support at 57.35 and the down-channel trendline, confirming continuation of wave C. Expect further downside to 55.20, with potential extension to 49.83 if momentum builds. Short positions are favoured on rebounds to resistance
Bullish Scenario ( Still Not Confirmed)
This analysis is based on hourly and daily charts; always consider fundamental factors like OPEC decisions or US inventory reports for confirmation.
Disclaimer
High Risk Investment
Trading or investing in assets like crypto, equity, or commodities carries high risk and may not suit all investors.
Analysis on this channel uses recent technical data and market sentiment from web sources for informational and educational purposes only, not financial advice. Trading involves high risks, and past performance does not guarantee future results. Always conduct your own research or consult a SEBI-registered advisor before investing or trading.
This channel, Render With Me, is not responsible for any financial loss arising directly or indirectly from using or relying on this information.

Crude Oil FallImpact of fresh tarriff imposition on China by US has led to further fall in crude oil. Quoting below 200 EMA. If breaks the suppport then further fall can be seen this week.

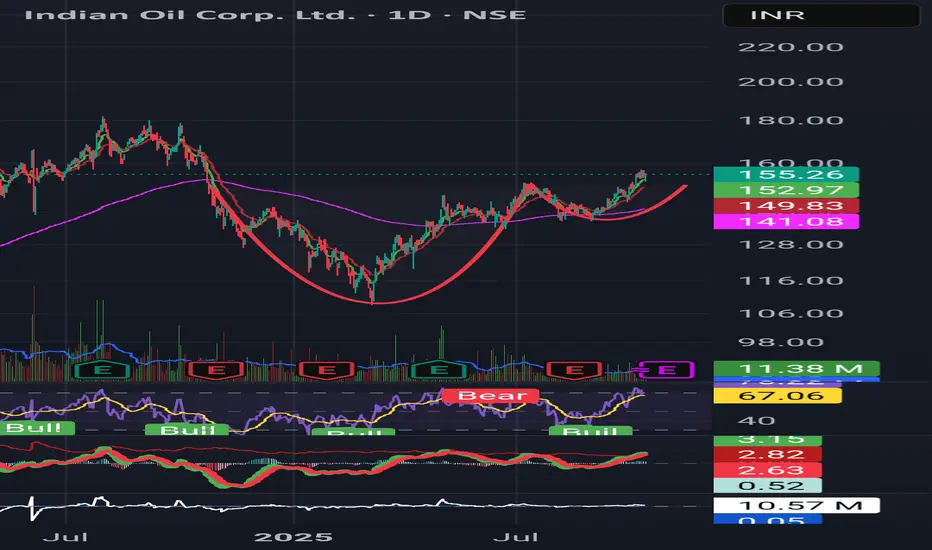
IOC forming a strong cup-and-handle breakout. IOC looks strong technically — cup-and-handle breakout on daily chart, trend intact across timeframes.
CMP 155-156;
stop 148.8;
target 180.
Trend supported by momentum & EMAs.
📈 RSI > 65
✅ MACD bullish
📊 Holding above ₹148.8 keeps the trend
CRUDE OIL By KRS ChartsDate: 2nd July 2025 / 19:35
Why Crude Oil ?
1. Starting with 1H Tf. Accumulation is visible with LLs to Sideways and now HHs & HLs
2. Crude oil Price is currently in Buy Zone with strong support.
3. Recent Gap Dow is likely to be Shakeout for Buyers.
4. In Bigger Timeframe price has made Low in March is likely to be the bottom as per Wave thoery.
5. After that bottom price on Higher low side price accumulating.
6. From Here it seems like bullish side trades will be better option for Crude Oil for Targets which are mentioned in Chart. (Medium Term View).
