USOIL Trade Idea (Zones) for Friday session 28-02-25After studying USOIL at higher TF and watching it's closing price i think 70.106 - 70.634 is No-trade zone for USOIL due to it's complexity at higher timeframe , i've also drawn a zone which can push price to downward direction which is represesnted by orange color in the chart if price sustained above this level then it can go to it's next resistance zone of 76.500 - 76.600 but here SL should be below the zone which is 70.106 and the zone itself is mutual in multiple timeframe so be cautious to trade in this zone and use manage Quantity , and for alternative scenario if price goes below 70.106 and sustained then we can see then 69.150 level because it was the last swing created and below it other levels are also mentioned in the chart , look for reversal and continuation pattern to enter in trade .
Energy Commodities

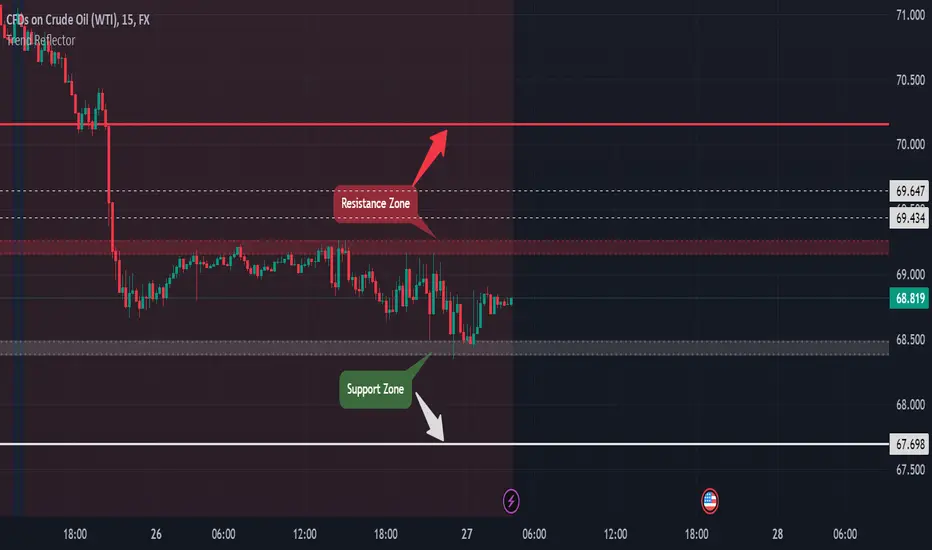
USOIL Trade IDEA for upcoming session's of Thu & FridayClosing of the last session of USOIL occurs at 68.819 and after looking at every timeframe and the price action concludes the support and resistance zone's for the upcoming session's as we look in chart next support zone 68.380 - 68.486 if price goes below this level then wait for minor retesting and short for 67.700 level which is next support this is because in higher TF picture show's downtrend ( but in lower TF retesting occurs ) for alternative scenario's if price goes upward then 69.155-69.270 is the next and strong resistance zone at this place look for reversal pattern this would be the zone from where price drop ( but 69.430-69.630 is minor reversal range shown as dotted lines in the chart which can cause reversal if price surpases the first resistance zone ) if price breaks these zones then take a buy for next resistance zone of 70.000 - 70.100 but it seems price drop of the USOIL for these session's let's see what will happen .
USOIL CHART ANALYSIS FOR 24 FEB 15M TFIn the Last session USOIL falls heavily and in daily TF it made a huge Bearish candle and gave us a daily support and resistance zone and for now for 70.112 - 70.158 is the support zone which is very near to closing of the last session price may take a pullback from this level to 70.950 - 70.170 which is the cruicial zone ( Highlighted as yellow zone in the chart ) from there price may fall again and next support is the 69.100 - 69.160 , if price break the cruicial zone then it may retrace to 71.630 - 71.800 which is the nearest resistance , i'll place my trade according to my indicator setup so look for continuation or reversal pattern to enter in trade .

Intraday to BTST trade opportunity in natural gas, it should flyHello, everyone, i have brought an intraday to postional trade in natural gas, i am expecting it should take support in this area, probability is very high that it should take supprot in this area, Today's day low can be our intraday support and the stop loss which i mention below to that is gonna to be a postional stop loss. Targets already mention on chart.
Disclaimer:- This analysis is for educational purposes only. Please trade responsibly and consult a financial advisor before making any decisions.
If you found this analysis helpful, don’t forget to like, follow, and share your thoughts in the comments below! Your support keeps me motivated to share more insights. Let’s grow and learn together—happy trading!

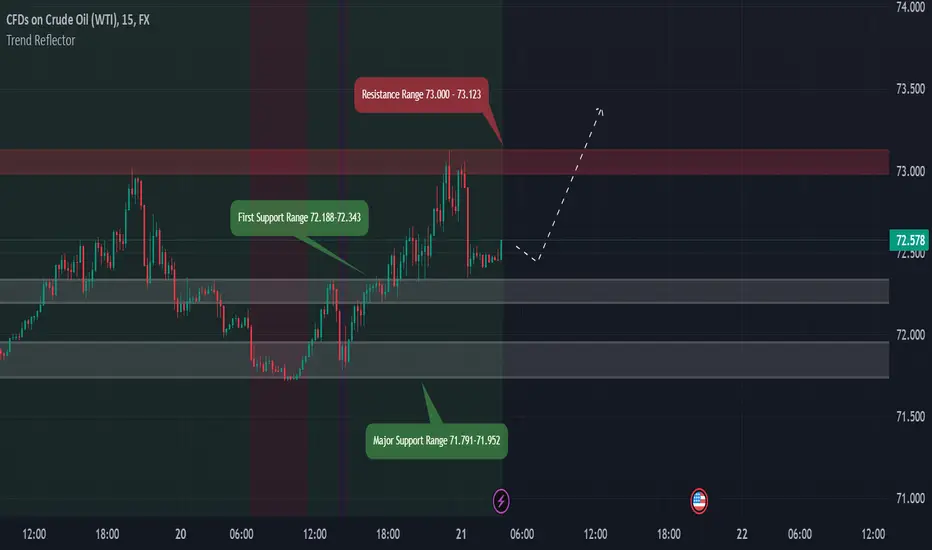
USOIL Chart analysis for Friday 21 Feb 25 Session 15M TFUSOIL last session closing was at 72.578 and made a high of 73.123 after studying it in higher TF i think if price comes downward then it's First Support Range is 72.188-72.343 if this range works as good support then we can see price upward movement from this range of support if it'll not sustain then Major Support Range is 71.791-71.952 it is good support it should sustain the price if it comes towards it in case it breaks then we can see bearish movement for the day , these support levels should work if we take a look in higher TF and our Trend Reflector also indicates bullish sentiment look for reversal price action if price comes to these levels , in case it breaks resistance zone of 73.000- 73.123 then we may get the level of 73.750 which is the next resistance , it's very clear look for bullish entry until major support breaks, it seems bullish for the day.
USOIL Chart Pattern for upcoming session's 15M TFWith accordance to 4H TF USOIL should fall to 71.500 to 71.200 with ease in this session but if we take a look to Daily TF we may see a price upper side when it touches 71.65-71.750 ,i've analysed it bit more it looks like if it goes to 71.500 then we should wait for 71.350 level to break and close below it and then short till 70.600 but in case it takes rejection at level of 71.350 - 71.500 then we can see 73.000 as our next target .

Crudeoil expected uptrend movement upto 74/75.5Symbol CRUDEOIL
Timeframe 1 hour
Analysis Uptrend Movement upto 74/75.5 expected.
Breakout from Triangle pattern, so we can expect a uptrend movement upto 74/75.5
We hope our analysis is adding value to your trading journey.
Please note: Published ideas are for educational purposes only. Trade at your own risk.
Also, please respect the risk - stop loss (SL) should not be more than 2% of the capital.
DISCLAIMER: We are not SEBI registered. All the ideas posted in this channel are solely for educational purposes."

WTI Crude Oil Trading Recommendation - SELL StrategyInstrument: USOIL (WTI Crude Oil)
Timeframe: 1H, 4h
Strategy: Pending Sell Order (Sell Limit)
Technical Analysis:
WTI crude oil is approaching a key resistance zone at 72.5 - 72.9 USD/barrel, where strong selling pressure is expected.
The overall trend remains bearish as the price stays below the EMA 33 levels.
If the price reacts strongly at this level, a pullback towards lower support zones is highly likely.
Trade Setup:
✅ Entry (Sell Limit): 72.5 - 72.9 USD/barrel.
✅ Stop Loss (SL): 73.00 - 73.80 USD/barrel.
✅ Take Profit (TP):
Target 1: 69.88 USD/barrel.
Target 2: 68.36 - 67.40 USD/barrel.
✅ Holding Time: Expected until early next week.
Market Outlook:
The 72.5 - 72.9 USD zone is an ideal area for short-selling due to strong supply levels.
If the price shows a bearish reaction here, selling pressure could push it down to 69.88 USD, and possibly lower to 68.36 - 67.40 USD.
This strategy aims to take advantage of a pullback before continuing the downtrend, offering a favorable risk-reward ratio.

Natural Gas Confirm Targets 400 Natural Gas Price Analysis and Outlook
As of February 14, 2025, natural gas (NG) prices have exhibited significant volatility, influenced by various market dynamics.
Technical Analysis
Current Price Range : The latest support level for NG prices is identified between ₹286 and ₹293 per unit.
Major Support Level : A more substantial support zone exists between ₹250 and ₹260, indicating strong buying interest at these levels.
Major Resistance Level : On the upside, significant resistance is observed between ₹410 and ₹420, which may act as a barrier to price increases.
With increasing power demand, cold weather, rising forecasts, and strong exports, natural gas prices are likely to go up in the near future

NATURALGAS BULLISH VIEWNATURALGAS Bullish View.
Ready For Upside 315-325.
CMP 303-304
Weak Below 295 ( on Closing Basis).
For Educational Purpose only.

CRUDEOIL BULLISH VIEWCrude Oil Bullish View above 6400.
CMP 6390
Ready For Upside 6500-6600.
Weak Below 6290 ( 5 min CLB)
For Educational Purpose only.

USOIL - BULLISH TREND WILL CONTNUE ?Symbol - USOIL
The USOIL has recently experienced a decent correction within its uptrend, which has provided an opportunity for price consolidation before the potential continuation of the bullish trend. This correction has allowed the market to stabilize, and the recent price action suggests that the uptrend is likely to resume, supported by a combination of supply constraints and growing demand expectations.
Geopolitical tensions and OPEC production cuts continue to play a significant role in influencing oil prices, while global economic recovery, particularly in major consuming nations, provides further optimism for sustained demand. These factors are likely to continue supporting oil prices as market participants remain cautious about future supply disruptions. With the recent correction now completed, USOIL appears poised for further upward momentum, especially if these bullish fundamentals continue to hold.
Technically, the key support level to watch is $72.50 - $73.00 If this level is defended by the bulls, the price is likely to push towards the $78.00 - $80.00 range, which represents the next major resistance zone.
Resistance levels: $78.00, $80.00
Support level: $73.00
The price has recently tested the $73.50 support zone. A potential false breakdown could occur here, aimed at capturing liquidity before prices resume their upward trajectory. With the correction phase likely behind us, renewed buying interest in USOIL could drive prices higher as the uptrend continues to unfold.

NATURAL GAS - CAPPED UPSIDE & MORE DOWNSIDE?Symbol - XNGUSD
Natural Gas has recently been trading within a wedge pattern, which has now broken to the downside. This technical development suggests that the upside potential appears capped for the time being. The market is currently testing critical levels, and the broader outlook seems to be more focused on downward movement in the short to medium term.
There is a possibility of a breakdown retest around the 3.25 - 3.30 area, which could act as a key resistance zone. If this level holds, we could see a sell-off, confirming further downside pressure. The outlook for Natural Gas, in this context, leans bearish, with the price potentially targeting the 2.80 - 2.70 range in extension.
The market is closely watching weather forecasts and energy inventories, with any cold weather or supply disruptions potentially offering temporary support. However, unless these fundamentals change significantly, the technical breakdown suggests limited upside potential and further downside risks.
Resistance levels: 3.28, 3.20
Support levels: 3.00, 2.80
Technically, the current outlook favors a move lower, with further downside expected if the price fails to reclaim the 3.25 - 3.30 resistance. Should the retest of these levels hold, we could see a sell-off towards the 2.80 - 2.70 area. A failure to hold above the 3.10 support would reinforce the bearish sentiment and suggest further declines.

view on Crude oil MCX futurescrude oil retesting its trendline resistance in weekly timeframe, now crude needs to sustain above 6300-6250 to resume upside target of 7000-7300+. Otherwise, downside targets of 5900 -5600 will be open.

SILVER VIEW⚠️Education Purpose only!!!!
Key Support area:-87,100
Key Resistance area:-96,200
Silver has long been considered a 🏦 store of value and a 🛡️ hedge against inflation.
Riskier but suitable for speculation and hedging.
🔧 Industrial Demand – Used in ⚡ tech, ☀️ solar, 🚗 EVs
💰 Monetary Hedge – Safe-haven in 🔥 inflation & 📉 downturns
⛏️ Supply Constraints – Limited mining, rising demand 📊
📊 Growing Investment – ETFs & retail piling in 🚀
⏳ Long-Term View
If industrial demand and inflation persist, silver could see 📈 strong appreciation over the next decade.
🔍 Investors should monitor global economic trends, 📉 interest rates, and ⛏️ mining supply data to make informed decisions. 🚀
Price Action applied :-
⭕️50 Day Moving averages
⭕️Channel Pattern Formation
⭕️Range Breakout
⭕️Triangle Pattern Formation
⭕️Demand Zone
⭕️Major Resistance area
✅Check out my Trading View profile to see how we analyze charts and execute trades.
🙋♀️🙋♂️If you have any questions about this stock, feel free to reach out to me.
📍📌Thank you for exploring our idea! We hope you found it valuable.
🙏FLLOW for more !
👍LIKE if useful !
✍️COMMENT Below your view

Union Budget 2025: Key Highlights & Market ImpactUnion Budget 2025: Key Highlights and Market Implications
Hello everyone, I hope you're all doing well in your personal and trading endeavors. Today, I bring you a concise summary of the Union Budget 2025, presented by Finance Minister Nirmala Sitharaman on February 1, 2025. This budget focuses on boosting economic growth, providing tax relief, and strengthening various sectors of the economy.
Key Highlights of Union Budget 2025
Income Tax Relief: The government has increased the income tax exemption limit to ₹12 lakh under the new tax regime, providing significant relief to salaried individuals. This is expected to boost savings and consumption.
Infrastructure Development: Increased capital expenditure has been allocated to roadways, railways, and smart cities, aiming to accelerate economic growth and employment.
Agriculture and Rural Economy: Enhanced financial support and subsidies for farmers, along with new schemes to promote high-yield crops and modern agricultural techniques.
Stock Market and Investment: The budget introduces measures to encourage long-term investments, with tax benefits for equity investors and policies to strengthen capital markets.
Energy Sector and Sustainability: A Nuclear Energy Mission has been launched, along with incentives for renewable energy projects, focusing on sustainable development.
Support for Startups and MSMEs: Tax benefits and funding support have been extended for startups and small businesses to drive innovation and entrepreneurship.
AI and Digital India Initiative: Increased investments in artificial intelligence, digital infrastructure, and cybersecurity to strengthen India's tech ecosystem.
Healthcare and Education: Enhanced budget allocation for the healthcare sector, medical research, and AI-driven education initiatives.
Impact on Traders and Investors
✔ Positive Sentiment for Equity Markets: Increased disposable income and tax relief could lead to higher consumer spending, benefiting FMCG, auto, and retail sectors.
✔ Growth in Infrastructure and Energy Sectors: Higher government spending on infrastructure and renewable energy will likely boost related stocks.
✔ Technology and Startups to Benefit: Increased government support for startups and AI-based industries could lead to significant growth in these sectors.
This budget provides multiple opportunities for traders and investors to align their strategies with emerging trends. Stay updated, analyze the market, and make informed decisions.

Naturalgas uptrend Movement expected upto 3.6730Symbol Naturalgas or XNGUSD
TImeframe 30 minutes
ANalyis Value of the Natural gas is above resistance line and we can expect the target uptp 3.6730
Target 3.6730

view on crude oil futures India #CRUDEOILcrude oil broke its support at 6680 from 6735, its next support is 6549 and if it breaks below this level,
it can test 6340-6380,
if sustain above 6630 can test 6720 !!

USOIL or CRUDEOIL DOwntrend Movement upto 76.5/75.15/74Symbol : USOIL or CRUDEOIL
TIMEFRAME 1HOUR
Analysis DOWNTREND Movement
can expect the target upto 76.5/75.15/74
NOTE: Published Ideas are for ‘’EDUCATIONAL PURPOSE ONLY’’ trade at your own risk.
NOTE: RESPECT The risk. SL should not be more than 2% of the capital.
Happy Trading

Natural Gas February, 2025 - IntradayA small intraday analysis of NG to capture quick 5 pips.
1. Buyers have the control.
2. As seen in RSI from 50% level NG gets a buying pressure.
simple analysis always do miracles!
* Natural Gas target is $ 3.40 of Jan month

Updated crudeoil chart for aiming 7000+on 24th November I shared crude oil view with potantial target for 7000+ for upcoming days.
On chart my 1st Target is exactly achieved for 6383 on 3rd January 2025 with making high of it.
Now I made updated some potantial support for Crude Oil.
If it comes towards the zone then Crudeoil aiming up fast for 7000+
otherwise crudeoil try to make sideways zone around 6300-6500 for more days.

OIL bullish for short term upside to 550Hello Everyone,
Have spotted a bullish pattern on the chart that can take the prices to 510-550 in the short while.
Points to note:
> Out of all, Oil sector is showing some strength.
> OIL has seen recovery for the current support levels multiple times in the past.
> Trading above 100EMA with good volumes.
> Hammer spotted
Important leves:
Support: 464
Resistence: 450
Entry Levels: 485-490
Exit Levels: 464 or trail with EMA 100 once it breaches 500 levels.
Risk to Reward: Optimal Entry 485 – Target 550 = Almost 3x Reward to Risk

Crude Oil ViewCrude is continuously taking support from the marked zone on the daily time frame. It looks like we can have the targets for upto 7000+ in crude very soon.
(Shared for educational purpose only)
