The Next Big L2 Gem? $ARB Is Breaking Out —Why It Could it 10x🚨 The Next Big L2 Gem? AMEX:ARB Is Breaking Out — Here's Why It Could 10x+ 🚨
🔰 What is Arbitrum?
Arbitrum is Ethereum’s top Layer-2 scaling solution using Optimistic Rollups.
It powers faster, cheaper transactions without compromising security.
🔰 Ecosystem Highlights
▶️ Arbitrum One – DeFi & dApps
▶️ Arbitrum Nova – Gaming & Social apps
▶️ Hosts major projects: Uniswap, Aave, GMX
▶️ Among the top L2s by TVL dominance
🔰 Tech & Innovation
▶️ Runs on fraud-proof optimistic rollups
▶️ Nitro upgrade boosted throughput + cut gas fees
▶️ Gives near-Ethereum experience with 10x lower costs
🔰 Tokenomics
▶️ Total Supply: 10B ARB
▶️ Airdrop: 1.162B (11.6%) to users & DAOs
▶️ Remaining: Treasury + future ecosystem rewards
➡️ Small circulating supply = potential supply squeeze on demand surge
🔰 Backers & Partnerships
▶️ Built by Offchain Labs
▶️ Investors: Lightspeed, Pantera, Coinbase Ventures
▶️ Listed on Binance, Coinbase, KuCoin
▶️ Integrated by top Ethereum protocols (Uniswap, etc.)
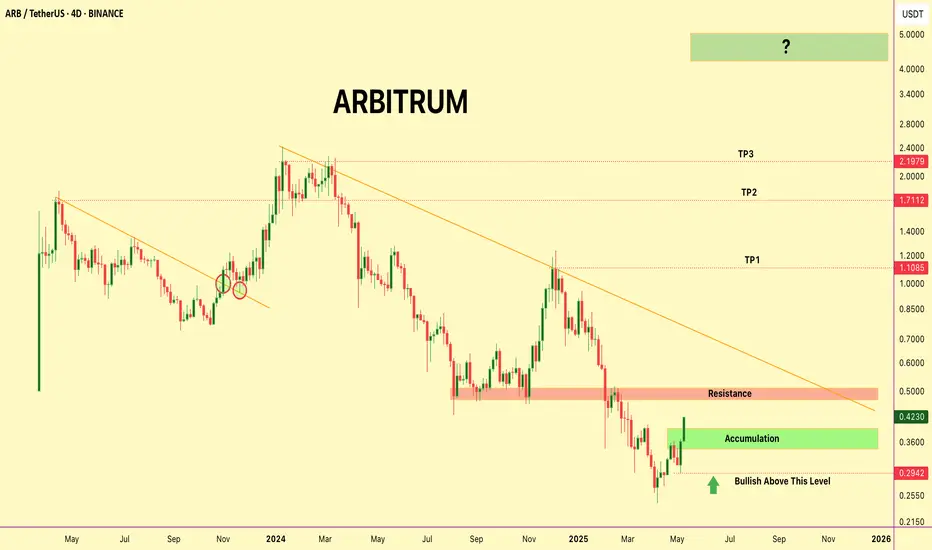
🔰 TECHNICAL BREAKDOWN: ARB/USDT HTF Chart
✅ Accumulation Zone: $0.29–$0.42
▶️ Above $0.4028 = momentum shift zone into Super Bullish
▶️ Next resistance: $0.48–$0.52 (watch for breakout!)
▶️ Targets: $1.10 / $1.71 / $2.19 / $5
⚠️ Hold above $0.2942 to keep setup valid
✅ Strong volume + higher lows = bullish confirmation
▶️ DYOR | NFA
🔰 Why 10x–50x Is Possible
▶️ Top Ethereum L2 by usage
▶️ Real utility, not meme hype
▶️ Limited unlocked supply = buyer advantage
▶️ L2 sector will explode if ETH demand grows
▶️ Could capture a huge chunk of ETH's scaling market
🔰 Final Take
▶️ AMEX:ARB is more than hype — it's infrastructure.
▶️ In a bull market, this is the kind of setup that runs hard.
▶️ Keep it tight on your watchlist.
Ethereum (Cryptocurrency)
Ethereu ETHUSDT Price Outlook: Key Resistance at 2005–2055 Level"On the Daily Time Frame, the levels 2005.00 and 2055.21 are key resistance zones. If the price approaches this area, there is a high probability of rejection. Should the market show bearish confirmation on the 1-hour time frame from this region, it may indicate a potential move lower—possibly to hunt liquidity near the trendline around 1730. Further downside could lead the price into the demand zone between 1600 and 1500, where it may find support."
No trade setup is ever 100% certain. Every trade carries both risk and reward. Effective risk management is the key to long-term success in trading.
Thanks for Your Support.

Will Ethereum Break $1875 Resistance this Time?🚨 BREAKOUT WATCH: If Ethereum breaks above the key $1875 resistance, it opens the door for a bullish rally toward $3000 in the coming weeks.
Strong breakout = high momentum setup.

Will Ethereum hit $12000 in current Bull Market?CRYPTOCAP:ETH just confirmed a monthly hammer close — strongest bullish signal of 2025 so far.
Last similar structure led to a +60% rally.
Price action + volume = Strong reversal setup.
Bias: Long | Accumulation Phase Activated 🚀
Note: NFA & DYOR

BTC next 24 hours Important Zones are we heading to $100K Yes/NoHello Guys,
Follow up to our Morning Post, DELTAIN:BTCUSD.P responds exactly to the support base of 95000 Zone and
roaming around those.
What to expect now, if we cross the Supply Zone 1 mentioned in the chart, the next target is
It will test Supply Zone 2, till we are comfortably close above this and trade strongly, doors for Historic $100k will open after that level only, btw you know Target for Bitcoin was predicted by our 10x Bulls Team in year 2021.
An vice versa not holding the 95000 demand zones, will make this difficult for bulls.
Plan your trade with risk properly managed.
-10x Bulls
Courtesy: 10x Bulls (An educational helpdesk platform for investors and traders to find the best investment decisions, faculty trained by ex-fund managers, from Top Finance Institutions such as JP Morgan Chase and Goldman Sachs)

Will Bitcoin Hit $1 Million in Future?Everyone’s Scared of #Bitcoin Red Candles... I see Opportunity.
1⃣ This ain’t just a dip — it’s a Discounted future begging to be Grabbed.
2⃣ My Chart will Age like fine wine 🍷
3⃣ Buy fear. Stack smart.
4⃣ In a few years, You'll wish you did.
Let the smart money eat. 🚀
NFA & DYOR

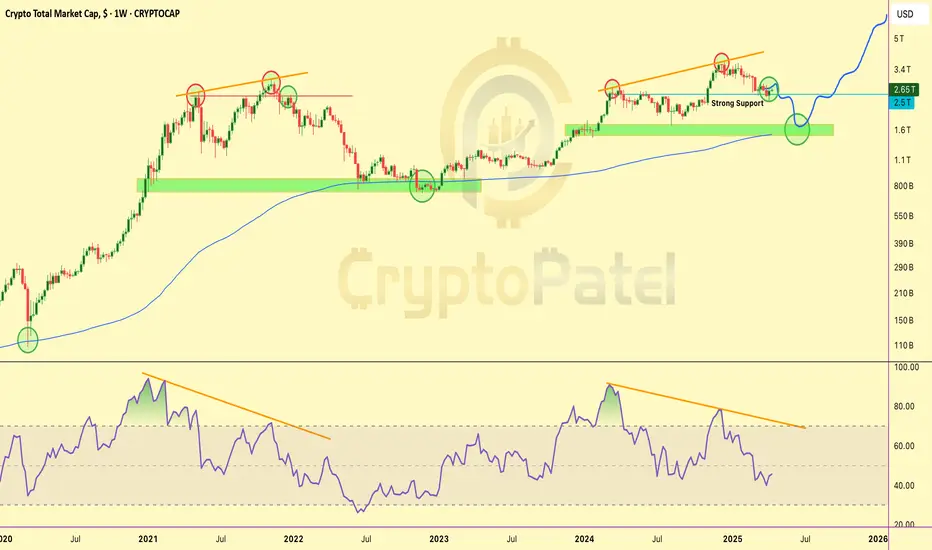
Very Important Market Fractal Alert – Be Prepared for All ScenarVery Important Market Fractal Alert – Be Prepared for All Scenarios
Trust me, I don’t like this setup either…
But if this historical fractal plays out again, we could be looking at a potential $1 Trillion drop in total crypto market cap — a serious correction.
Key Level to Watch:
Total Market Cap must hold the $2.50T support zone.
If this level sustains, we remain structurally bullish — no major worries.
⚠️ However, if $2.50T breaks down with volume, the market could enter a deeper correction phase.
It’s not FUD — it’s just preparation.
This chart is not a prediction, it’s a pattern to be aware of.
Hope it fails — and price breaks upward instead.
✅ Stay alert.
✅ Manage risk.
✅ Always plan for both sides of the market.
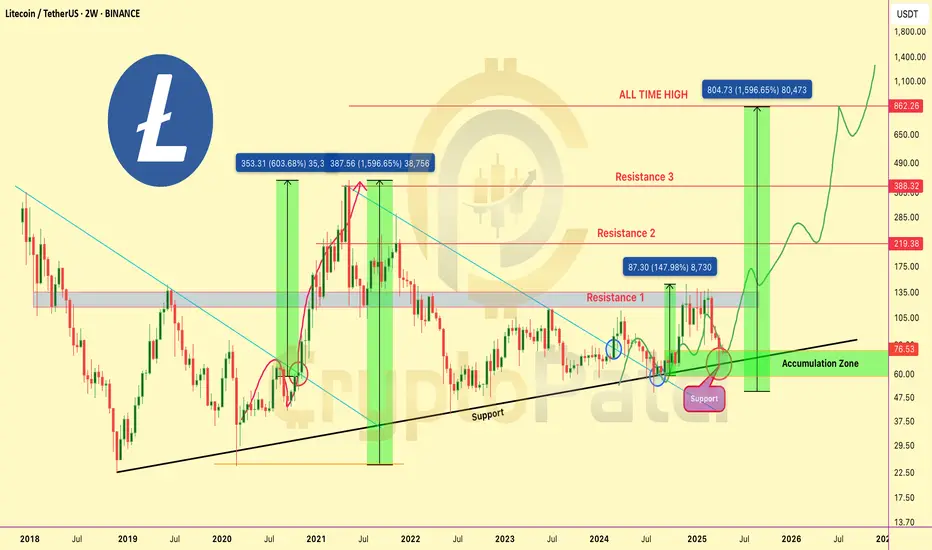
Last time Litecoin was here, it went up 10x. Can it do it again?🚨 Last time Litecoin was here, it went up 10x. Can it do it again?
CRYPTOCAP:LTC is back in its accumulation zone ($60–$80) — the same area where it kicked off a 600%+ rally in 2020 and a 1,500%+ move in 2021!
Every time Litecoin touches this zone, it doesn't just bounce… it rockets 🚀
Right now, it's holding the long-term uptrend support line, showing signs of strength. If we break above the $105–$135 resistance, the next targets are:
👉 Mid-term: $219
👉 Long-term: $388 — and possibly even the $862 ATH 👀
With the structure this clean and history on our side, this could be one of the best R/R setups in the market right now.
Accumulation phase doesn't last forever. Eyes on LTC 👇
🟩 Buy Zone: $60–$80
🟥 Stop-loss: Below $58
💎 Targets: $135 → $219 → $388+
Patience might just pay off big this cycle 💎
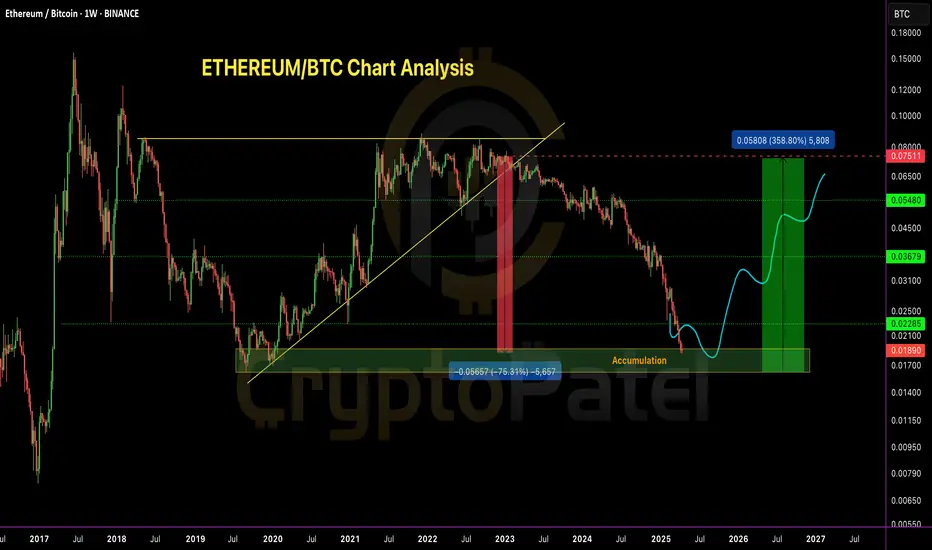
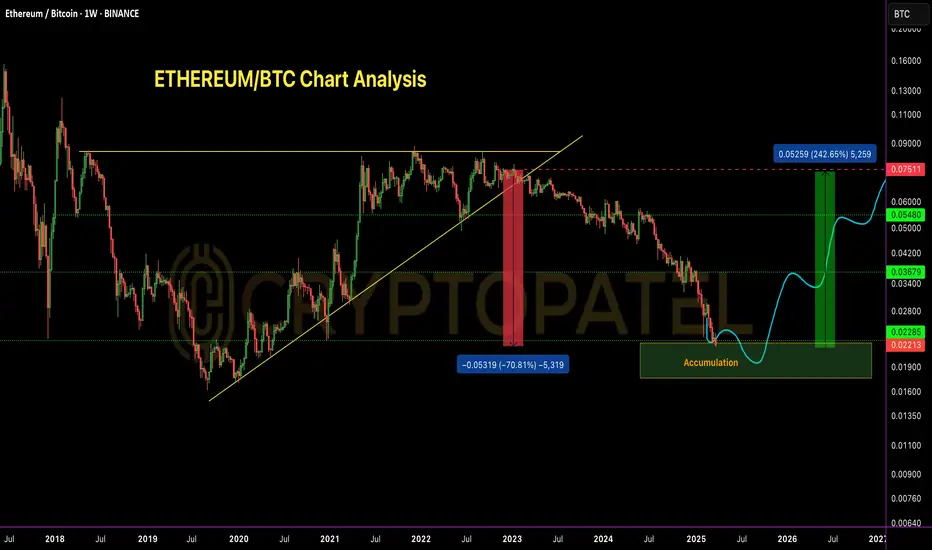
ETH/BTC Profit Update – As Predicted! ( 75% Down From Level )ETH/BTC Profit Update – As Predicted!
Many was Laughing But ETH/BTC is now down 75% from my previous exit call at 0.075 BTC — hope you enjoyed the ride and took profits when it mattered ✅
Current Price: ~0.019 BTC
We are now entering a strong accumulation zone between 0.019–0.015 BTC.
What to do now?
Start accumulating ETH slowly — build a position by buying dips to get a solid average entry for the next cycle.
Bull Market Targets: 0.05 BTC/0.07 BTC/0.09 BTC
Pro tip : Keep these Targets in mind not just for ETH/BTC… but also to plan exits on ETH/USDT during altseason!
This zone could be a game-changer. Act smart. Accumulate patiently.
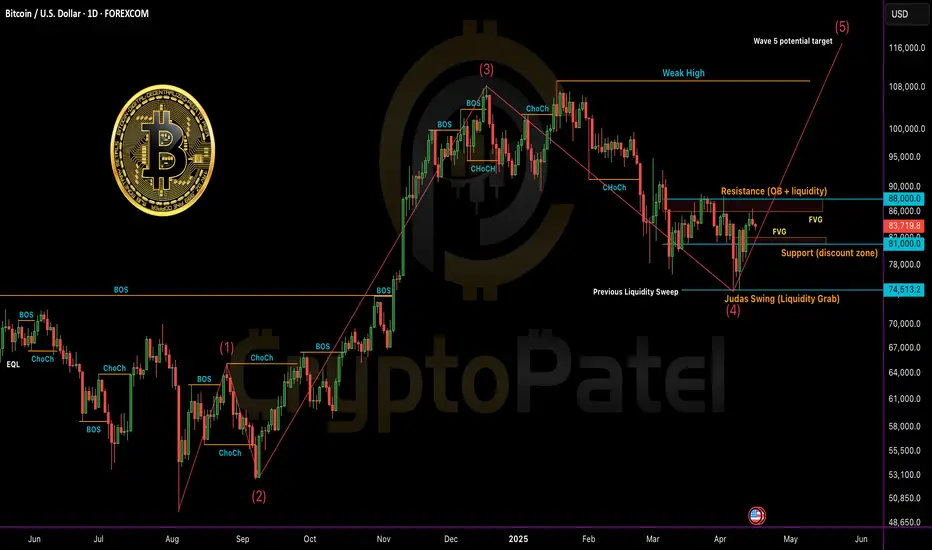
Bitcoin (BTC/USDT) – Full Technical Breakdown - Timeframe: 1DBitcoin (BTC/USDT) – Full Technical Breakdown - Timeframe: 1D
Market Structure & SMC (Smart Money Concepts)
✅ CHoCH (Change of Character) confirmed from $105K top → current lower high around FWB:88K zone.
📉 Break of Structure (BOS) to the downside occurred at $91K.
🟠 Bearish Order Block (OB): $86K– FWB:88K (price currently reacting here).
Liquidity Levels:
Sell-side: Swept at $76K
Buy-side: Sitting above FWB:88K
Fair Value Gap (FVG): Unfilled zone between $81K– GETTEX:82K may act as magnet for price.
ICT Model Alignment
Judas Swing: Sharp liquidity grab below $76K → followed by rebound — classic manipulation before real move.
PD Array Setup:
Resistance: FWB:88K (bearish OB + buy-side liquidity)
Support: $81K (discount zone + FVG)
Elliott Wave Outlook
Wave 1: July–Sept 2024
Wave 3: Nov–Feb rally to $105K (extended wave)
Wave 4: Correction to $76K likely complete
Wave 5 Target: Potential $115K+ if structure holds
Fractal Observation
🔹 Current price structure is mimicking Nov 2023–Jan 2024 pattern
🔹 If history rhymes: consolidation → breakout → retest → parabolic rally
Key Levels to Watch
🔼 Bullish Confirmation: Daily close above FWB:88K → targeting GETTEX:92K –$100K
🔽 Bearish Rejection: Drop below $81K → next support at $74K–$76K
Strategy Summary
🔹 Short-Term Bias: Cautiously Bullish
🔹 Entry Zone: Retest near GETTEX:82K (FVG + OB)
🔹 SL: Below $79.5K
🔹 TP Zones: FWB:88K → GETTEX:92K → GETTEX:98K
📈 R:R = Minimum 1:5 (High confluence)
Keep your eyes on HTF closures and manage risk. Liquidity traps are in play.
Everyone’s yelling “Rugpull!” over $OM because -90%+ But $TRUMP?🚨 Everyone’s yelling “Rugpull!” over CRYPTOCAP:OM because it's down 90%+…
But no one’s talking about the Official Donald Trump token $TRUMP — which also crashed over -90% from its ATH in just 3 months. 🤯
Isn’t that the same thing?
Seriously, what happens to the trader who aped in at $70+?
➡️ Just imagine the bag they're holding now. 😬
➡️ Not every memecoin with a “name tag” is safe.
➡️ Hype isn’t utility. Hype isn’t protection.
Feels scammy or just bad tokenomics?
You tell me. 💬

ETH/USD Bearish Reversal Setup – Targeting $1,470 After ResistanPair: Ethereum / U.S. Dollar (ETH/USD)
Exchange: Coinbase
Timeframe: 15 minutes
Indicators:
EMA 30 (red line): ~1635.82
EMA 200 (blue line): ~1585.79
🟣 Key Levels & Zones
Resistance Zone (Purple Rectangle Top): Around $1,647 – previously tested and rejected.
Support Zone (Purple Rectangle Bottom): Around $1,470 – marked as the "EATARGET POINT".
Current Price: ~$1,645
📉 Bearish Breakdown Setup
Chart Pattern: There’s a potential double top or distribution zone forming near the resistance.
Projection: The price is expected to break below the smaller support zone and drop to the target zone around $1,470.67, representing an 11.13% drop.
Measured Move Tool: Indicates a bearish price target if the price breaks down from the current consolidation.
✅ Confluence
Price is currently hovering under resistance.
EMAs show short-term bullish momentum but could flatten if breakdown confirms.
Support near $1,635 is being tested – a break below could trigger the expected drop.
⚠️ Trading Implications
Short Setup: A trader might look to enter short around $1,647 if breakdown confirmation occurs.
Stop Loss: Just above the resistance zone (~$1,650+).
Take Profit: Near $1,470 zone.

Gold’s New All-Time High Could Be #Bitcoin Signal🚨 Gold’s New All-Time High Could Be #Bitcoin Signal 🟡
And if history repeats, Bitcoin could be next.
Every time #Gold moves first, Bitcoin usually follows with a major rally. If that happens again, we could see a new Bitcoin ATH in Q2-Q4 of 2025.
Are you ready for the next big move? 🚀
CRYPTOCAP:BTC #BullMarket

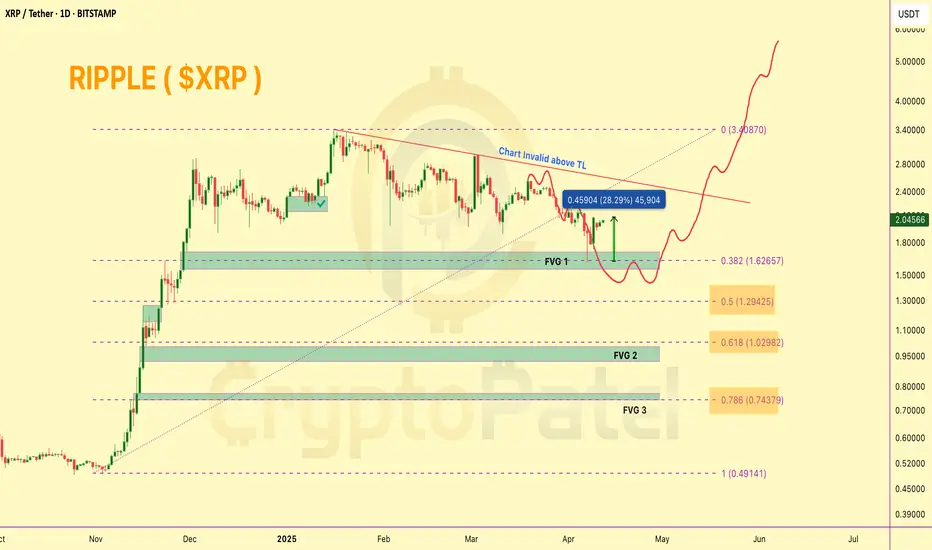
XRP Up 28% From Our Support Call – What’s Next?XRP Up 28% From Our Support Call – What’s Next?
CRYPTOCAP:XRP perfectly respected the FVG 1 zone around $1.60, which we previously marked as a strong support. Since then, price has rebounded over 28% from that level.
Hope you didn’t get caught buying the $2.40–$2.50 zone — as warned, that area showed signs of exhaustion, and price has dropped 30% since.
What’s Next?
If bullish momentum continues, #XRP could revisit the $2.40–$2.50 resistance area. However, this zone may act as a rejection point once again.
From there, we could potentially see a pullback toward $1.30 and $1.00, which aligns with FVG support zones and the 0.5–0.618 Fib retracement levels — key areas where a strong bounce is likely.
🟢 Macro Bias: I remain bullish on XRP/USDT in this cycle and still expect a move toward $7–$10 in the broader bull market. Best entries will likely come during dips into major support zones.
❌ Invalidation Level: This chart setup gets invalidated on an HTF close above $2.50.
Keep it smart — entries on dips, not at tops. 👀
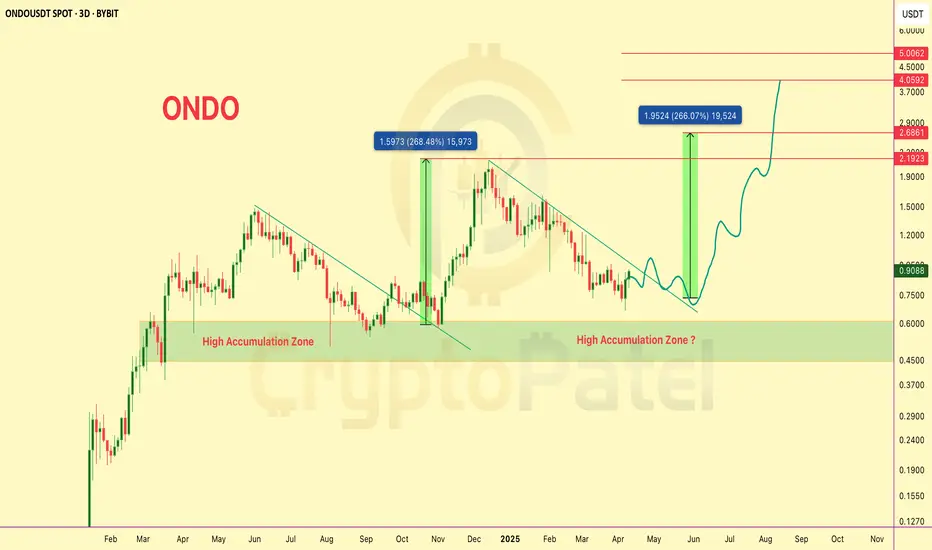
$ONDO/USDT – 3D Chart Analysis (Fractal-Based Outlook)$ONDO/USDT – 3D Chart Analysis (Fractal-Based Outlook)
🔰 Pattern Recognition & Fractal Analysis:
▪️ ONDO previously broke out from a falling wedge pattern in late Q4 2024, resulting in a +268% rally.
▪️ Current price action mirrors that historical fractal, again forming a descending channel with strong demand visible around the $0.60–$0.45 zone — marked as a High Accumulation Zone.
🔰 Current Market Structure:
▪️ Price has respected the descending resistance trendline and now shows signs of breakout attempt.
▪️ A recent bullish engulfing candle near the lower boundary of the accumulation zone suggests potential reversal.
▪️ Volume is picking up, aligning with previous breakout volume behavior.
🔰 Key Technical Zones:
▪️ Accumulation Zone: $0.60 – $0.45
▪️ Immediate Resistance: $1.20 (psychological)
▪️ Breakout Confirmation: Weekly close above $1.30
▪️ Fibonacci Extensions:
1.618 Fib Target: $2.18
2.618 Fib Target: $2.68
Final Bullish Extension: $4.05–$5.00 zone
🔰 Future Projection (Fractal Repeat):
▪️ If breakout mirrors previous fractal, expect ~266% upside — targeting $2.60+ in the next 2–3 months.
▪️ Intermediate pullbacks likely near $1.50 and $2.20 due to historical liquidity zones.
⚠️ Risk Management Note:
▪️ Invalidity below $0.45. If price fails to hold the current range, possible revisit to $0.30–$0.25 range.
▪️ Traders should monitor for volume confirmation and potential bullish divergence on LTFs (Lower Timeframes).
📌 For more real-time analysis, stay tuned. More fractal setups dropping soon.
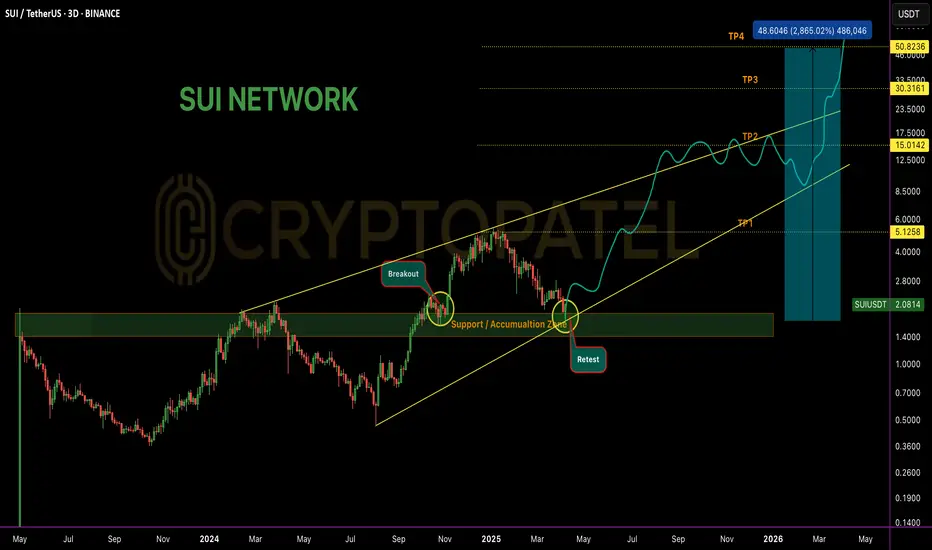
#SUI to $50 in the Future? Which is 25x-30x ?#SUI to $50 in the Future?
I won’t tell you why — because that’s where your research comes in.
But here’s a clue:
▪️ Accumulation Zone: Below or around $2
▪️ Patience = Potential
▪️ Come back and thank me in 3–4 years.
Not Financial Advice — Always DYOR.
The Market Looks Brutal Right Now... But Stay With MeThe Market Looks Brutal Right Now... But Stay With Me
It feels like a bloodbath out there… but here’s the truth:
A fast and brutal dump is honestly better than a slow, painful bleed. It shakes out the weak hands quickly—and sets the stage for stronger recoveries.
We've seen this movie before:
▪️ The Covid flash crash
▪️ War shocks like Russia vs Ukraine
▪️ Black swan events like FTX blowing up
▪️ The chaos of the LUNA death spiral
➡️ Each time, fear dominated the feed.
➡️ Each time, the "This time it's different!" crowd got louder.
➡️ And each time, those who stayed calm and DCA’d into real projects walked away with massive wins.
So why should this time—just because of tariffs or macro FUD—be any different?
It’s not.
Zoom out.
The long-term trend is built on strong fundamentals, not headlines.
Stick to the plan: accumulate multi-cycle, high-cap coins. Ride the wave.
The short-term noise fades, but smart strategy compounds.

Ethereum Spot Bidding Zones - Ethereum is currently trading at 1462$ down 64% from its ATH
- Ethereum has underperformed BTC throughout the whole Crypto cycle and currently its continuing to do the same
- Ethereum has deviated below its important Market Structure Shifts and currently trying to pierce below its origin of the move
- Ethereum has a very good buying interest around 882$-1280$ this is a broader range where you should be keeping your eyes on in order to bid for Ethereum
- Another catalyst that I can see on the board is ETH/BTC pair vs BTC/DOM one is ready to bottom out near its point of interest on the other hand other is ready to top out
- BTC/D bearish and ETH/BTC bullish will print a lot of money in alts watch out both

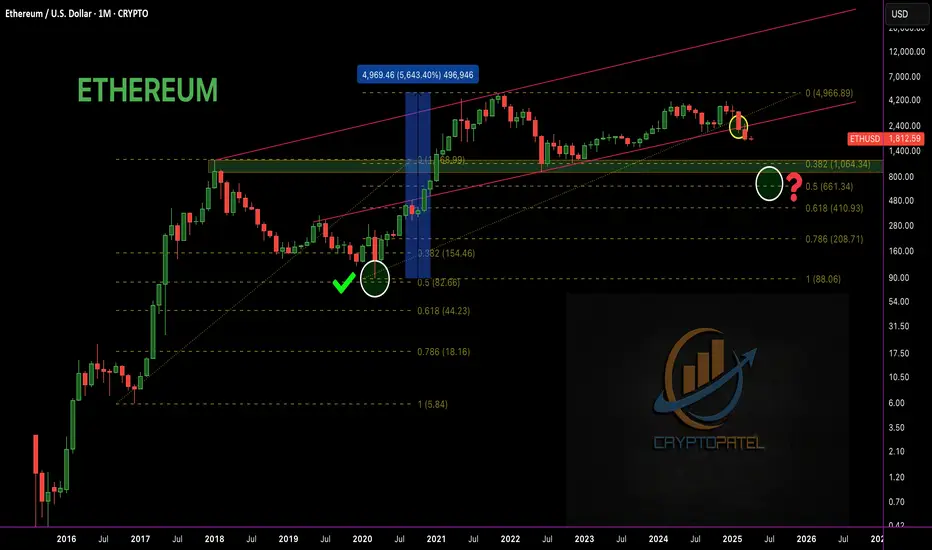
Will $ETH Drop Below $1,000 Before Heading to $7,000+? Will CRYPTOCAP:ETH Drop Below $1,000 Before Heading to $7,000+?
🟣 Historically, #ETH respected the 0.5 Fib retracement in bull markets – In the last bull run, ETH retraced to 0.5 Fib at $89 — then exploded to $4,867
🟣 That’s +56,000% in just 1.5 years!
This cycle, the 0.5 Fib level sits around $661. With the monthly trendline breakdown, the big question is:
Will #Ethereum dip below $1,000 and test $700 before making a new ATH?
If ETH reaches sub-$1,000 zones, I'm personally buying heavy and holding for 1–2 years. No FA – just Fib, patience & conviction.
ETH will reward those who ride the wave, not fear the dip.
Hold strong. Next 1–2 years = massive opportunity.
Bitcoin Fresh Update#Bitcoin 4H Chart Update
🔻 Bearish OB: $86,940 – $87,728
🕳️ FVG: $86,750 – $84,800 (Filled)
📌 Key Level: 4H close above OB = bullish continuation
❌ Rejection = prepare for the next leg down

ETH/BTC – 70% Drop Achieved | Perfect Short ExecutionETH/BTC – 70% Drop Achieved | Perfect Short Execution
As projected in my analysis dated 10th Nov 2022, ETH/BTC has completed the anticipated 70% correction from the top.
Short Entry: 0.075 BTC ✅
TP1: 0.055 BTC – ✅
TP2: 0.037 BTC – ✅
TP3: 0.023 BTC – ✅
All targets achieved with precision.
Bearish structure played out as expected.
Current Outlook:
CRYPTOCAP:ETH Price has now entered a historical demand zone, coinciding with major multi-year support levels.
Accumulation Phase Activated –
Starting to scale into long positions from current levels, targeting mid-to-long term reversal setup.
Patience required – this could be the base of the next macro leg up.
Note: NFA & DYOR
#Ethereum
#Ethereum Is Down Now, But History Says a $10K Rally Is Coming…#Ethereum Is Down Now, But History Says a $10K Rally Is Coming…
1⃣ CRYPTOCAP:ETH rallied 228x post-2016 BTC halving
2⃣ ETH did 27x post-2020 halving
3⃣ Currently -57% from ATH post-2024 halving
📅 Projection: Q4 2025 ATH
🔼 Target Range: $7,000 - $10,000
Based on cyclical trend extension, Fibonacci macro structure, and historical BTC-ETH correlation.
What’s your ETH EOY 2025 target? RT & Comments if you Agree👇
#Altseason
Note: This is Not financial Advice so DYOR before Investing.

$ETH has dropped -40% since Eric Trump recommended buying it.JUST IN : CRYPTOCAP:ETH has dropped -40% since Eric Trump recommended buying it.
Just a gentle reminder to always DYOR (Do Your Own Research) before making investment decisions.
#Ethereum
