EURUSD FIBONACCI RETRACEMENTEURUSD fibonacci retracement for uptrand
buy EURUSD at 1.08490
place stoploss at 1.08320
first target at 1.08976
second target at 1.09286
thank you.
Eurusdlongsetup

EURUSD FORECAST 29TH MARCH 2023EUR/USD Bulls to Target $1.0850 on German Consumer Confidence
It is a relatively busy day for the EUR/USD, with German and French consumer confidence and ECB commentary to draw interest.
The EUR/USD needs to avoid the $1.0829 pivot to target the First Major Resistance Level (R1) at $1.0862. A move through the Tuesday high of $1.08485 would signal a bullish session. However, the EUR/USD needs hawkish ECB chatter and better-than-expected consumer confidence numbers to support a breakout session.
In the case of an extended rally, the bulls will likely test the Second Major Resistance Level (R2) at $1.0882 and resistance at $1.09. The Third Major Resistance Level (R3) sits at $1.0936.
A fall through the pivot would bring the First Major Support Level (S1) at $1.0809 into play. However, barring a data-fueled sell-off, the EUR/USD pair should avoid sub-$1.075. The Second Major Support Level (S2) at $1.0775 should limit the downside. The Third Major Support Level (S3) sits at $1.0721.
Looking at the EMAs and the 4-hourly chart, the EMAs send bullish signals. The EUR/USD sits above the 50-day EMA ($1.07746). The 50-day EMA pulled away from the 100-day EMA, with the 100-day EMA widening from the 200-day EMA, delivering bullish signals.
A hold above the Major Support Levels and the 50-day EMA ($1.07746) would support a breakout from R1 ($1.0862) to give the bulls a run at R2 ($1.0882) and $1.09. However, a fall through S1 ($1.0809) would bring S2 ($1.0775) and the 50-day EMA ($1.07746) into play. A fall through the 50-day EMA would send a bearish signal.

EURUSD HIGH PROBABILITY BUYING ZONE* after every big move there is an inducement and after that eng liquidity
* After taken out this liquidity next big move can come
*So as this rule EUR USD taken out inducement and go for eng liquidity
* Eng liquidity is high probability zone compare to the inducement
* Inducement PROBABILITY is 50/50
And eng liquidity probability 70/30
* So as per rule after taken out eng liquidity the big upward move can come.
*Also there is an IFC(institutional funding
candel) which is high probability ob zone
*As on chart if it happen and taken out minor liquidity as mentioned
*Inducement sign($)
Liquidity sign(*)
BREAK OF STRACTURE SIGN (BOS)
*BEST ENTRY PRICE - 1.06659
STOPLOSS - below the inducement taken out candel as on chart 1.06419
1st target - 1.08056
2nd target - 1.09780

EURUSD 4HRS Indicates Trend Changes(Short to Long Position)EURUSD 4HRS Current price 1.06390
place Order price 1.06982 Above Open Candles
take Profit at 1.10052 (0.0370++)
Stoploss 1.05493 (0.01484--)

EURUSD FX:EURUSD
EURUSD has created a Flag and pole Pattern and Consolidation was happened more than 20 hours which is good and When the price breaks either side then we can plan our trade according to the market conditions.

Eurusd long possible Eurusd buy 1.06778
Sl 1.05200
Tp1 1.07574
Tp2 1.08224
Tp3 1.09029
Tp4 1.10329
Trade based on pure price action
The trade is for educational purposes only not a recommendation

#EUR/USD Upward Movement potential with RIsk:reward =3 #FOREX#FOREX #EUR/USD Buy at 1.06583, SL 1.05933, Target 1.08489
RISK:REWARD 3
ANalysis: Broadening Triangle.
Hey Traders,
HOPE our analysis is adding value to your Stock market trading Journey.
If yes, cheer us with Thumbs up...
NOTE: Published Ideas are for ‘’EDUCATIONAL PURPOSE ONLY’’ trade at your own risk.
NOTE: RESPECT The risk. SL should not be more than 2% of the capital.
Happy Trading

EURUSD BuyFX:EURUSD
EURUSD is in good resistance level at 1.06140 if this level is broken and the price is sustained then we can plan for buy side.
It is formed Flag and pole.


EURUSD 27th Feb ForecastThe EUR/USD needs to move through the $1.0565 pivot to target the First Major Resistance Level (R1) at $1.0594 and the Friday high of $1.06143. A return to $1.06 would signal a bullish session. However, the EUR/USD would need the stats and the ECB chatter to support a breakout session.
In the case of an extended rally, the bulls will likely test the Second Major Resistance Level (R2) at $1.0643. The Third Major Resistance Level (R3) sits at $1.0722.
Failure to move through the pivot would leave the First Major Support Level (S1) at $1.0516 in play. However, barring a data-fueled sell-off, the EUR/USD pair should avoid sub-$1.0450. The Second Major Support Level (S2) at $1.0487 should limit the downside. The Third Major Support Level (S3) sits at $1.0409.
Looking at the EMAs and the 4-hourly chart, the EMAs send a bearish signal. The EUR/USD sits below the 50-day EMA ($1.06397). The 50-day EMA slid back from the 200-day EMA, with the 100-day EMA pulling back from the 200-day EMA, delivering bearish signals.
A move through R1 ($1.0594) would give the bulls a run at the 50-day EMA ($1.06397) and R2 ($1.0643). A move through the 50-day EMA would send a bullish signal. However, failure to move through the 50-day EMA ($1.06397) would leave the Major Support Levels in play.

EURUSD Forcast 24/02/2023The EUR/USD needs to avoid a fall through the $1.0600 pivot to target the First Major Resistance Level (R1) at $1.0623 and the Thursday high of $1.06278. A return to $1.0620 would signal a bullish session. However, the EUR/USD would need today’s stats and the ECB chatter to support a breakout session.
In the case of an extended rally, the bulls will likely test the Second Major Resistance Level (R2) at $1.0651. The Third Major Resistance Level (R3) sits at $1.0701.
A fall through the pivot would bring the First Major Support Level (S1) at $1.0572 into play. However, barring a data-fueled sell-off, the EUR/USD pair should avoid sub-$1.05. The Second Major Support Level (S2) at $1.0549 should limit the downside. The Third Major Support Level (S3) sits at $1.0498.
Looking at the EMAs and the 4-hourly chart, the EMAs send a bearish signal. The EUR/USD sits below the 50-day EMA ($1.06626). The 50-day EMA fell back from the 200-day EMA, with the 100-day EMA pulling back from the 200-day EMA, delivering bearish signals.
A move through R1 ($1.0621) would give the bulls a run at R2 ($1.0651) and the 50-day EMA ($1.06626). A move through the 50-day EMA would send a bullish signal. However, failure to move through the 50-day EMA ($1.06626) would leave the Major Support Levels in play.
The US Session
It is a busy day on the US economic calendar. Personal income, spending, and inflation will be in focus. An unexpected rise in the Core PCE Price Index would fuel bets of a more hawkish Fed. Economists forecast the Core PCE Price Index to rise by 4.3% year-over-year in January. The Index was up 4.4% in December.
Later in the session, consumer sentiment and Fed chatter will also draw interest. FOMC member Loretta Mester will deliver a post-stats speech.

EURUSD Forecast for 22nd Feb,2023The EUR/USD needs to move through the $1.0660 pivot to target the First Major Resistance Level (R1) at $1.0682 and the Tuesday high of $1.06983. A return to $1.0680 would signal a bullish session. However, the EUR/USD would need today’s stats and the Fed minutes to support a breakout session.
In the case of an extended rally, the bulls will likely test the Second Major Resistance Level (R2) at $1.0721. The Third Major Resistance Level (R3) sits at $1.0782.
Failure to move through the pivot would leave the First Major Support Level (S1) at $1.0621 in play. However, barring a data-fueled sell-off, the EUR/USD pair should avoid sub-$1.0550. The Second Major Support Level (S2) at $1.0599 should limit the downside. The Third Major Support Level (S3) sits at $1.0538
Looking at the EMAs and the 4-hourly chart, the EMAs send a bearish signal. The EUR/USD sits below the 50-day EMA ($1.06954). Following the bearish cross on Wednesday, the 50-day EMA pulled further back from the 200-day EMA, with the 100-day EMA closing in on the 200-day EMA, delivering bearish signals.
A move through R1 ($1.0682) and the 50-day EMA ($1.06954) would give the bulls a run at R2 ($1.0721) and the 200-day EMA ($1.07255). A move through the 50-day EMA would send a bullish signal. However, failure to move through the 50-day EMA ($1.06954) would leave the Major Support Levels in play.
It is a relatively quiet day on the US economic calendar. There are no US economic indicators for investors to consider today. The lack of stats will leave the Fed in the spotlight. Late in the US session, the FOMC meeting minutes will draw plenty of interest.
Following the latest round of US economic indicators and hawkish Fed chatter, the markets will dissect the minutes to gauge how far the Fed is willing to go. FOMC member chatter will also influence the dollar, with FOMC member Williams speaking late in the session.

Euro Price ForecastEUR/USD ANALYSIS
Better than expected EZ PMI and ZEW economic sentiment aren’t enough to hold back risk-off environment.
Falling wedge in play which could point to subsequent upside to come.
EURO FUNDAMENTAL BACKDROP
The European trading session kicked off in a positive light this Tuesday from an economic standpoint; beginning with eurozone PMI data (see economic calendar below) which beat expectations on the composite read. Although manufacturing numbers were slightly off the mark, the overall market reaction was positive in terms of the resilience of the region. Growth surprised many analysts considering the winter months which traditionally weighs negatively on the statistic and bodes well for the first quarter period. Declining energy pressures have aided in the disinflationary impact on goods and services thus increasing consumer demand.
That being said, the services sector is still being plagued by sticky wage costs that will continue to add hawkish pressure on the European Central Bank (ECB). The PMI data was then supplemented by a considerable beat on ZEW economic sentiment for February and has reached its highest level since February 2022 reinforcing the optimism within the region.

EURUSD FORCAST FOR 16TH FEB,2023Please pay attention to the following levels and trade set up before opening any position.
15th Feb
DH- 1.07445
DL- 1.06624
16TH FEB
PIVOT - 1.0697
R1- 1.0734, S1- 1.0650
R2- 1.0781, S2- 1.0529
R3- 1.0865, S3- 1.0529
* Pivot needs to be broken in the upward direction to target R1 1.0734 and 1.07445
* Return to 1.07 level shows a bullish behavior
* If the Pivot is not broken then it can come down to S1 1.0650.
* Levels below 1.06 shall be avoided and it may cause major sell off.
* Breakthrough above 1.0734 would give a bull run to 1.07402 and 1.07410.
* A move above 1.07402 would give a bullish signal and can touch R2 1.0781
* Failure to break 1.07402 in the upward direction can bring it down to S1 1.0650
Please support our work by Liking , Following and sharing the Ideas. Thanks

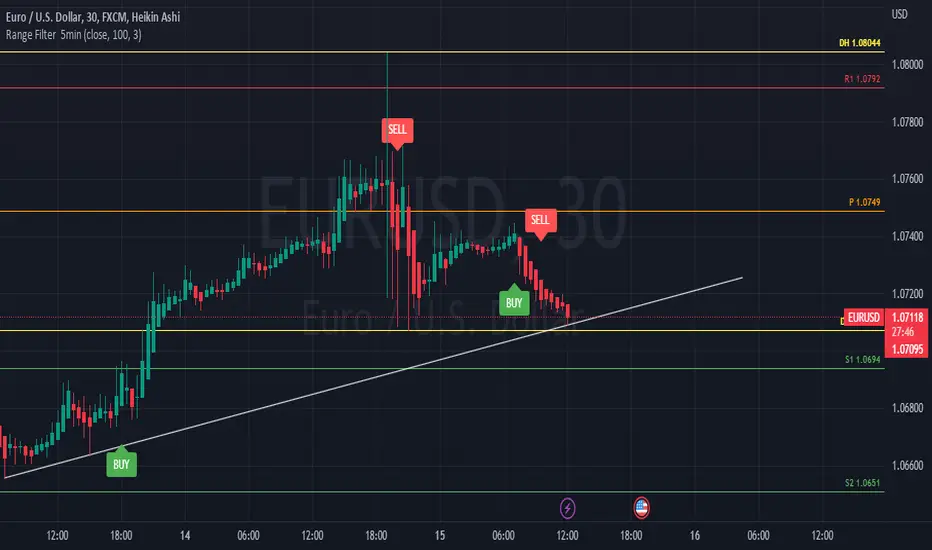
EURUSD Forcast for 15th Feb,2023As a result of CPI, EURUSD touched the 1.08 level on 14th Feb but there was a strong resistance and hence it fell down almost 800 Pips. For a proper trade set up please keep in mind the following levels.
14th Feb
DH - 1.08044
DL - 1.07072
15th Feb
Pivot - 1.0749
R1- 1.0792, S1- 1.0694
R2- 1.0847, S2- 1.0651
R3- 1.0945, S3- 1.0554
* EURUSD should break the pivot in the upward direction to target 1.0792 and 1.08044
* A return to 1.0750 will mark a bullish behavior
* If the Pivot is not broken in the upward direction then we can see a fall to 1.0694
* If the price reaches 1.0650 level then it would probably limit the sell off .
* If the price moves above 1.07438 and 1.07527 then it could give a bull run to 1.07762 and 1.0792
* If it is unable to break 1.07438 then it can come down to 1.0694
If you like our analysis then please Share, Like & Follow US as it highly Motivates us to work harder. Also if you want us to analyses on any other Pairs please feel free to Inbox for leave us a comment. Thanks
EURUSD Forcast for 14th Feb,2023The instrument has finally given up on the bearish scale and now have started showing Bull Trend. Following are some of the levels which needs to be kept in mind while trading today.
13th Feb -
DH - 1.07299
DL - 1.06555
14th Feb
PIVOT - 1.0701
R1- 1.0747, S1- 1.0673
R2- 1.0776, S2- 1.0627
R3- 1.0850, S3- 1.0552
* EURUSD should avoid going below the pivot , so that it can target R1 1.0747
* A move above 1.07299 would signal a bullish session.
* If it falls through the Pivot then it can go down to S1 1.0673
* To avoid extra sell off it should avoid levels below 1.06
* A move above 1.07438 and 1.0747 would give a bull run to 1.07553 and 1.0776
* Failure to break 1.07438 level in the upwards direction would bring EURUSD down to 1.0673
If you love our work please support us by liking and Sharing it. Thanks

Eurusd long analysis Buy eurusd @ 0.97850
Stop loss 0.97350
Target one 0.98050
Target two 0.98550
Target three 0.98850
Trade based one price action and london session
Three target given


EURUSDDear traders,
as I have become accustomed to in recent months and this time my technical analysis had an accuracy rate of over 95% and I will try to continue to keep this percentage as long as possible
As I said last weeks..EU hit the first target I told you about a few weeks ago and rejected 120-150 pips as I told you last week!
In the next period I think it will reach the psychological threshold of 1.2 from where I expect to continue the descent to target number 2
THIS WEEK...as I said last week the EU went up again in the area 1.19500-1.2 from where it went down again!
as you can see on the chart for 1 week, I expect that in the next period the EU will range in the area 1.18500-1.2, following that at the first weekly closing above these values to give the trend of the next period..but, I still bet on SELL until at target 2!
ATTENTION: do not try to play without confirmation because the EU rejected from the Fibonacci 786 area and could force the ascent again ...
NOTE: Please, give a LIKE if you find this idea useful!
GREAT ATTENTION:
*This information is not a Financial Advice.

EURUSDDear traders,
as I have become accustomed to in recent months and this time my technical analysis had an accuracy rate of over 95% and I will try to continue to keep this percentage as long as possible
As I said last weeks...the movement was much more aggressive and much stronger than we anticipated this week and it approached my finalk target very quickly for the next period!
Even if it rejects from this area and goes up 100-150 pips, I think the final target is still the area 1.17-1.16200
THIS WEEK...EU hit the first target I told you about a few weeks ago and rejected 120-150 pips as I told you last week!
In the next period I think it will reach the psychological threshold of 1.2 from where I expect to continue the descent to target number 2
NOTE: Please, give a LIKE if you find this idea useful!
GREAT ATTENTION:
*This information is not a Financial Advice.

EURUSDDear traders,
as I have become accustomed to in recent months and this time my technical analysis had an accuracy rate of over 95% and I will try to continue to keep this percentage as long as possible
As I said last weeks... the structure of the 2 circles remains the same and the 10th candle closed on the descent and rejected as I told you from the trend line for 1 month!
For next week I will be looking for SELL for 70-80 pips that were made during the NFP and after ... I will be looking for SELL until the 1.19500 area in the next period
THIS WEEK...the movement was much more aggressive and much stronger than we anticipated this week and it approached my finalk target very quickly for the next period!
Even if it rejects from this area and goes up 100-150 pips, I think the final target is still the area 1.17-1.16200
NOTE: Please, give a LIKE if you find this idea useful!
GREAT ATTENTION:
*This information is not a Financial Advice.

EURUSD Swing tradeEURUSD is in a strong uptrend in the daily timeframe and came down for a deeper correction. Going down to the lower timeframe the market has shifted from a bearish market to a bullish market. That is the reason we are in this trade.

EURUSD , Weekly analysis , Sep 28 - Oct 2Dear traders,
Wishes all for the new week ahead,
Euro against US Dollar , experienced the September with bearish momentum , End of the week this pair closed at the support area , this long time support area may sends the price up to 1.75 area, from there it may have a chance to come down from the mid of the week,
since we are in the closing of the month , this pair expected to shows some retracement before starting a new path from the new month..
