EURUSD Weekly Outlook (SMC + HTF Resistance Confluence)📊 Market Structure Overview
EURUSD is currently trading into a major weekly supply / resistance zone while respecting a long-term descending trendline connecting multiple swing highs. Price has approached this area several times historically and reacted with strong bearish momentum — making it a high-probability reaction zone on the HTF.
🔎 Key Technical Observations
Price is testing a multi-year descending trendline → strong dynamic resistance.
Presence of SMC concepts on chart: BOS / CHoCH and visible FVG zones below current price.
Current rally looks like a liquidity grab into premium pricing within weekly structure.
Equal / relative highs marked — potential buy-side liquidity before reversal.
HTF structure overall remains bearish / corrective, not a confirmed bullish trend reversal.
📍 Trading Plan (Idea — Not Financial Advice)
➡️ Primary Bias: Bearish from weekly resistance.
➡️ Entry Concept:
Wait for lower-timeframe confirmation such as:
Bearish engulfing candle
Pin bar rejection
Market structure shift / CHoCH
➡️ Targets:
First reaction → mid FVG / internal demand
Major target → HTF demand zone around parity region (~1.00 area)
Extended bearish scenario → deeper weekly demand near lower red zone
⚠️ Risk Factors / Invalidation
Strong weekly close above trendline and resistance zone.
Bullish continuation with sustained higher highs + higher lows on HTF.
Macro catalysts (ECB/Fed policy shifts) could accelerate volatility.
🧠 Final Thoughts
This setup aligns with a classic premium sell model — price rallies into HTF supply + trendline confluence before targeting imbalances below. Patience is key: confirmation matters more than prediction.
Eurusdprediction

EURUSD Technical Overview (1H Timeframe)EURUSD remains positioned within a corrective market structure following a strong bearish displacement from the higher-timeframe supply zone. The sharp rejection from the 1.1830 to 1.1850 region highlights the validity of the identified bearish order block, indicating active institutional supply and reinforcing a short-term downside bias.
Market Structure
The broader structure suggests that the recent decline was impulsive, while the ongoing upside movement appears corrective in nature. Price action has transitioned into a consolidation range, reflecting temporary balance rather than a confirmed reversal. The absence of strong bullish displacement further supports the view that buyers currently lack sufficient momentum to shift order flow.
Smart Money Perspective
From a liquidity standpoint, the current upward movement is likely engineered to target buy-side liquidity resting above recent highs. A controlled push into the premium zone would allow larger participants to optimize short positioning and potentially establish a lower high.
A rejection from the supply area would confirm continued institutional control and strengthen the probability of bearish continuation.
Key Levels to Monitor
Supply / Bearish Order Block: 1.1830 – 1.1850
Immediate Liquidity Target (Upside): Equal highs above the recent range
Downside Objective: 1.1760 discount zone, where sell-side liquidity is expected to rest
Trade Narrative
Primary Scenario:
A liquidity sweep into the order block followed by bearish confirmation could initiate the next leg lower, maintaining alignment with the prevailing order flow.
Invalidation Scenario:
A decisive break and sustained acceptance above the supply zone would weaken the bearish thesis and signal the potential for a deeper retracement, possibly shifting short-term structure toward bullish conditions.
Directional Bias
Short-Term Bias: Bearish while price remains below the order block.
Expectation: Corrective rally into supply followed by continuation to the downside.

EUR/USD HTF bias clarityThe dollar begins to free fall and as eurusd is clearly stronger as we can see with the marked smt divergence , the closest liquidity is marked as followed with the chart.
The HTF aligned is "3month<1day<4hr.

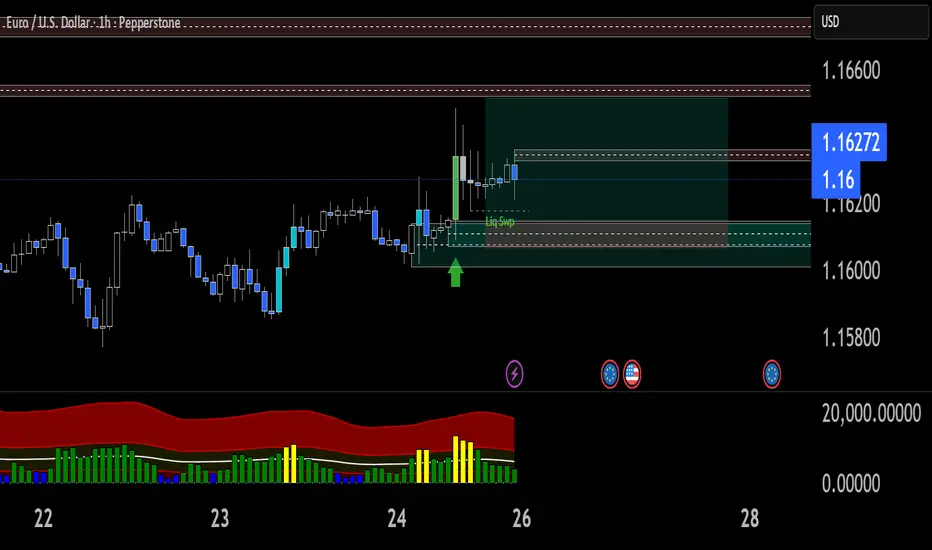
EUR/USD Bullish Setup – Liquidity Sweep & Break of StructureI’m sharing a long trade setup on EUR/USD based on a liquidity sweep and bullish market structure shift.
Price swept liquidity below the recent swing low and immediately showed strong bullish reaction, indicating absorption of sell-side liquidity. Following the sweep, price broke above short-term structure and retested the demand zone, confirming bullish intent.
I entered long at the retest of the demand area, with my stop-loss placed just below the liquidity sweep low to protect against invalidation. The take-profit target aligns with the next major supply zone / equal highs.
Trade Details:
Entry: 1.16147
Stop-Loss: 1.16066 (below liquidity sweep area)
Take-Profit: 1.16515 (major resistance/target zone)
Risk-to-Reward Ratio: 1:4.5+
Why this trade?
Liquidity sweep below previous lows (manipulation phase)
Break of structure to the upside confirming bullish momentum
Retest of demand zone with bullish candle confirmation
Volume spike supporting buyers entering the market
If price holds above the retest zone, I expect continuation to the upside toward the marked target area.
EURUSD - BEARS BACK IN CONTROL?Symbol - EURUSD
EURUSD continues to extend its downward trajectory, maintaining a locally bearish market structure. A decisive breakdown of the nearest support level could accelerate the sell-off, paving the way for fresh lows.
The US dollar remains firm, while the pair shifts its medium-term direction following a breakout from consolidation. The overall structure remains weak, and the decline may extend toward the 1.1400 region.
The primary focus remains on the ongoing consolidation forming within the broader downtrend. Sustained trading below 1.1588 and a daily close beneath 1.1557 would reinforce bearish sentiment, potentially triggering a move toward the liquidity zone at 1.1460 – 1.1400
Resistance levels: 1.1588, 1.1630
Support levels: 1.1557, 1.1461
On the daily timeframe, the market has confirmed a reversal in trend, with a local bearish distribution phase developing. The area of liquidity that may attract price activity lies below 1.1400, suggesting that a medium-term decline remains probable if the price closes beneath 1.1557

Euro Dollar Analysis – Corrective Rebound or Bearish Setup?EUR/USD continues to operate within a controlled market cycle. The sharp decline earlier this week highlighted strong bearish momentum, followed by a corrective rebound that served as a liquidity reset. This rebound is less about trend reversal and more about rebalancing order flow after an aggressive selloff.
The current structure suggests the market may still seek liquidity higher before resuming its dominant direction. A sweep toward the 1.1780 area could attract late buyers, providing larger players the opportunity to offload positions before driving price lower again.
Overall, EUR/USD remains tilted toward the downside. The corrective phase is acting as a preparation stage, positioning the pair for another potential bearish leg once redistribution completes.

Is EUR/USD Setting Up for a Massive Bullish Move?My EUR/USD analysis is a multi-timeframe forecast focusing on key institutional levels. The daily chart provides a long-term perspective, showing the pair in a consolidation phase after a significant downtrend. I've identified a very powerful sell zone from 2020 that represents a major historical resistance level. I expect sellers to enter the market if the price re-approaches this area.
On the 4-hour chart, the focus shifts to the immediate price action. The pair is currently in a tight consolidating range. My strategy is to wait patiently for a clear breakout from this range. I have identified a Green Order Block (OB) and a Buyer Liquidity zone below the current price. My primary thesis is that the price may drop to these levels to grab liquidity before a larger move upwards.
I've outlined two potential bullish scenarios, both of which target the major sell zone. The first (blue arrow) involves a drop to the buyer liquidity zone before the rally, while the second (white arrow) predicts a more direct breakout. A key part of my plan is to look for confirmation on a lower timeframe, such as a change of character, before entering a long position.
In essence, my analysis is a road map for a potential long trade, but it emphasizes patience, confirmation, and a rule-based approach. The core idea is to follow institutional footprints by targeting liquidity zones and trading with the expected direction of smart money. I will not enter a trade until my specific breakout criteria are met, ensuring a high-probability setup.

EURUSD(20250912) Today's AnalysisMarket News:
U.S. initial jobless claims surged to 263,000 in the week ending September 6, reaching a near four-year high. Traders are fully pricing in three Federal Reserve interest rate cuts by the end of 2025.
Technical Analysis:
Today's Buy/Sell Levels:
1.1712
Support and Resistance Levels:
1.1798
1.1766
1.1745
1.1679
1.1658
1.1626
Trading Strategy:
If the price breaks above 1.1745, consider entering a buy position, with the first target price at 1.1766.
If the price breaks below 1.1712, consider entering a sell position, with the first target price at 1.1679

EURUSD(20250909) Today's AnalysisMarket News:
New York Fed Survey: Consumers expect unemployment and job losses to rise, and the Fed is expected to cut interest rates next week.
Technical Analysis:
Today's Buy/Sell Levels:
1.1743
Support and Resistance Levels:
1.1804
1.1781
1.1766
1.1719
1.1704
1.1681
Trading Strategy:
If the price breaks above 1.1766, consider buying, with the first target price at 1.1781.
If the price breaks below 1.1743, consider selling, with the first target price at 1.1719

EURUSD(20250905) Today's AnalysisMarket News:
The US August "Non-Farm Payrolls" report came in at 54,000, below the expected 65,000. The previous figure was revised up from 104,000 to 106,000. Initial jobless claims rose unexpectedly to 237,000 last week, the highest level since June.
Technical Analysis:
Today's Buy/Sell Levels:
1.1648
Support and Resistance Levels:
1.1688
1.1673
1.1664
1.1633
1.1624
1.1609
Trading Strategy:
On a breakout above 1.1648, consider a buy entry, with the first target at 1.1664.
On a breakout below 1.1633, consider a sell entry, with the first target at 1.1624.

EUR/USD Buy Setup from Support Zone towards 1.1743 TargetEUR/USD 2H Chart Analysis
The chart shows EUR/USD trading within a rising channel, with the price currently retesting the support zone (1.1600–1.1620).
Trend & Structure: Price has been respecting channel support and resistance. Currently, it bounced off the lower boundary of the channel, signaling a potential bullish reversal.
Support & Resistance: Strong support at 1.1600 zone, resistance/target at 1.1743.
Moving Averages: EMA 70 (1.1655) and EMA 200 (1.1648) are near, acting as dynamic resistance. A bullish break above them confirms upside continuation.
Candlestick & Momentum: Long wicks near support indicate buyer interest, suggesting accumulation before reversal.
Risk Management: Stop loss should be placed just below 1.1580 (last swing low).
✅ BUY Setup: From 1.1600–1.1620 support zone, targeting 1.1743 with stop loss below 1.1580.
📊 Strategies Used: Trendline channel, EMA confirmation, support/resistance, candlestick patterns, and risk-reward setup.

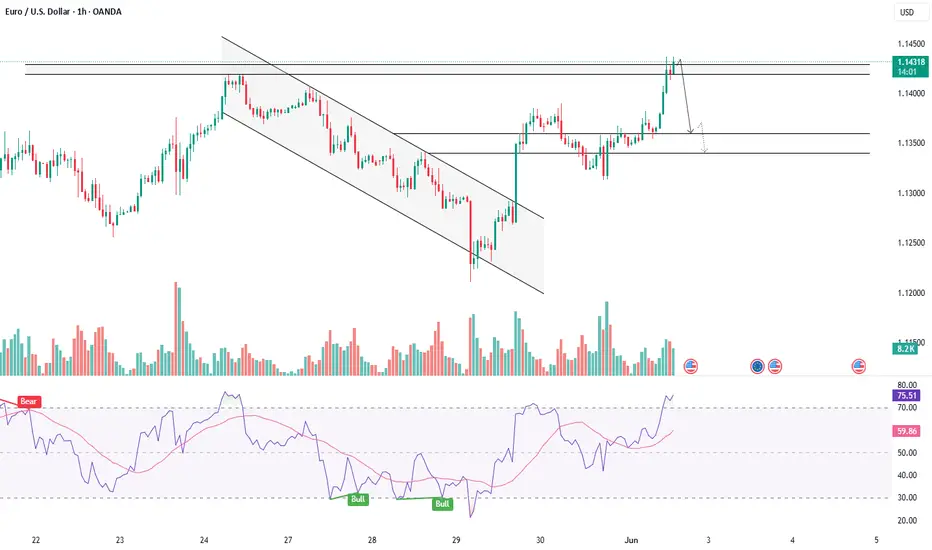
EUR/USD Bearish Rejection at Resistance Zone – Target 1.15392📉 EUR/USD 1H Chart Analysis
Trend: The chart is showing a clear bearish trend inside a descending channel (support & rejection lines). Price continues to respect this downward structure.
Resistance Zone: A strong supply/resistance area is marked at 1.16148 – 1.16307 (highlighted in pink). Sellers are likely to defend this zone.
Indicators:
Price is trading below the 70 EMA and 200 EMA, confirming bearish momentum.
EMA crossover suggests continued downward pressure.
Price Action: Recently, a small pullback (yellow highlight) is visible after touching the lower boundary of the channel, indicating a short-term retracement before another bearish push.
Strategy:
📍 Entry: Look for short entries near the resistance zone (1.16148 – 1.16307).
⛔ Stop Loss: Above 1.16456 (previous high / EMA resistance).
🎯 Target: First target 1.15392, aligning with the projected channel support and marked demand area.
✅ Summary:
EUR/USD remains bearish as long as price stays below the EMAs and inside the descending channel. Expect rejection from the resistance zone and continuation to the downside toward 1.15392.

EURUSD TankThis looks like a very good spot to SELL the EURUSD. Economic factors are showing slightly weak US dollar, but COT reports indicate Commercials still have a lot of LONG contracts. This gives a very nice confluence with a 61.8% retracement of last week's bearish move, also paired with an attractive $1.70 price tag along with it.

EUR/USD Potential Rejection from ResistanceTechnical Overview:
The EUR/USD chart exhibits signs of a bearish reversal pattern forming near a key resistance zone (1.15800 - 1.16000), highlighted with repeated rejection wicks (🔴 red arrows). Price is currently trading at 1.15222, after failing to hold above the neckline of the rounded bottom pattern.
🔍 Key Observations:
🔺 Resistance Zone: Strong resistance has been confirmed multiple times (red arrows), indicating sellers are active at the top.
🟠 Double Top / Head & Shoulders Behavior: Price action shows topping formations (highlighted with orange circles), suggesting exhaustion of bullish momentum.
📉 Bearish Breakdown Possibility:
Price rejected near neckline and is showing bearish candle formations.
Breakdown from the current consolidation zone could push price toward the target zone at 1.14491, marked in purple.
This aligns with previous support structure, reinforcing a technical downside projection.
🔻 Support Zone: Around 1.13800 - 1.14000 is a strong area of demand and may act as the next bounce point if the bearish move continues.
📐 Chart Pattern Structure:
Rounded bottom formed earlier, but the failure to continue higher and breakout suggests a false breakout trap for buyers.
Downward sloping trendline broke, but now price is struggling to sustain above previous highs.
📌 Conclusion:
⚠️ Caution for bulls as price shows signs of weakness at resistance. A move below 1.15000 may initiate further downside toward 1.14491 and possibly lower. Short-term traders can watch for confirmation candles near this zone for entries.
📅 Short-Term Bias: Bearish
🎯 Target: 1.14491
⛔️ Invalidation: Strong breakout above 1.16000

EUR/USD 4H Analysis – Bearish Outlook with Key Levels📉 EUR/USD 4H Analysis – Bearish Outlook with Key Levels 📊
🔍 Overview:
The EUR/USD pair on the 4-hour chart is showing signs of a potential bearish reversal after testing a strong resistance zone near 1.16000. Price action has rejected this area twice (🔴), confirming it as a significant supply zone. The chart now suggests a descending move toward the strong support zone around 1.12000.
🔑 Key Levels:
🟡 Resistance Zone: 1.15700 – 1.16000
Multiple rejections indicate strong selling pressure.
🟦 Mini Support: Around 1.14550
A minor level where price could react short-term, but not a major barrier.
🔻 Mid-Level Target: 1.13653
Potential bounce zone before continuation downward.
🟥 Strong Support Zone: 1.11500 – 1.12200
Previously held as a launch point for a major rally in May; likely to be tested again.
📈 Scenario Outlook:
Bearish Path Expected:
Price is forming a series of lower highs and appears to be losing bullish momentum.
Target Path (Blue Arrows):
A potential drop toward the 1.13653 level is expected, followed by a deeper drop toward the strong support.
Rebound Possibility:
If the strong support holds, we could see a strong bullish bounce 🔄, potentially creating a longer-term buying opportunity.
💡 Conclusion:
EUR/USD is currently in a correction phase. Traders should watch for a confirmed break below 1.14550 for bearish continuation 📉. A drop to the 1.12000 zone may offer a high-probability reversal setup 📊📍.
🔔 Trading Tip:
Use caution around mini support; aggressive sellers may enter on any weak bounce. Wait for confirmation before entering positions. 🧠📉

EUR/USD Bearish Reversal in Channel EUR/USD Bearish Reversal in Channel 📉🔻
📊 Technical Analysis Overview:
The EUR/USD pair is showing clear bearish pressure after hitting a key resistance zone near 1.16500, which aligns with the upper boundary of the ascending channel 📐.
🔺 Resistance Area:
Price reacted strongly to the 1.16500–1.16000 resistance zone (marked with red arrows ⬇️).
Double rejection near this level confirms seller dominance.
📉 Bearish Structure:
Price is forming lower highs, suggesting weakening bullish momentum.
The current pattern implies a potential head and shoulders or rising wedge breakdown.
🎯 Target Levels:
Primary Target: 1.13560 🔽 (short-term key support marked in purple).
Extended Target: 1.12000–1.12500 zone 🧲 (major support area at the lower boundary of the channel).
📎 Support Zone:
Historical bounce region around 1.12000–1.12500 is a strong demand area.
🔍 Conclusion:
If price breaks below 1.13560, it opens the path for a deeper drop toward the broader support range. Traders should monitor for confirmation signals below that level 📉🚨.
⚠️ Recommendation:
Bearish bias remains valid unless price breaks back above 1.15500. Look for pullbacks for short entries. Tight risk management advised! 💼📉

EUR USD 15 ANALYSIS AND TARGETAS market have taken all buyside liquiduty it is goignt for sell side....i have marked the todays target .....for more updates follow me

EURUSD - FALSE BREAKOUT MAY TRIGGER CORRECTIONSymbol - EURUSD
CMP - 1.1431
EURUSD is appreciating amid a weakening US dollar. However, the pair is facing significant resistance and exhibiting signs of a false breakout, which may precede a corrective movement.
EURUSD is currently testing a key resistance zone within a distribution phase and displaying characteristics of a potential false breakout. While the broader market structure remains bullish - evidenced by the pair breaching local resistance and establishing new highs. The failure to sustain upward momentum and the price consolidating below the 1.1418 level may act as a catalyst for a correction. Concurrently, the US dollar is approaching a support level and may initiate a rebound, exerting downward pressure on EURUSD.
Resistance levels: 1.1440, 1.1424, 1.1418
Support levels: 1.1384, 1.1343
Should the currency pair fail to establish a firm position above 1.1424 during the ongoing resistance retest, the likelihood of a downward consolidation increases, potentially presenting an opportunity for short positioning. The anticipated correction could extend toward the identified support zones before the broader uptrend resumes.
EUR/USD4H Bearish Trade Setup Supply Zone Rejection with 3:1 RRR🔷 Trend Overview
📈 Price was in a rising channel (trend line + support line).
❌ Channel broken on downside → potential trend reversal.
🟧 🔼 Supply Zone (Sell Area)
📍 Zone: 1.13707 – 1.14432
🟠 Price faced rejection here.
💡 Institutional selling likely in this zone.
🔥 This is the ideal short-entry area.
🟦 🔽 Entry Point
🎯 Entry: Around 1.13694
🧩 Sits just below supply zone = safer trigger.
✅ Wait for a bearish confirmation candle before entering.
🟨 Support Level
📉 Support Zone: ~1.13100 – 1.13400
📊 Recently broken with a strong bearish candle.
🧱 Used to act as a floor, now may act as resistance.
🟩 🎯 Target Point
✅ Take Profit: 1.10970
📎 Matches previous structure support.
💰 Lock in profits before the psychological level at 1.1100.
🟥 ⛔ Stop Loss
❌ Stop: 1.14419
📏 Placed above the supply zone for protection.
🛡️ Shields from false breakouts or spikes.
⚖️ Risk-to-Reward Ratio (RRR)
💡 Approx. 3:1 ✅
📉 Risk: ~70 pips
📈 Reward: ~270 pips
🔥 High-probability setup
📌 EMA (Exponential Moving Average – 70)
📍 EMA 70 at 1.13102
🔻 Price is below the EMA → favors bearish momentum
🧠 Pro Tips:
🔍 Watch for bearish engulfing or rejection candles at the entry zone.
🗓️ Be aware of major news events (ECB, Fed).
🧮 Adjust lot size for risk management (based on SL size).
✅ Summary:
🧩 Element 📊 Value
Trade Type 🔻 Short (Sell)
Entry Point 📌 1.13694
Stop Loss ⛔ 1.14419
Take Profit 🎯 1.10970
RRR ⚖️ ~3:1
Sentiment 📉 Bearish

EUR/USD 4H Chart Analysis – May 29, 2025🔍 Market Structure Overview
Current Price: 1.12753
Key Zone: Price is hovering at a critical resistance-turned-support area.
🧱 Key Levels
Resistance Zone: 1.15639 (🔝 Main Target)
Support Zone: 1.10736 (🔻 Main Target)
Intermediate Zones:
Target One (Bullish): 1.14139 📈
Target One (Bearish): 1.11687 📉
🔄 Scenario Outlook
📈 Bullish Scenario:
If price holds above the 1.1275 zone, we could see a climb towards:
1.14139 (minor target)
1.15639 (major resistance & final target)
🚀 Breakout above could indicate continuation of higher highs.
📉 Bearish Scenario:
Failure to hold above 1.1275 could push price lower:
First support at 1.11687
Final drop towards 1.10736 support zone
🪓 Breakdown could confirm lower low structure.
🧠 Conclusion
This is a decision point zone. Wait for confirmation before jumping in. A strong bullish or bearish candle at this level will dictate the next move. Risk management is key here! 🎯

EUR/CAD Bearish Setup – Supply Zone Reversal Trade Plan"Trend:
⬆️ Uptrend (past) → 🔄 CHoCH (Change of Character) → ⬇️ Potential Downtrend
1. Pattern Formed:
📐 Rising Wedge → Bearish Reversal Pattern
➡️ Price broke structure at the bottom = CHoCH ⚠️
2. Supply Zone:
🟧 Supply Zone = 1.56580 - 1.56602
🔄 Price may pull back here before dropping
📍This is your ENTRY ZONE
3. Trade Setup:
🔵 Entry Point:
* 1.56580 (Inside Supply Zone)
❌ Stop Loss:
* 1.57176
* Just above swing high & supply zone 🛑
✅ Take Profit Target:
* 1.54370
* Strong previous support zone 💰
4. Indicators:
📉 EMA (47) = Acting as resistance
* Price is currently below EMA ➡️ Bearish signal
TRADE PLAN OVERVIEW:
* 🎯 Entry: 1.56580
* ⛔ Stop Loss: 1.57176
* 💸 Take Profit: 1.54370
* ⚖️ Risk/Reward Ratio: 1:3 (Great!)
Summary:
* Wait for rejection or bearish candle in supply zone
* Enter short
* Ride it down to the target
* Manage risk smartly ✅

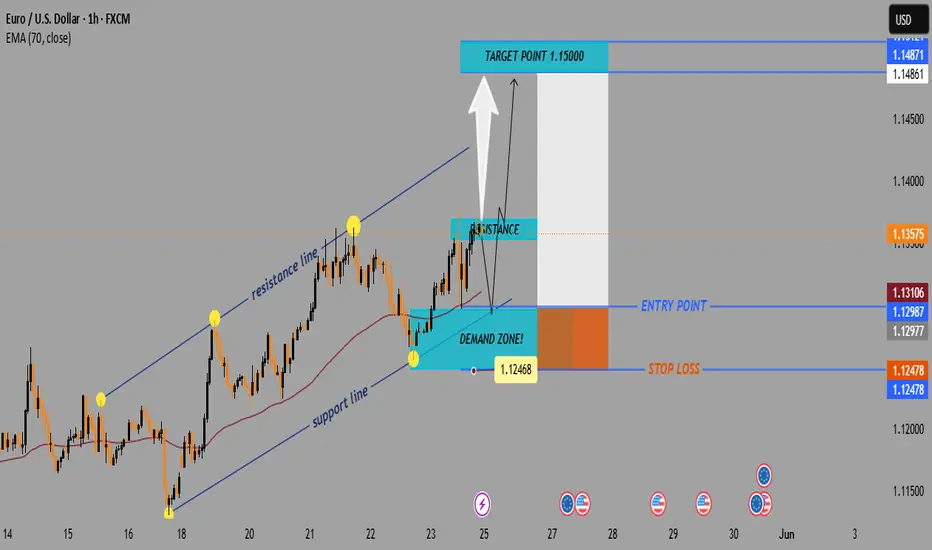
EUR/USD Bullish Trade Setup – Demand Zone to 1.15000 TargetTrend Overview:
↗️ Uptrend Channel
Support Line (Bottom of channel): Holding the upward price movement.
Resistance Line (Top of channel): Price touches and retraces — a key watch level.
Key Zones:
🟦 Demand Zone (BUY Area)
🟢 1.12468 – 1.12987
Strong support.
Price may bounce from here if retested.
Buyers likely to activate here.
🟥 Resistance Zone
🔴 Around 1.13575
Price faces selling pressure.
If broken, could signal a bullish continuation.
Entry & Exit Strategy:
🎯 Target Point: 1.15000 (Marked in blue above)
🚀 Bullish Target
Above the resistance, indicating breakout potential.
📍 Entry Point: 1.12987 – 1.13106
Slightly above the demand zone.
🛑 Stop Loss: 1.12478
Just below the demand zone for risk control.
EMA (70) Line:
📈 Currently at 1.13106
Price is trading above the EMA = bullish signal.
Scenario Summary:
Bullish Setup
✅ Wait for a pullback into the demand zone
✅ Enter near the blue entry area
✅ Target the 1.15000 zone
✅ Risk managed by stop-loss just below demand zone
EUR/USD Bearish Setup: Supply Zone Rejection Toward1.0900 Target(Swing Trade Setup)
📉 Trendline + CHoCH Confirmation
🔻 Downtrend marked by a falling blue trendline.
🔄 CHoCH (Change of Character) shows a bearish market structure shift, confirmed by a lower low.
🟦 Supply Zone (Sell Zone)
💥 Strong seller reaction previously occurred between:
1.12956 – 1.13896
🔹 Wait for price to retrace into this zone.
🎯 Ideal for short entries.
🎯 Entry & Stop-Loss
🔵 Entry Point: Around 1.12956 – 1.13005
(below supply zone and EMA)
🛑 Stop Loss: 1.13896 – 1.13929
(above the last high + supply zone)
🟦 EMA 70 (Purple Line)
📈 Currently at 1.13051
Acts as dynamic resistance — strengthening the short setup.
🏁 Target Zone
🎯 Main Target: 1.09000
Marked as TARGET POINT 1.0900
🟦 Support Levels Inside Target Zone:
1.09229
1.09150
1.08814
✅ Summary of Trade Idea
📍 Short Position
⬆️ Entry: ~1.13000
🛑 Stop Loss: ~1.13900
⬇️ Take Profit: ~1.09000
⚖️ Risk-to-Reward: ~1:3+ potential
