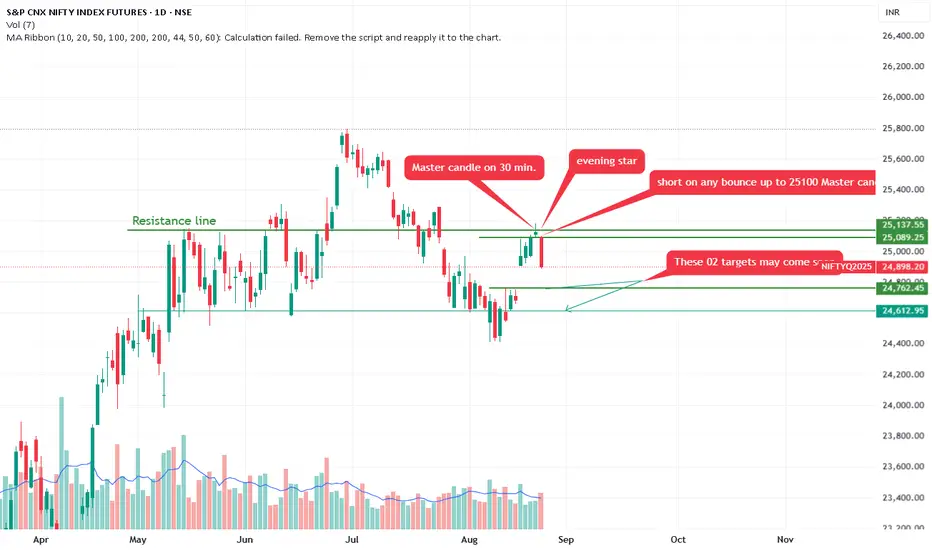
Nifty form Bearish Evening star. Correction expected.Annotations Patterns:
Master Candle on 30 min. Evening Star: Points to the recent high. A "master candle" refers to a large-range candle (here, likely on a 30-minute timeframe) that encompasses subsequent smaller candles, Combined with an "evening star" pattern—a three-candle bearish reversal (large green candle, small-bodied doji/star, followed by a large red candle closing below the first's midpoint)—this suggests a topping formation and potential for further downside.
Short on Any Bounce Up to 25,000-25,100 Master Candle Low.
Recommends selling (shorting) if price rebounds to 25,000-25,100 (labeled as the master candle's low, acting as resistance on pullback).
These 02 Targets May Come Soon: Arrows to lower levels (~24,793 and possibly 24,613), implying quick downside targets.
A downward-sloping green trendline projects further decline.
Overall Trend: The chart depicts a bull market correction or potential reversal. After months of gains, momentum has shifted bearish, with price breaking below key supports (e.g., the green line at 25,137). Higher volume on declines reinforces this.
The chart's creator appears to have a bearish bias, focusing on reversal patterns and downside projections.
Evening Star
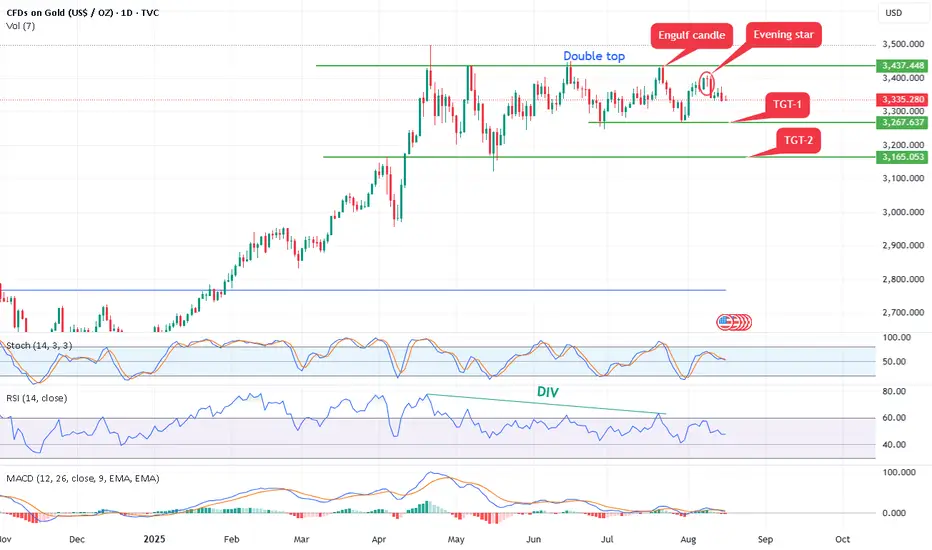
Gold form double top bearish pattern,Bearish Patterns Annotated:
Double Top: A classic bearish reversal pattern resembling an "M" shape. It occurs when price hits resistance twice at similar levels (here, approximately $3,437 and $3,448 in July and August) and fails to break higher. This signals potential exhaustion of buyers and a shift to sellers.
Evening Star: A three-candle bearish reversal pattern marked near the recent high. It typically consists of a large green candle (up day), followed by a small-bodied candle (indecision), and then a large red candle closing below the midpoint of the first candle. This suggests bulls are losing control.
Engulf Candle (Bearish Engulfing): A red candle that completely "engulfs" the body of the prior green candle, indicating strong selling pressure overriding previous buying. It's marked near the top, reinforcing the reversal theme.
Opportunity: - As per chart it can short 3380-3350 with stop loss 3400 above for the targets of double bottom pattern 3260 and 3160.
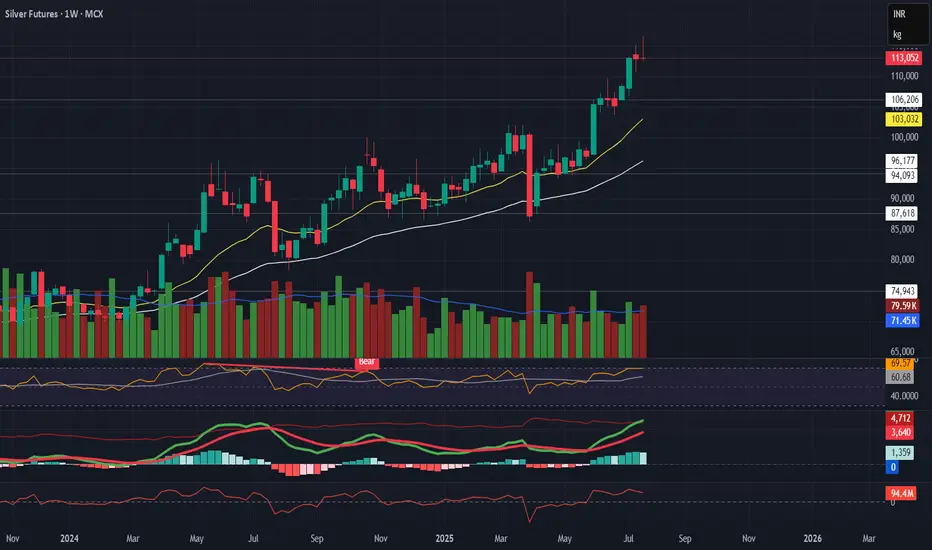
Silver Futures – Bearish Reversal in Progress
Silver Futures – Bearish Reversal in Progress
Description:
Silver is showing a strong technical reversal across timeframes. Short-term correction looks likely.
Technical Setup:
Daily:
Evening Star + Bearish Engulfing
Flattening EMAs
Volume and MACD confirming momentum slowdown
Weekly:
Gravestone + Southern Doji near resistance
RSI close to overbought
EMA slope still up, but weakening signs visible
Macro View:
No major bearish macro trigger — Fed dovish, USD stable, inflation low.
→ This is likely a technical pullback, not a fundamental reversal.
Trade Plan:
🔻 Breakdown Level: ₹114,560
🎯 Targets: ₹107K → ₹101K → ₹93K
🛑 SL: ₹116,000+
Caution: No position without breakdown confirmation.
Tata motor sign of correction.As per chart analysis stock is trading in LL & LH pattern. It is facing resistance at 78.6%.
Candle pattern showing evening star pattern which is sign correction. It may test 580 soon.

Is Nifty-Bank test 49700 ?Back-to-Back Evening star form on B-nifty chart weak sign, If it will give weekly closing below 52000. Deep correct may come up to 49700 again.

Nifty forming H&S pattern on weekly chart.Alarming sign on indexNifty forming H&S pattern on weekly. With the neckline 24900 if it closes below this level, it may come up to 24500-24100 in short time.

Banknifty Weak pattern on weekly chart.Bank nifty form Evening Star on Weekly chart. Bearish pattern, It can short on higher level 51500-52000. It may correct up to 49600 to 48600 soon.

Nifty price Action 14.04.2024.Nifty facing trendline resistance at 22777. Next up move will come when it close above 22777, till stay short.
As per chart nifty showing weakness. It form evening star pattern on daily chart and also double top on 3-4 hrs. time frame.
On Monday nifty can short with stop loss 22810 on any level below 22610 for lower target 22430, 22310 soon.
As per channel shown on chart nifty final target would be 21921.

NESTLEIND - Evening StarNESTLEIND - Watch out for a good breakdown/ shorting opportunity in 1D timeframe.
A few points to note:
1. There is a weekly reversal sign (bearish - Evening star pattern)
2. The stock is below 50DMA
3. Ascending wedge pattern - Usually is a bearish sign.
4. Overall on a higher timeframe, the stock is rallying - hence it is wise to be cautious and have a hedge.

Evening Star in DLF, 1DNSE:DLF formed Evening Star pattern and Double Top in Daily TF.
Entry : 516.90
Target : 582
SL : 545
RR : 1.2

SBILIFE, 1D forms Evening StarNSE:SBILIFE formed an evening star after an uptrend.
Entry : 1334.2
Target : 1271
SL : 1395
RR : 1

Evening Star in BANKNIFTY, 1DNSE:BANKNIFTY formed Evening Star(Bearish pattern) pattern on Daily TF .
Entry : 45384.60
Target : 44300
SL : 46350
RR : 1.1

Evening star in SBIN, can it take stock lower?SBIN has given a fall of 7% in this week after forming a double top pattern.
An evening star pattern has been formed on the weekly time frame and stock has closed below the 20 ema.
After trading around the ATH stock has given a nice fall and in the last trading session too it has given 3% fall.
Volume indicator also confirms the pattern as the volume of the red candle is higher than the doji candle formed previously.
A short trade can be initiated in the stock once it starts trading below today's week low. The stock can test 550 levels so as there are high chances of froming lower lows lower highs.
The stock may take a halt candle on the daily charts, as it has formed 4 red candle and is trading between both the moving averages.
If the stock retest higher levels before giving another bearish leg, sell positions can be created once there is a negative candle formation near golden ratio of fibonacci series.
Entry :- Below 571, On bearish candle around 600 levels.
Targets :-555, 505
Stop losses should be created on 1:2 or 1:3 basis.
Positional trades can be initiated in the stock as it may take time to test the levels. Next expiry future or options can be sold as August expiry option will take profit due to time decay.
Wait for the price action near the levels before entering the market.

Evening StarAn evening star is a candlestick pattern used by technical analysts to predict future price reversals to the downside.
Although it is rare, the evening star pattern is considered by traders to be a reliable technical indicator.
The evening star is the opposite of the morning star pattern. The two are bearish and bullish indicators, respectively.
Script = HeroMotoCorp
Time Frame = 1 Day

Lichsgfin 1dtf perfect Evening star pattern Lic housing finance 1Dtf forms a perfect evening star pattern at a resistance which is a sign of trend reversal.
Stock looks bearish

Cummins - Rising Wedge & Evening Star - Weekly OverviewNSE:CUMMINSIND making rising wedge on weekly charts and also has formed a evening star candlestick pattern. With a SL of 1666, one can short for T1 of 1552 and T2 of 1518.
Let's see how the story develops. Best wishes!
Disclaimer -
- The opinions expressed here are my own. This is for my own records as well as what I see on charts.
- If you are referring to this, please keep in mind that it is only for educational and research purposes.
- Past performance is no guarantee of future results.
- You must accept responsibility for any decision you make. DO NOT TAKE THIS AS AN INVESTMENT RECOMMENDATION.
- It's your hard-earned cash. Trade / Invest wisely, keeping in mind your trading style, goals and objectives, time horizon, and risk tolerance.
- Before investing, conduct your own research and consult with a financial advisor.
TIA!

Evening StarAn evening star is a candlestick pattern used by technical analysts to predict future price reversals to the downside.
Although it is rare, the evening star pattern is considered by traders to be a reliable technical indicator.
The evening star is the opposite of the morning star pattern. The two are bearish and bullish indicators, respectively.
Script = Axis bank
Time Frame = 15 min

SGX Nifty - LearnLearn Technical Analysis - Bearish Trend
In sgx nifty chart first there was a uptrend & then it broke the resistance of around 17000.
After breaking the resistance it fall again. Now in this scenario prevoius resistance acting as a support & it bounced back from it.
At around 17460 there was a second resistance. So you can also see the dry volume & negative divergence near this resistance level. After this it formed evening star pattern.
This is how we should do technical analysis for bearis trend.
1. Uptrend
2. Find if any resistance or support
3. Then dry volume with negative divergence
4. Finally a bearish pattern.

Evening StarAnother reversal pattern at important juncture,
It seems like profit booking has occurred at supply zone.
Evening Star formation :
The support holds at low of first candle and same level has been tested today
17300-350 level is the point of the control zone , it has maximum volume spread.
Price pattern has created a confluence zone ,
It would act as strong support but if it goes below it, heavy selling is likely to occur

Banknifty analysis - logic and planEXPLANATION : This is a 15 min time frame chart of BANKNIFTY . It has been consolidating at previous Resistance zone and formed the Evening star pattern . ( An Evening start is a candlestick pattern that is used by traders for analyzing when the uptrend is going to reverse to a downtrend ) If give a strong breakdown and continue his pattern , I am bearish on BANKNIFTY . If give a strong breakout and retest ( Resistance become Support ) , I am bullish on BANKNIFTY . Levels are marked in chart , enter as per your setup .

Reversal candlestick patterns1.Bullish Engulfing : The first candlestick is a red one, and the second is green. A green one “engulfs” the red one because the body has a lower opening price and a higher closing price
2. Evening Star : You need three candlesticks to see this Evening Star pattern, a green candle with a long body, a short green or red candle, and a red candlestick.
3. Dark Cloud : The price gaps higher and then sells off, creating a candlestick that shows a closing price lower than the midway point in the previous candle.
4. Spinning Top : A spinning top is a candlestick pattern having a short real body with long upper and lower shadows.
5. Tweezzer Bottom : The Tweezer Bottom candlestick pattern is a bullish reversal candlestick pattern that is formed at the end of the downtrend. It consists of two candlesticks, the first one being bearish and the second one being bullish candlestick.
6. Two Black Gapping : The bearish two black gapping continuation pattern appears after a notable top in an uptrend, with a gap down that yields two black bars posting lower lows.

Evening star - Reversal patternThe pattern has formed at the resistance zone and the price has come below the important support of the 17600 range.
As per the volume profile majority of price, action has happened on the 17300 level. It can be considered the next level of support.

IRCTC - Evening star on 24/12 - Descending traingleIRCTC is making a move and has already formed a H&S in the past, currently it is saturating within triangle.
On Friday (23/12) it has formed an evening triangle which can move the price downwards.
FSP
