Event-Driven Trading: Strategies Around Quarterly Earnings1. Understanding Event-Driven Trading
Event-driven trading refers to strategies that seek to exploit short-term price movements caused by corporate or macroeconomic events. These events can include mergers and acquisitions (M&A), regulatory announcements, dividend announcements, product launches, and, most notably, quarterly earnings reports. Event-driven traders operate on the principle that markets do not always price in the full implications of upcoming news, creating opportunities for alpha generation.
Earnings announcements are particularly potent because they provide concrete, quantifiable data on a company’s financial health, guiding investor expectations for revenue, profit margins, cash flow, and future outlook. Given the structured release schedule of quarterly earnings, traders can plan their strategies in advance, combining statistical, fundamental, and technical analyses.
2. Anatomy of Quarterly Earnings Reports
Quarterly earnings reports typically contain several key components:
Revenue and Earnings Per Share (EPS): Core indicators of company performance. Earnings surprises—positive or negative—often trigger substantial stock price moves.
Guidance: Management projections for future performance can influence market sentiment.
Margins: Gross, operating, and net margins indicate operational efficiency.
Cash Flow and Balance Sheet Metrics: Provide insight into liquidity, debt levels, and overall financial health.
Management Commentary: Offers qualitative insights into business strategy, risks, and opportunities.
Understanding these elements is critical for traders seeking to anticipate market reactions. Historically, stocks tend to exhibit heightened volatility during earnings releases, creating both opportunities and risks for traders.
3. Market Reaction to Earnings
The stock market often reacts swiftly to earnings announcements, with price movements reflecting the degree to which actual results differ from expectations. The reaction is influenced by several factors:
Earnings Surprise: The difference between actual earnings and analyst consensus. Positive surprises often lead to price spikes, while negative surprises can trigger sharp declines.
Guidance Changes: Upward or downward revisions to guidance significantly impact investor sentiment.
Sector Trends: A company’s performance relative to industry peers can amplify market reactions.
Market Conditions: Broader economic indicators and market sentiment affect the magnitude of earnings-driven price movements.
Traders must understand that markets may overreact or underreact initially, presenting opportunities for both short-term and medium-term trades.
4. Event-Driven Trading Strategies Around Earnings
4.1 Pre-Earnings Strategies
Objective: Position the portfolio ahead of anticipated earnings to profit from expected price movements.
Straddle/Strangle Options Strategy
Buy both call and put options with the same expiration (straddle) or different strike prices (strangle).
Profitable when stock exhibits significant volatility regardless of direction.
Works well when implied volatility is lower than expected post-earnings movement.
Directional Bets
Traders with conviction about earnings outcomes may take long or short positions in anticipation of the report.
Requires robust fundamental analysis and sector insights.
Pairs Trading
Involves taking offsetting positions in correlated stocks within the same sector.
Reduces market risk while exploiting relative performance during earnings season.
4.2 Post-Earnings Strategies
Objective: React to market inefficiencies created by unexpected earnings results.
Earnings Drift Strategy
Stocks that beat earnings expectations often continue to trend upward in the days following the announcement, known as the “post-earnings announcement drift.”
Conversely, negative surprises may lead to sustained declines.
Traders can exploit these trends using momentum-based techniques.
Volatility Arbitrage
Earnings reports increase implied volatility in options pricing.
Traders can exploit discrepancies between expected and actual volatility post-announcement.
Fade the Initial Reaction
Sometimes markets overreact to earnings news.
Traders take contrarian positions against extreme initial moves, anticipating a correction.
5. Analytical Tools and Techniques
Successful event-driven trading relies heavily on data, models, and analytical frameworks.
5.1 Fundamental Analysis
Study revenue, EPS, margins, guidance, and sector performance.
Compare against historical data and analyst consensus.
Evaluate macroeconomic factors affecting the company.
5.2 Technical Analysis
Identify key support and resistance levels.
Use indicators like Bollinger Bands, RSI, and moving averages to gauge price momentum pre- and post-earnings.
5.3 Sentiment Analysis
Monitor social media, news releases, and analyst reports for market sentiment.
Positive sentiment can amplify price moves, while negative sentiment can exacerbate declines.
5.4 Quantitative Models
Statistical models can predict probability of earnings surprises and subsequent price movements.
Machine learning algorithms are increasingly used to forecast earnings-driven volatility and trade outcomes.
6. Risk Management in Earnings Trading
Event-driven trading carries elevated risk due to volatility and uncertainty. Effective risk management strategies include:
Position Sizing
Limit exposure per trade to manage potential losses from unexpected moves.
Stop-Loss Orders
Predefined exit points prevent catastrophic losses.
Diversification
Spread trades across sectors or asset classes to reduce idiosyncratic risk.
Hedging
Use options or futures contracts to offset directional risk.
Liquidity Assessment
Ensure sufficient market liquidity to enter and exit positions without excessive slippage.
Conclusion
Event-driven trading around quarterly earnings offers substantial opportunities for informed traders. By combining fundamental analysis, technical tools, options strategies, and disciplined risk management, traders can capitalize on the predictable yet volatile nature of earnings season. While challenges exist, a structured and strategic approach allows market participants to profit from both anticipated and unexpected outcomes.
The key to success lies in preparation, flexibility, and understanding market psychology. Traders who master earnings-driven strategies can achieve consistent performance, turning periodic corporate disclosures into actionable investment opportunities.
Event
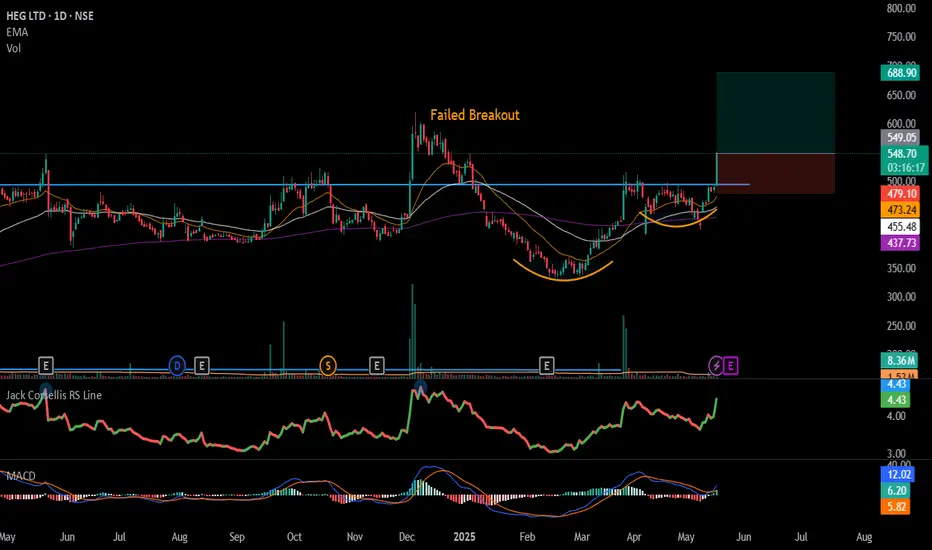
#HEG - Cup & Handel Set up in Daily Time Frame📊 Script: HEG
Key highlights: 💡⚡
📈 Cup & Handel Set up in Daily Time Frame.
📈 Price consolidated near Resistance.
📈 BO with Volume
📈 MACD Crossover
📈 Do not Enter Trade as we have Earning coming up
BUY ONLY ABOVE 545 DCB
⏱️ C.M.P 📑💰- 547
🟢 Target 🎯🏆 – NA%
⚠️ Stoploss ☠️🚫 – NA%
️⚠️ Important: Market conditions are Okish, Position size 50% per Trade. Protect Capital Always
⚠️ Important: Always Exit the trade before any Event.
⚠️ Important: Always maintain your Risk:Reward Ratio as 1:2, with this RR, you only need a 33% win rate to Breakeven.
✅Like and follow to never miss a new idea!✅
Disclaimer: I am not SEBI Registered Advisor. My posts are purely for training and educational purposes.
Eat🍜 Sleep😴 TradingView📈 Repeat 🔁
Happy learning with MMT. Cheers!🥂
NIFTY- A strong move is about to come?An index analysis idea after many many months.
Reason:- Today, we saw a short covering 400 points up move in Nifty with an ATH closing.
What is the chart speaking now?
Nifty has given daily closing above 22800 which was a strong supply zone.
23000 is a psychological resistance in Nifty now.
As from chart, it is clear that our dear Nifty is trading in a channel and 23100-23150 is the next supply zone. If we see a consolidation near 23000, we might see this resistance getting broken and strong bull run till 25000 should be expected.
However, there are high chances of bull trap getting formed in this zone , especially 4th June being an eventful day which is just 2 weeks away from now. I am expecting a highly volatile market till June end.

GBPUSD keeps bearish consolidation towards 1.3320 on UK GDP dayGBPUSD posts a corrective pullback from the yearly low of around 1.3425 ahead of the UK data dump, comprising preliminary readings of the UK Q3 GDP. Even so, the cable pair needs a daily closing beyond September’s bottom of 1.3411, as well as the 50% Fibonacci retracement level near 1.3460, to convince short-term buyers. Even so, lows marked in July and 200-SMA, respectively around 1.3575 and 1.3845, become tough nuts to crack for the bulls.
Meanwhile, oversold RSI conditions may trigger corrective pullback on the way to the four-month-old support line near 1.3320. Following that, 61.8% Fibonacci retracement level and October 2020 peak, close to 1.3270 and 1.3175 in that order, will question the GBPUSD bears before directing them to the sub-1.3000 area. Overall, the sterling remains in the bearish trajectory but intermediate pullbacks can’t be ruled out.

EURUSD stays inside falling wedge, US Durable Goods Orders eyedEURUSD bears take a breather around weekly low, after a two-day downtrend, during early Wednesday. Although risk-on mood helps the EURUSD to consolidate weekly losses, the likely firmer US Durable Goods Orders print keeps the bears hopeful. Additionally, the quote’s sustained trading inside a broad falling wedge since early June and a recent drop below 10-DMA joins bearish MACD signals to add technical assent to the bearish expectations. That said, the yearly low surrounding 1.1520 is on the cards ahead of the stated wedge’s support line near 1.1475. During the fall, March 2020 peak close to the 1.1490 may offer an intermediate halt.
On the contrary, an upside clearance of the 10-DMA, around 1.1620, may direct short-term buyers towards the monthly peak of 1.1668. However, bulls are less likely to take the risk of entries until witnessing a successful break of 1.1725, comprising the wedge’s resistance line. Following that, hopes of the trend reversal can’t be ruled out. It should be noted that the corrective bounce following the US Durable Goods Orders should be taken with a pinch of salt as the key data/event is Thursday’s US Q3 GDP and the European Central Bank (ECB) meeting.

GBPUSD prints bullish flag as EU-UK jostle over BrexitGBPUSD buyers await for Brexit headlines as the Cable gyrates inside a bullish flag chart pattern on the four-hour play. The European Union (EU) diplomats aren’t likely to get a warm welcome in London on their arrival for Brexit talks. The reason could be linked to the comments from UK’s Brexit policymaker David Frost, conveying his discomfort with the bloc proposal for NI border. However, the Fed tapering concerns remain elevated ahead of Thursday’s US Q3 GDP and underpin the US dollar’s safe-haven demand. Hence, the quote is likely to remain firmer but further upside needs a clear break of 1.3815 hurdle. The same will confirm the bullish chart pattern, directing the pair further towards the 1.400 psychological magnet. During the rally, September’s peak of 1.3912 may probe the bulls.
Alternatively, the monthly support line near 1.3750 offers immediate support to the GBPUSD prices during the pullback, ahead of the stated flag’s support line near 1.3725. Should the quote remains weak past 1.3725, the 1.3700 round figure and 200-SMA level near 1.3685 may probe the bears before directing them towards the monthly low of 1.3430. Overall, GBPUSD bulls keep the reins ahead of important Brexit talks.

Gold bears hold controls below $1,800, ECB awaitedGold remains depressed around the lowest in two weeks as market sentiment sours ahead of the key European Central Bank (ECB) monetary policy meeting on Thursday. Having stepped back from a two-month-old horizontal resistance last Friday, gold prices dropped below 200-DMA and 50-DMA during the current week. The downside momentum recently gains support from bearish MACD and an absence of oversold RSI to direct the sellers towards June’s low near $1,750. However, $1,760 and August 18 low close to $1,774 may act as intermediate halts.
On the contrary, gold buyers should retake controls if the ECB hawks dominate while announcing the widely chattered PEPP tapering. Even so, 50-day and 200-day SMAs, respectively near $1,798 and $1,809, can challenge the bulls ahead of directing them to the crucial horizontal hurdle surrounding $1,834. To sum up, gold needs market optimism, which is less likely to pop up from today's ECB and hence bears can keep the reigns.

PFC | Last day Pinbar gives hope for good swing ahead of budgetPFC | Last day Pinbar gives hope for good swing ahead of budget
CMP : 111
SL : 105
Target : 125
Almost 1:3 risk reward setup
