NIFTY DAILY - 22/4/2024Second winning strike of bulls, Nifty opens gap up with almost 150 points.
Initially bears were trying to capture the market but didn’t sustain and made days low that is 221989 level.
Market was choppy throughout the trading session, into last trading hour nifty made high of 22375 with almost 220 points up which is around 1% and gave closing near today’s opening level which is 22336 level.
Index has formed Dragonfly Doji on daily chart which indicates indecisiveness among participants. Candle is taking support of 20 Days Exponential Moving Average Line.
Nifty is able to hold 22300 level and broke the resistance level which was 22276 so, further resistance will be 22556 level with support of 22242 level.
Today’s Advance Decline ratio of NIFTY50
Advance - 44
Decline - 5
Unchanged - 1
FII Sell - 2915.23 crores
DII Buy - 3542.93 crores.
⚠️ Important: Always maintain your Risk & Reward Ratio.
✅Like and follow to never miss a new idea!✅
Disclaimer: I am not SEBI Registered Advisor. My posts are purely for training and educational purposes.
Eat🍜 Sleep😴 TradingView📈 Repeat 🔁
Happy learning with trading. Cheers!🥂
Exponentialmovingaverages

NIFTY DAILY - 6/3/2024After a three choppy session Nifty hit a new high in second half that is 22497 level.
Nifty has formed a big green body candle with long lower shadow which indicates buyers were buying from lower end and upper shadow.
Candle has taken support of 9 days Exponential Moving Average.
Nifty find nearest resistance 22520 level and nearest support lies around 22269 level.
Today’s Advance Decline ratio of NIFTY50
Advance - 35
Decline - 15
FII Buy + 2,766.75 crore
DII Buy + 2,149.88 crore.
⚠️ Important: Always maintain your Risk & Reward Ratio.
✅Like and follow to never miss a new idea!✅
Disclaimer: I am not SEBI Registered Advisor. My posts are purely for training and educational purposes.
Eat🍜 Sleep😴 TradingView📈 Repeat 🔁
Happy learning with trading. Cheers!🥂

NIFTY DAILY - 27/2/2024Index open with positive note and afterwards bulls took over the market and made days high that is 22218.
Index has formed green body shaven bottom candle with small upper shadow which indicates participants were buying from lower level.
Candle is taking support of 9 Days Exponential Moving Average as seen in chart.
Next levels for nifty will be 22381 upsides and 22023 level downsides.
⚠️ Important: Always maintain your Risk & Reward Ratio.
✅Like and follow to never miss a new idea!✅
Disclaimer: I am not SEBI Registered Advisor. My posts are purely for training and educational purposes.
Eat🍜 Sleep😴 TradingView📈 Repeat 🔁
Happy learning with trading. Cheers!🥂

NIFTY DAILY - 26/2/2024Nifty open with gap down.
Bulls tried to sustain in the market but failed and bear took over the market and made days low that is 22075 level and formed small body red candle with upper and lower shadows.
Candle is trading near 9 Days Exponential Moving Average.
Next levels for nifty will be 22381 upsides and 22023 level downsides.
⚠️ Important: Always maintain your Risk & Reward Ratio.
✅Like and follow to never miss a new idea!✅
Disclaimer: I am not SEBI Registered Advisor. My posts are purely for training and educational purposes.
Eat🍜 Sleep😴 TradingView📈 Repeat 🔁
Happy learning with trading. Cheers!🥂

MAPMYINDIA 125 MINUTE 200 EMAMAPMYINDIA is receiving very good support and reversal on 200 EMA in a 125-minute timeframe .
Month and weekly RSI looks very strong.

CERA NSE 200 DAILY EMACera is receiving very good support on daily EMA, also the weekly and monthly RSI are looking very strong.

TIPSINDLTD 200EMATIPSINDLTD is taking good support on 200 EMA in a 125-minute timeframe for Indian markets.
Also, the Monthly and Weekly RSI are looking quite strong

ABOTTINDIA 200 Days EMA ABOTTINDIA is taking good support on 200 EMA in a daily timeframe, also the monthly timeframe RSI looks very strong.
Entry: 23180
Target: 25007
Stop Loss: 22090
This is my first Idea shared on the Trading View platform.
Wish me Luck

Long Godrej PropertiesGodrej Properties is look good to buy. Selling pressure is reduced from the stock. Currently Stock is taking rejection from 200 EMA and support near the 1150 price level. Currently, 1150 INR is looking for good support for the stock and in the last trading price closed crossing 30 EMA. CMP is a good price to go long in the stock because here risk-reward is favorable.
As per the Fibonacci tool, we can consider 1450 INR 1st the target and 1650 INR second target.


Nifty Short Trade Setup!Nifty Facing Strong Resistance Near ~ 18090, Spot Level. Weak RSI And Closes Below 50 ~ Day Exponential Moving Average ( EMA ). Short Near ~ 17920, 17940, With Stop ~ 18080, For Target ~ 17382, Expected Target Jan Expiry.

SPARC | Ascending Triangle | Positional Buy for 20%NSE:SPARC
Moving up in Ascending Triangle Pattern, with price getting support from rising Trendline
Price bouncing from EMAs
CMP : 250
Target : 300
Upside : 20%
SL : 230
RSI is trending up & now in Bullish zone.

ACC | Cup & Handle BO | 40% Upside | Nifty Infra RallyingNSE:ACC
Weekly Breakout from Cup & Handle Pattern
CMP trading above all major Weekly Exponential Moving Avgs
RSI in Bullish Zone
Tgt: 3000 - 3260 - 3675
SL : 2350
Upside Potential : 40%
Time Frame : 3 - 12 Months

BoB| BO from Rising Channel|50% UpsideNSE:BANKBARODA
Weekly Breakout from Rising Parallel Channel
CMP trading above all major Weekly Exponential Moving Avgs and taking Support and bouncing
RSI in Bullish Zone
Tgt: 155 - 171 - 190 - 224
SL : 125
Upside Potential : 50%
Time Frame : 3 - 12 Months

SUNPHARMA | Near 7Yr Resistance| Rocket Abv 1080 | 70% UpsideNSE:SUNPHARMA
7 month Consolidation between 800 - 940 & recently Breakout from Ascending Triangle
Price approaching 7 Year Resistance zone of 1070 - 1080.
Breakout above the resistance zone will make Sunpharma a Rocket.
Short Term Target : 1070
Long Term Target : 1542 - 1831
Upside : 50%-70%
SL : 880
Rising in Channel since March 2020 and Taking support from 20 & 50 Week EMA
RSI is consistently in Bullish Zone

AURO PHARMA | Falling Trendline nd Symmetrical Triangle BreakoutNSE:AUROPHARMA
Strong Breakout Candle formed with Volume.
Multiple Breakouts from
a) Falling Trendline Pattern of many months
&
b) Symmetrical Triangle Pattern
CMP moving above 20 & 50 Day EMA and RSI moving in Bullish Zone
Target : 554 - 600
SL : 510
R: R - 1 : 2
Time Frame : 1 to 4 weeks

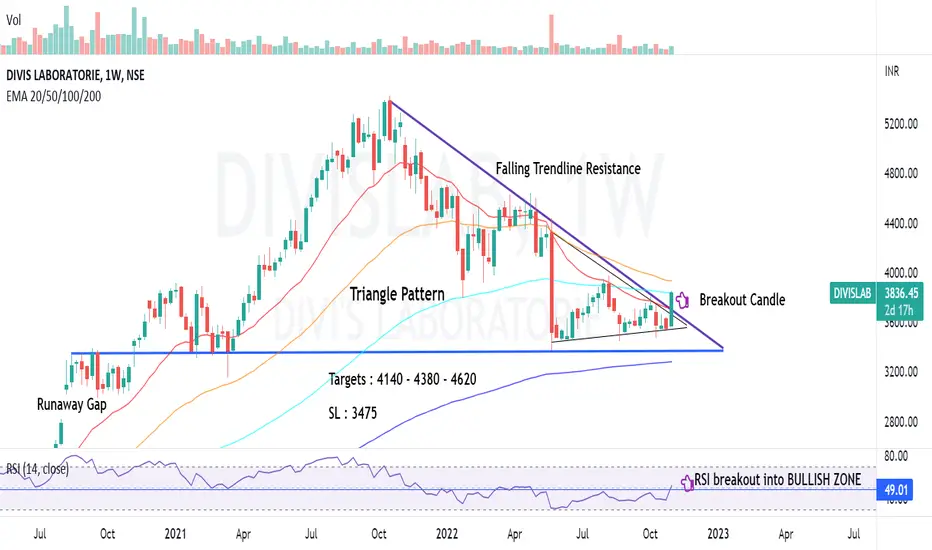
DIVIS LAB | Triangle Pattern BO with Vol | 20%NSE:DIVISLAB
Breakout with volume from Triangle Pattern
Targets : 4140 - 4380 - 4620
Upside : 20%
SL : 3475
Time Frame : 3-6 Months
RSI Back in Bullish Zone
CMP above 20 & 200 Week EMA
LUPIN| Change in Trend | Start of Bull Run|43% UpsideNSE:LUPIN
Breakout of Falling Trendline from May 2021
Weekly Closing > 50 Week EMA after 15 months signals change of TREND
CMP taking support from Moving Averages
Targets : 744 - 839 - 915 - 992
Upside : 43%
SL : 640
RSI>55 back in BULLISH Zone

ZYDUS LIFESCIENCE | Positive Trend with Newsflow | 35% PotentialNSE:ZYDUSLIFE
Stock is in Higher High Higher Low Formation after major correction, which indicates Positive Trend.
CMP above all Weekly EMAs & RSI Rising in Bullish Zone
Immediate Resistance Zone @430-435 after which
Targets : 460 - 500 - 540
Upside : 35%
SL : 395
Time Frame : 3 - 12 Months

CNX PHARMA | Flag Breakout | 27% UpsideNSE:CNXPHARMA
Flag Breakout on Monthly Charts
Monthly Closing above 50 Month EMA & trading above all long term EMAs
RSI in Bullish Zone
Next Targets : 14700 - 16500
Upside : 27%
SL : 12100
Time Frame : 6 - 12 Months
Participate via PHARMABEES, PharmaFund

CIPLA| Leader of Next Pharma BullRun| 45% UpsideNSE:CIPLA
CIPLA - CMP in Blue Sky Zone and near Life time high
Rising in Parallel Channel since 24 month
13 month consolidation in tight range & then resumption of uptrend.
Targets: 1320 - 1458 - 1683
Upside : 45%
SL : 990
Time Frame : 6 - 18 Month
CMP above all major monthly Exponential Moving Averages
RSI in Bullish Zone

Larsen | C&H Formation | Breakout Candidate | 40% UpsideNSE:LT
Cup & Handle formation in Chart
Breakout Candidate
Good Buy above 1960
Targets : 2090 - 2476 - 2715
SL : 1800
Upside : ~40%
RSI in Bullish Zone
CMP taking support from Short Term Exp. Moving Avgs

McDowells | Rising in Parallel Channel | 40% UpsideNSE:MCDHOLDING
After Bullish Pole & Flag BO
Price moving up in Parallel Channel
CMP of 851 is above medium & Long Term Exponential Moving Averages
Targets : 951 - 1081 - 1161
SL : 744
Consumption Stock
RSI Trending up
