Falling wedge pattern BATAINDIA.Stock Name: BATAINDIA
Chart Pattern: Falling wedge pattern
Time Frame: 1D
Entry: Reversal @1800
Breakdown entry below 1580
Targets: Reversal Target -1580
Breakdown Targets -1030
Falling Wedge

4 Amazing stocks and Index ideas to trade on 22 July I daily make educational content videos on financial markets.

Target 1 achieved in Lti | 6% mover This idea is a follow-up to LTI
You can check the Link to Related Ideas.
Disclaimer: The information provided is for educational purposes only. Our intention is not to provide any financial advice, don't take any decision without consulting your financial advisor.

FDC | Falling wedge breakout and retest - Potential for 15-25%FDC | Falling wedge breakout and retest - Potential for 20-25%
CMP : 254 (Dip : 250)
SL : 240
Target : 285, 315
1:3+ risk reward for first target (15%)

INDIAN ENERGY EXCH_SWING TRADEIndian Energy Exch seems like a falling wedge pattern. Now its price at support line, it will bounce towards upward resistance upcoming days. Its good for swing traders. keep target previous swing high.

#NBCC #StockMarketNBCC
On daily chart give falling wedge BO
and now trading at weekly resistance level
Buy above 33 for short term targets of 34.5 to 36
Partial booking at 34.5 levels; but if sustain above 36 then add further for 5-8%
----
Note:
Above levels are for education purposes only
Do your own analysis before taking any trade
Use a strict trailing stop loss.
Please Like & Follow

Tata Motors and Coal India Trades | Index view for 12 JulyI daily make educational content on financial markets

$NEAR 1D TIMEFRAME IDEAOn 1D chart of near ,we can see it has broken falling wedge and successfully closed above it ..if btc does some relief rally from here near would pump 20-30% from here to around 4.2-4.5$ area..Near also holded fairly strong in recent btc dump..and didn't dump much which indicates an upcoming rally from near ..my target for next weekend would be 3.9$

PAYTM has retested and showing bullish signshey guys ,
after a long DOWNTREND ,
PAYTM stock has shown a signs of recovery ,
from the very FIRST DAY , this stock was completely controlled by bears
but now , this stock was following a chart pattern called FALLING WEDGE
last week , this stock was trying to cross this pattern
ans it was SUCCESSFULLY COMPLETED .
And now this stock has retested
and it has shown a great green candle ,
which convince us to bet on this stock
and earn HIGH RETURNS
BUT FIRST CONSIDER THE GLOBAL SITUATIONS
.INFLATION
. WAR BETWEEN UKRAINE AND RUSSIA
. RISING BANK RATES
. AND INCREASING EXPORT DUTIES
AFTER CONSIDERING THESE SITUATIONS
YOU CAN BUY THIS STOCK
BUT PLS GUYS , SEE THAT IF MARKET IS OPENING GAP DOWN
THAT THIS STOCK IS UNDER HIS RESISTANCE AREA
THEN PLS WAIT AND LET THIS STOCK TRY TO CROSS HIS RESISTANCE AREA
and guys , if u like my analysis
. follow
. like
. and comment

BHARAT FORGE falling wedge breakout !!!On 2 hour time frame there is a breakout of falling wedge pattern in BHARAT FORGE !!!
There are chances of two scenarios or cases that are discussed on chart.
Swing entries can be made in BHARAT FORGE.
For entries , SL , targets watch the chart.
Hit the like button and follow me for more chart analysis posts !!!

Amazing Intraday, swing trade setups with Index Ideas for 30 JunI daily make educational content videos for financial markets

[Short Term]Falling Wedge Pattern In NIFTYIn this chart showing different possibilities of long side and short side trade positions in NIFTY. Currently it is trading in Falling wedge pattern on daily time frame. Current trend of nifty will change only if it gives breakout of resistance of inside falling wedge on daily time frame. Once breakout of this pattern possible strong upside rally in nifty upto larger falling wedge pattern resistance. Any major downside now only possible if nifty starts trading below support level.

Index trades with OI data | Swing and Intraday Ideas for 27 JuneI daily make educational content videos on financial markets

TATA MOTORS - Important supportsTATA MOTORS - Important supports
1. It's a complete market downtrend, I will give you support points for the TATA MOTORS.
2. Currently stock is the primary trend, which is a positive point for it.
3. 340 is the first support point...300, and 280 will be the respective support point for TATA MOTORS.
4. hope it won't downfall as like the 2020 crash.
Note:
1. I’m not a SEBI Registered advisor, my research is personal and for educational purposes only.
2. Always check with your financial advisor and take the trade as per your risk/reward ratio.
3. Follow me for more patterns and like, and share so that we feel it is helpful to many and share more patterns...

BOROSIL LTD - Long Terms BullishBOROSIL LTD - Short term bearish trend
1. Now at the primary trend, it's a positive sign...
2. It breaks the Falling wedge pattern now...
3. Strong support at 272, if it breaks another support at 240
4. Target will be 412 if it breaks with an open and close candle above 295
Educational purpose...

SONACOMS - BearishSONACOMS - Bearish
In a short term look bullish...
But the trend is falling wedge, only bullish when it breaks the falling wedge pattern...
Educational purpose...

Industower - Bearish controlIndustower - Strong Bearish control
In a downtrend formation, only when it crosses 215 we can think of the bull control...
Educational Purpose...

Breakout in RAIN INDUSTRIESBreakout in RAIN INDUSTRIES in Daily timeframe.
Entry: 175
Targets: 210, 240 and 255
DISCLAIMER: The ideas shared are only for educational purpose. The markets are very volatile, so plan your trades accordingly. Please trade with stop loss. I am not SEBI registered.

BUY LT ABOVE 1627 | SWING TRADE1. At Support zone
2. W Pattern On Daily Time Frame
3. FALLING Wedge 15 min

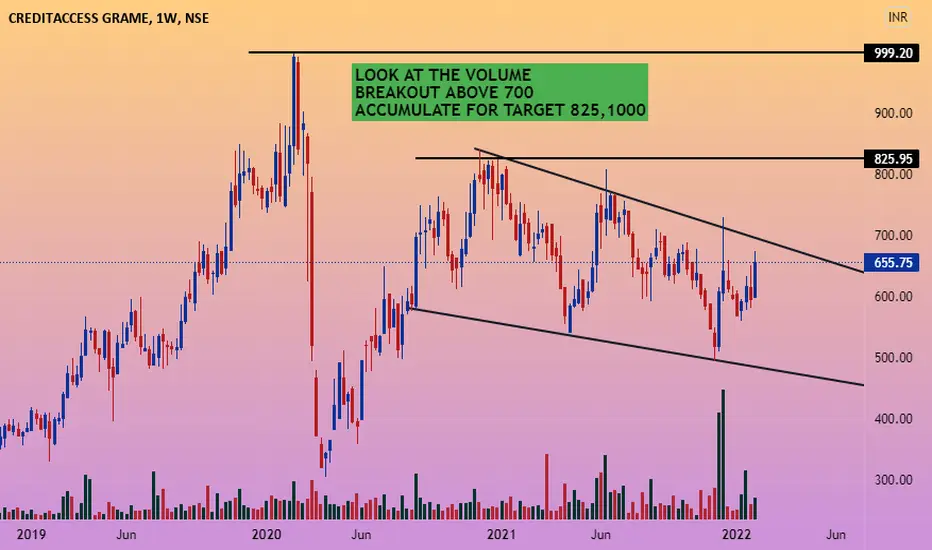
IS SOMETHING COOKING IN CREDITACC? TRADE OR INVEST wisely.
WE CAN JUST PREDICT.
Disclaimer: I am not a SEBI registered advisor , so before entering on my view plz ask your SEBI Registered Advisor . Profit is your and loss is your.
PLEASE LIKE AND SHARE IF YOU AGREE WITH THE IDEA
WIPRO | FALLING WEDGE🔴 Falling wedge pattern is being formed.
🔴When diagonal support and straight line support meets it will become a stronger one.
🔴Price will try to go up from the current support.
🔴If it fails to hold it may go sideways for re-accumulation phase
🔴 DISCLAIMER : This is just for educational purpose. Do your own analysis.🔴

Falling Broadening Wedge Pattern In NIFTYOn Daily Timeframe, NIFTY trading in falling broadening wedge pattern. Currently it's trading in downtrend direction and this downside can expected upto near 15000 level or downside support level. At this location investor or short term trader can look for buying side positions on reversal confirmation. For long side investors can wait either bottom support level or breakout of upside resistance level.
Disclaimer: Consider this post as an education purpose only. All mentioned levels and assumptions based on historical movements. Before taking any position don't forget to consult with your financial advisor.
