Inverse Cup and Handle for Bearish indicationAfter strong Bullish Engulfing formation on 5th September 2025, the OANDA:NZDCAD price is rocketing towards higher highs, aiming for 0.8624 resistance.
Now it needs some breath after forming a bearish Harami on 12th September 2025.
Looking at the Hourly timeframe, it made an inversed Cup and Handle which indicates for bearish signal.
Yet we need another confirmation for breaking its lower high at 0.8229 which is our entry price
I am bearish from Monday onwards waiting for that cup's handle breakout. Once its done my orders must be triggered and left for bearish.
I will place a sell stop order 0.8229 with my SL at the handle of cup at 0.8256.
I will take two positions both at the breakout of Handle at 0.8229. Both position has 2% risk in total
Note: The Sell stop order is a must. If its not triggered then we are not aiming for any other trade.
Position 1 with 1 % Risk
Buy Stop: 0.8229
Stop Loss: 0.8256
TP: 0.8197
Position 1 with 1 % Risk
Buy Stop: 0.8229
Stop Loss: 0.8256
TP: 0.8160
Fibbonachi

MRPL is on bullish Reversal mode for 64% gain.MRPL:-
It is showing reversal from support level of 100. (100 is also a psychological level).
It forms Bullish engulf candle at fibbo level 78.6% which is sign of reversal.
This engulfs candle may convert soon in Inv. H&S pattern.
As per chart it may test minimum target of 230 soon which is 64% rise from here.
After cross and sustain above 150 it may take speed.

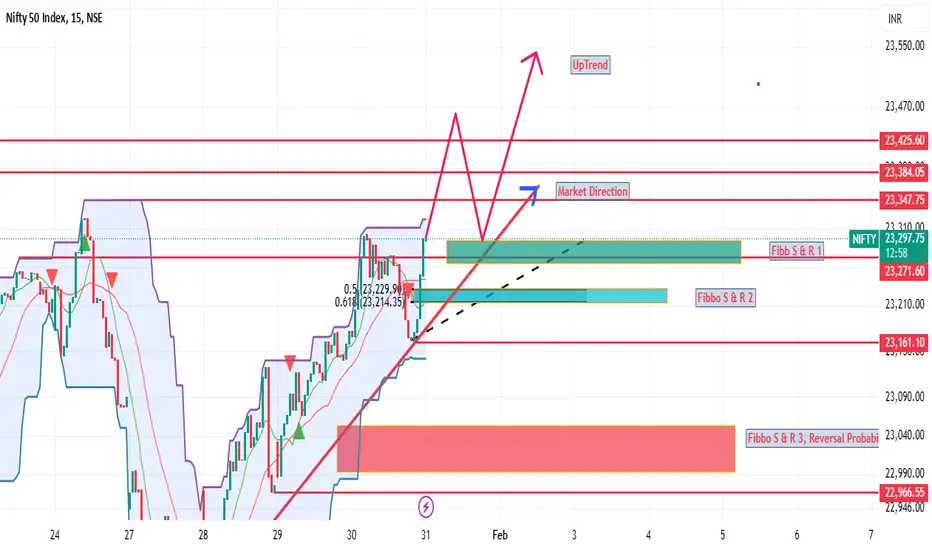
Market Potential Upside, Uptrend, Check Fibbo Levels for Price AMarket current trend is uptrend. For price action kindly check Fibbo levels. Possibility of market rangebound. Overall market trend is bullish.
Bandhan bank is in reversal mode.Bandhan Bank is giving reversal sign on chart, Dow theory change making Equal low to Higher Low. There is huge volume in reversal move. It may test 260 to 290 soon.

CRUDE OIL IMPORTANT FIBONACCI LEVELS MCX:CRUDEOIL1!
❇️ IMPORTANT LEVELS 🚀
❇️ Support: 6464-6378-6240.
❇️ Resistance :6480-6520-6670.
👉🏻 @thetradeforecast 🇮🇳

Nifty may test 23622 soon .Nifty may test 23622 soon. As per chart, if nifty sustain below 24200 it may test 23622. it would be the bounce back level

Nifty me DowntrendNifty me Downtrend
As you can see in chart nifty took exact resistance from FIBB Golden Zone and is now following downtrend. reason and targets as follows,
Reason -
- Major Trendline Breadown
- Perfect FIBB retest from Golden Zone
Target -
Follow FIBB Levels from Chart

BankNifty Taking Support From Fibb Levels BankNifty Taking Support From Fibb Levels
Today market is extremely volatile. in such a volatile and bleeding market always follow FIBB
Banknifty after a severe crashhh of Straight 700++ points, taking support from FIBB levels 0.50 - 0.618 Levels
Upcoming Positional Target 49000
which is 2000 Points from CMP 47200
as you can see clearly from charts

NIFTY LONG TRIGGER NIFTY Long Triggered
According to my GUERILLA FIBB SETUP
Long Entry Level 22380 - 400
Target 22625

Unlocking Potential: Sarda Energy's Path to Progress!Sarda Energy could advance if it revisits the 4-hour bulls order block and retracement level. Should it rebound from the 4-hour bulls order block, we may view it as a chance to consider buying.

Banknift price action.Banknifty form double top pattern. If weekly close come below 47480, It may show more down side up to 46350.

Technical Analysis and Price Projections for MCX ZincExamining the daily chart of MCX Zinc utilizing Fibonacci retracement, notable developments are observed. In May 2023, Zinc breached the 61.8% retracement level but did not test the subsequent level at 78.6% . Instead, it retraced back to the 61.8% level. The pivotal level of 228 suggests that the downtrend in Zinc may have concluded. This level holds significance as it could propel Zinc upwards, targeting levels of 236 , 242 , and potentially 257.6 .
According to the principles of Fibonacci retracement, a weak trend reversal signal is indicative of a weak trend. Therefore, if Zinc breaches the red trendline, a potential downside with target prices of 212 , 206 , and 200 could be anticipated. Caution is advised between the 61.8% retracement level and the trendline.

IOC 4th wave in progressChart is self explanatory and detailed.
4th wave in progress should go to max 50% retracement line. As wave 2 was flat this could be zig zag correction.

GBPUSD - BUY Trade Idea:
📍 Entry: 🎯 Target: ⛔ Stop Loss: (MARKED IN CHART)
💡 RISK REWARD 1 :
💰 Risk 1% of your trading capital.
⚠️ Markets can be unpredictable; research before trading.Disclaimer: This trade idea is based on Elliott Wave analysis and is for informational purposes only. Trading involves risks; seek professional advice before making any financial decisions.Informational onLY !!!!AND IF YOU WANT TO LEARN IT WHAT STOPPING YOU TO ASK HOW ?

Tata Motors wave 3 of 5 Self explanatory elliot wave chart if breaks previous swing high it will reach min. 550.
Alternatively it can wave X of WXY with W being flat but less possibility. Tomorrow open will decide whether it will go to 550 or again test 510-500

ASTRALASTRAL is taking support near 1380 levels which also happens to b 50% fib retracement level.
As long as its not trading below 1380, there are chances of reversal from here.
Assuming its Astral's reversal from here its a buy with stoploss below 1380 & target of 1430 +

CUMMINSCumminsInd took support @ 1550 & bounced back, previously it took support @ 1550 & made new high, as long as cummins stays above 1530 (which happens to be its 50% fib retracement level) its a buy.
Risk:Reward very much in favour of bulls.
Could be bought with mentioned stoploss & targets.

BOSCH monthly chrt : Perfect chartThe chart of bosch limite in the monthly chart is the good techanical set for the long term the share in the correction sone after Feb 2015 and than hi is corrected in the 78.60% fibbonachi level after this the shre is trend in the monthly chart now this time the share is trend line brackout.

TCS - forming bullish patternNSE:TCS At resistance level which was tested thrice and has now become weak….
Price finds support at 50% retracement level…. and showing formation of second bullish wave…
NSE:CNXIT Index is also forming bullish pattern….

JK Paper: In Elliot Collective WaveWe are looking into long term trend of J K paper in weekly timeframe with the help of Elliot Wave and Fib.
Here are our observations:
We are actually in the corrective A,B,C phase of wave formation.
The recent move of around 365 to 400+ is the wave-B of corrective wave-A,B,C.
The major corrective wave-C may be extended upto the 61.8% (Golden Ratio) of Fin retracement (which is around 300).
