Updater Services (UDS) – Wave (B) Exhaustion | Wave (C) Counter-Timeframe: Weekly
Market: NSE
Method: Elliott Wave + Fibonacci Projection
Updater Services appears to be completing a higher-degree corrective Wave (B) after a full ABC advance into 438.
The entire decline from the top has been overlapping, channelized, and time-consuming, confirming a corrective structure rather than an impulse.
Wave Structure Overview
Wave (A): Corrective rise into ~438
Wave (B): a–b–c decline, now near the lower boundary of the long-term falling channel
Wave (C): Expected counter-trend rally once Wave (B) exhaustion confirms
🎯 Wave (C) Target Zones (Projected Using Wave A)
Targets are derived using Trend-Based Fibonacci Extension
(Start of A → End of A → End of B)
0.382 Fib: ~225–230 → First reaction / partial booking
0.618 Fib: ~270–280 → Normal Wave (C)
1.0 Fib: ~330–360 → Only if price turns impulsive
⚠️ This is a corrective Wave (C), not a trend reversal unless momentum and structure confirm.
🛑 Invalidation
A sustained weekly close below the Wave (B) low (~145–150) invalidates the Wave (C) thesis.
Fibonacci

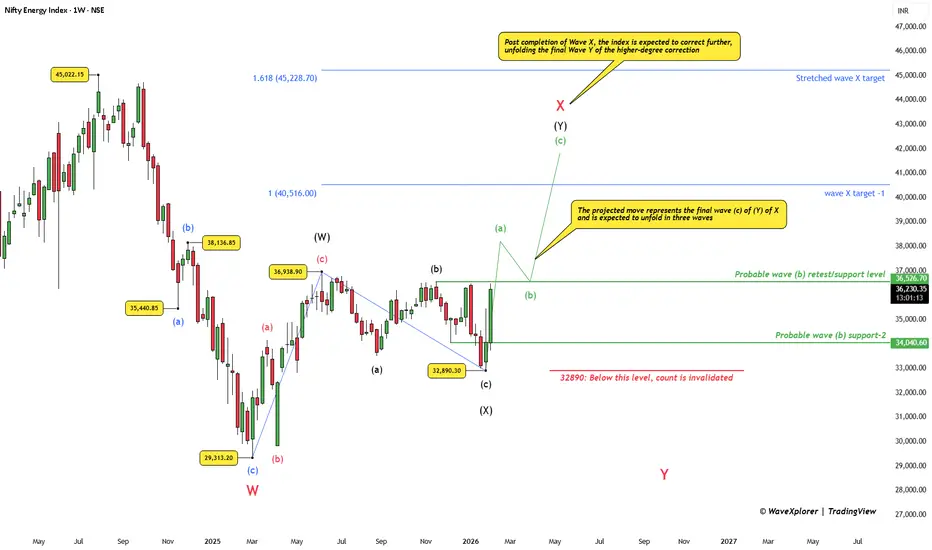
Nifty Energy: Final Bounce Before the Deeper CorrectionThe Nifty Energy Index continues to trade within a higher-degree corrective structure rather than a fresh impulsive uptrend.
The decline from the highs appears to have completed Wave W, followed by an ongoing recovery in Wave X.
In the near term, the structure allows for one more upside phase . After a probable dip in wave (b), the index may attempt a final advance via wave (c) of (Y) of X, which is expected to unfold in three waves.
This move is likely to be selective and constituent-driven. Heavyweights such as Reliance Industries, ONGC, BPCL, Tata Power, SJVN, Suzlon, NTPC, Coal India, and Power Grid Corporation may still show relative strength during this phase, contributing to the final push higher within Wave X.
However, it is important to note that this rise remains corrective in nature . It should be treated as a tactical opportunity rather than the start of a sustained bullish trend.
Once Wave X completes, the larger picture turns decisively bearish.
The index is then expected to enter Wave Y of the higher-degree correction, which could result in a sharp and more brutal decline across energy stocks, particularly if leadership from the heavyweights fades.
Key levels marked on the chart act as reference points, with a clear invalidation level below which the current corrective count would fail.
In summary:
A short-term corrective rise may still be pending, but the dominant risk lies on the downside once Wave X is done .
Disclaimer:
This analysis is for educational purposes only and does not constitute investment advice. Please do your own research (DYOR) before making any trading decisions.
Chumtrades XAUUSD Has Wave B finished?GOLD – DAILY PLAN
Has Wave B finished?
→ No confirmation yet.
Macro & Market Sentiment
US–Iran negotiations have been cancelled. Geopolitical risks remain, but not strong enough to trigger a new bullish wave.
Gold experienced a relatively calm trading session, failed to break above the key level around 5,100, and saw a moderate pullback during the US session.
The Daily candle formed a Spinning Top, indicating market indecision and consolidation, with a lack of momentum for a breakout.
👉 Macro factors are supporting prices, but not pushing the market into an immediate uptrend.
Technical Structure & Outlook
Price is still moving within a descending price channel.
On the H1 timeframe, price has broken above the 4,888 key level, showing a technical rebound.
However, the higher timeframe structure remains bearish, with no confirmed trend reversal.
→ Therefore, current rebounds are considered pullbacks within a downtrend.
Key Levels
Support: 4,810 | 4,830 | 4,700–4,750 | 4,650–4,624
Resistance: 4,950–5,000 | 5,100
Trading Scenarios
Primary strategy: Sell the rallies within the descending channel.
Look for SELL setups near resistance zones, targeting lower lows.
Momentum SELL may be considered if price clearly breaks below 4,882–4,890, with confirmation on H2 or H4, targeting around 4,810.
No BUY positions while price remains inside the descending channel.
👉 Only if price breaks and holds above 5,100, will we start reassessing a trend-following BUY scenario.
👉 Deeper pullbacks are viewed as potential zones for swing BUY opportunities, not short-term buys at this stage.
Note: The market is in a “confidence-testing” phase. Focus on zone-based trading, trend alignment, reduced position size, and avoid FOMO.

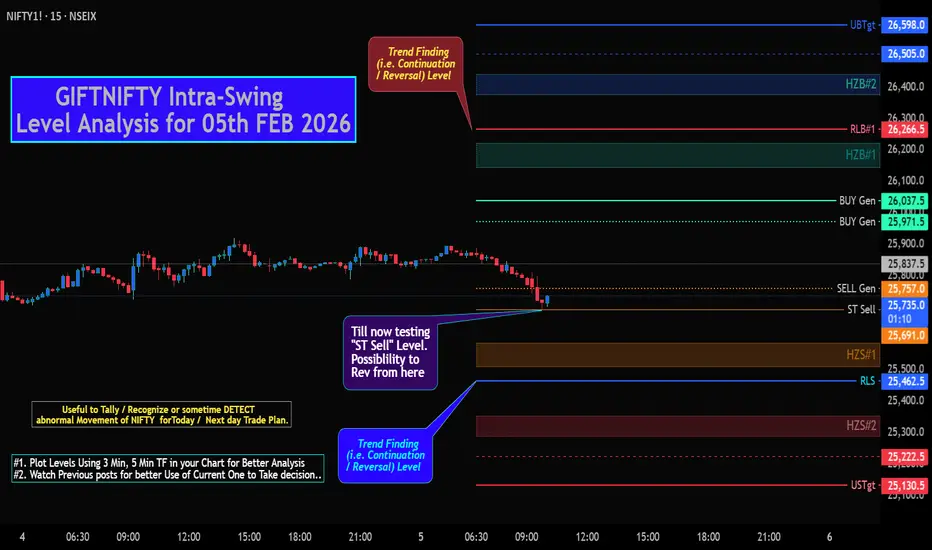
GIFTNIFTY Intra-Swing Level Analysis for 05th FEB 2026 GIFTNIFTY Intra-Swing Level Analysis for 05th FEB 2026
Till now (@ 25711) testing & try to taking Support near "ST Sell" Level.
Possibility to Rev / Further fall to "RLS-#!" level.
NIFTY PCR Data: Drastically fall in 1st hour of trade Now at 0.70 (Day Low 0.69 suggests Nauseousness)
Put OI: 19,12,094, : Call OI: 27,25,291, PCR: 0.70
Notice Intraday PCR data:
Put OI Chg: 47,140, Call OI Chg: 7,99,159l Change OI PCR: 0.06 (16 time call OI increase in 1st hour)
🚀Follow & Compare NIFTY spot Post for Taking Trade
━━━━━━━━━₹₹₹₹₹₹₹₹₹₹₹₹━━━━━━━━
💥Level Interpretation / description:
L#1: If the candle crossed & stays above the “Buy Gen”, it is treated / considered as Bullish bias.
L#2: Possibility / Probability of REVERSAL near RLB#1 & UBTgt
L#3: If the candle stays above “Sell Gen” but below “Buy Gen”, it is treated / considered as Sidewise. Aggressive Traders can take Long position near “Sell Gen” either retesting or crossed from Below & vice-versa i.e. can take Short position near “Buy Gen” either retesting or crossed downward from Above.
L#4: If the candle crossed & stays below the “Sell Gen”, it is treated / considered a Bearish bias.
L#5: Possibility / Probability of REVERSAL near RLS#1 & USTgt
HZB (Buy side) & HZS (Sell side) => Hurdle Zone,
*** Specialty of “HZB#1, HZB#2 HZS#1 & HZS#2” is Sidewise (behaviour in Nature)
Rest Plotted and Mentioned on Chart
Color code Used:
Green =. Positive bias.
Red =. Negative bias.
RED in Between Green means Trend Finder / Momentum Change
/ CYCLE Change and Vice Versa.
Notice One thing: HOW LEVELS are Working.
Use any Momentum Indicator / Oscillator or as you "USED to" to Take entry.
━━━━━━━━━━━━━━━━━━━━━━━━━━━━━━━━━━━━━━━━━━━
⚠️ DISCLAIMER:
The information, views, and ideas shared here are purely for educational and informational purposes only. They are not intended as investment advice or a recommendation to buy, sell, or hold any financial instruments. I am not a SEBI-registered financial adviser.
Trading and investing in the stock market involves risk, and you should do your own research and analysis. You are solely responsible for any decisions made based on this research.
"As HARD EARNED MONEY IS YOUR's, So DECISION SHOULD HAVE TO BE YOUR's".
━━━━━━━━━━━━━━━━━━━━━━━━━━━━━━━━━
❇️ Follow notification about periodical View
💥 Do Comment for Stock WEEKLY Level Analysis.🚀
📊 Do you agree with this view?
✈️ HIT THE PLANE ICON if this technical observation resonates with you. It will Motivate me.
━━━━━━━━━━━━━━━━━━━━━━━━━━━━━━━━━
💡 If You LOOKING any CHART & want for Level and ANALYZE?
Share your desired stock names in the comments below! I will try to analyze the chart Levels, patterns and share my technical view (so far my Knowledge).
If Viewers think It can identify meaningful setups. Looking forward to hearing from all of you — let's keep this discussion going and help each other make better trading decisions.
TCS: Structure Hints at a Possible Final PushThe move from the recent highs appears to be a Wave 4 corrective phase , unfolding in an ABC structure rather than an impulsive decline.
Price has reacted near the 0.618 Fibonacci retracement , a typical zone where Wave 4 tends to stabilize.
If this structure holds, Wave 5 could be setting up , but confirmation comes only with a reclaim of the 200-DMA and sustained strength above the recent range.
A break below 3070 would invalidate this count and signal that the correction is still evolving.
Structure first. Bias later.
Disclaimer: This analysis is for educational purposes only and does not constitute investment advice. Please do your own research (DYOR) before making any trading decisions.

NIFTY Spot Level Analysis for 05th Feb 2026+NIFTY Intra-Swing Level Analysis for 05th Feb 2026
🚀Follow & Compare NIFTY spot Post for Taking Trade
👇🏼Screenshot of NIFTY Spot All-day(04th FEB 2026) in 5 min TF.
━━━━━━━━━₹₹₹₹₹₹₹₹₹₹₹₹━━━━━━━━
💥Level Interpretation / description:
L#1: If the candle crossed & stays above the “Buy Gen”, it is treated / considered as Bullish bias.
L#2: Possibility / Probability of REVERSAL near RLB#1 & UBTgt
L#3: If the candle stays above “Sell Gen” but below “Buy Gen”, it is treated / considered as Sidewise. Aggressive Traders can take Long position near “Sell Gen” either retesting or crossed from Below & vice-versa i.e. can take Short position near “Buy Gen” either retesting or crossed downward from Above.
L#4: If the candle crossed & stays below the “Sell Gen”, it is treated / considered a Bearish bias.
L#5: Possibility / Probability of REVERSAL near RLS#1 & USTgt
HZB (Buy side) & HZS (Sell side) => Hurdle Zone,
*** Specialty of “HZB#1, HZB#2 HZS#1 & HZS#2” is Sidewise (behaviour in Nature)
Rest Plotted and Mentioned on Chart
Color code Used:
Green =. Positive bias.
Red =. Negative bias.
RED in Between Green means Trend Finder / Momentum Change
/ CYCLE Change and Vice Versa.
Notice One thing: HOW LEVELS are Working.
Use any Momentum Indicator / Oscillator or as you "USED to" to Take entry.
━━━━━━━━━━━━━━━━━━━━━━━━━━━━━━━━━━━━━━━━━━━
⚠️ DISCLAIMER:
The information, views, and ideas shared here are purely for educational and informational purposes only. They are not intended as investment advice or a recommendation to buy, sell, or hold any financial instruments. I am not a SEBI-registered financial adviser.
Trading and investing in the stock market involves risk, and you should do your own research and analysis. You are solely responsible for any decisions made based on this research.
"As HARD EARNED MONEY IS YOUR's, So DECISION SHOULD HAVE TO BE YOUR's".
━━━━━━━━━━━━━━━━━━━━━━━━━━━━━━━━━
❇️ Follow notification about periodical View
💥 Do Comment for Stock WEEKLY Level Analysis.🚀
📊 Do you agree with this view?
✈️ HIT THE PLANE ICON if this technical observation resonates with you. It will Motivate me.
━━━━━━━━━━━━━━━━━━━━━━━━━━━━━━━━━
💡 If You LOOKING any CHART & want for Level and ANALYZE?
Share your desired stock names in the comments below! I will try to analyze the chart Levels, patterns and share my technical view (so far my Knowledge).
If Viewers think It can identify meaningful setups. Looking forward to hearing from all of you — let's keep this discussion going and help each other make better trading decisions.

SENSEX Weekly Exp Level Analysis for 05th Feb 2026+SENSEX 1st Weekly EXP. After BUDGET, Market may more Choppy.
Put OI: 3,92,874, Call OI: 3,67,577, PCR: 1.07
Data Shows: Neutral to BULLISH
━━━━━━━━━₹₹₹₹₹₹₹₹₹₹₹₹━━━━━━━━
💥Level Interpretation / description:
L#1: If the candle crossed & stays above the “Buy Gen”, it is treated / considered as Bullish bias.
L#2: Possibility / Probability of REVERSAL near RLB#1 & UBTgt
L#3: If the candle stays above “Sell Gen” but below “Buy Gen”, it is treated / considered as Sidewise. Aggressive Traders can take Long position near “Sell Gen” either retesting or crossed from Below & vice-versa i.e. can take Short position near “Buy Gen” either retesting or crossed downward from Above.
L#4: If the candle crossed & stays below the “Sell Gen”, it is treated / considered a Bearish bias.
L#5: Possibility / Probability of REVERSAL near RLS#1 & USTgt
HZB (Buy side) & HZS (Sell side) => Hurdle Zone,
*** Specialty of “HZB#1, HZB#2 HZS#1 & HZS#2” is Sidewise (behaviour in Nature)
Rest Plotted and Mentioned on Chart
Color code Used:
Green =. Positive bias.
Red =. Negative bias.
RED in Between Green means Trend Finder / Momentum Change
/ CYCLE Change and Vice Versa.
Notice One thing: HOW LEVELS are Working.
Use any Momentum Indicator / Oscillator or as you "USED to" to Take entry.
━━━━━━━━━━━━━━━━━━━━━━━━━━━━━━━━━━━━━━━━━━━
⚠️ DISCLAIMER:
The information, views, and ideas shared here are purely for educational and informational purposes only. They are not intended as investment advice or a recommendation to buy, sell, or hold any financial instruments. I am not a SEBI-registered financial adviser.
Trading and investing in the stock market involves risk, and you should do your own research and analysis. You are solely responsible for any decisions made based on this research.
"As HARD EARNED MONEY IS YOUR's, So DECISION SHOULD HAVE TO BE YOUR's".
━━━━━━━━━━━━━━━━━━━━━━━━━━━━━━━━━
❇️ Follow notification about periodical View
💥 Do Comment for Stock WEEKLY Level Analysis.🚀
📊 Do you agree with this view?
✈️ HIT THE PLANE ICON if this technical observation resonates with you. It will Motivate me.
━━━━━━━━━━━━━━━━━━━━━━━━━━━━━━━━━
💡 If You LOOKING any CHART & want for Level and ANALYZE?
Share your desired stock names in the comments below! I will try to analyze the chart Levels, patterns and share my technical view (so far my Knowledge).
If Viewers think It can identify meaningful setups. Looking forward to hearing from all of you — let's keep this discussion going and help each other make better trading decisions.

GIFTNIFTY Intra-Swing Level Analysis for 04th FEB 2026GIFTNIFTY Intra-Swing Level Analysis for 04th FEB 2026
PCR Data:
Weekly Basis: Put OI: 20,31,529, Call OI: 20,33,286, PCR: 👇🏼1.00, OI Strength : Trending Bullish
Intraday Basis Put OI Chg: 8,95,450, Call OI Chg: 7,00,895, Change OI PCR: 👇🏼1.28, OI Strength : Trending Bullish
Action: No Trading, for Aggressive traders Cautious approach should be advisable.
🚀Follow & Compare NIFTY spot Post for Taking Trade
━━━━━━━━━₹₹₹₹₹₹₹₹₹₹₹₹━━━━━━━━
💥Level Interpretation / description:
L#1: If the candle crossed & stays above the “Buy Gen”, it is treated / considered as Bullish bias.
L#2: Possibility / Probability of REVERSAL near RLB#1 & UBTgt
L#3: If the candle stays above “Sell Gen” but below “Buy Gen”, it is treated / considered as Sidewise. Aggressive Traders can take Long position near “Sell Gen” either retesting or crossed from Below & vice-versa i.e. can take Short position near “Buy Gen” either retesting or crossed downward from Above.
L#4: If the candle crossed & stays below the “Sell Gen”, it is treated / considered a Bearish bias.
L#5: Possibility / Probability of REVERSAL near RLS#1 & USTgt
HZB (Buy side) & HZS (Sell side) => Hurdle Zone,
*** Specialty of “HZB#1, HZB#2 HZS#1 & HZS#2” is Sidewise (behaviour in Nature)
Rest Plotted and Mentioned on Chart
Color code Used:
Green =. Positive bias.
Red =. Negative bias.
RED in Between Green means Trend Finder / Momentum Change
/ CYCLE Change and Vice Versa.
Notice One thing: HOW LEVELS are Working.
Use any Momentum Indicator / Oscillator or as you "USED to" to Take entry.
━━━━━━━━━━━━━━━━━━━━━━━━━━━━━━━━━━━━━━━━━━━
⚠️ DISCLAIMER:
The information, views, and ideas shared here are purely for educational and informational purposes only. They are not intended as investment advice or a recommendation to buy, sell, or hold any financial instruments. I am not a SEBI-registered financial adviser.
Trading and investing in the stock market involves risk, and you should do your own research and analysis. You are solely responsible for any decisions made based on this research.
"As HARD EARNED MONEY IS YOUR's, So DECISION SHOULD HAVE TO BE YOUR's".
━━━━━━━━━━━━━━━━━━━━━━━━━━━━━━━━━
❇️ Follow notification about periodical View
💥 Do Comment for Stock WEEKLY Level Analysis.🚀
📊 Do you agree with this view?
✈️ HIT THE PLANE ICON if this technical observation resonates with you. It will Motivate me.
━━━━━━━━━━━━━━━━━━━━━━━━━━━━━━━━━
💡 If You LOOKING any CHART & want for Level and ANALYZE?
Share your desired stock names in the comments below! I will try to analyze the chart Levels, patterns and share my technical view (so far my Knowledge).
If Viewers think It can identify meaningful setups. Looking forward to hearing from all of you — let's keep this discussion going and help each other make better trading decisions.

GIFTNIFTY Intra-Swing Level Analysis for 06th FEB 2026 GIFTNIFTY Intra-Swing Level Analysis for 06th FEB 2026
NIFTY PCR data as of NOW(10.05 AM)
Weekly Basis=> Put OI: 19,42,006, Call OI: 29,96,987, PCR: 0.65. Trend Strength: Mild Bearish
Intraday Basis=> Put OI Chg: 78,788, Call OI Chg: 10,71,721, COI PCR: 0.07. Trend Strength: severe Bearish
📊GIFTNIFTY 25640 Looks Crucial Calculated as of now
🚀Follow & Compare NIFTY spot Post for Taking Trade
👇🏼Screenshot of NIFTY Spot All-day(05th FEB 2026) in 5 min TF.
━━━━━━━━━₹₹₹₹₹₹₹₹₹₹₹₹━━━━━━━━
💥Level Interpretation / description:
L#1: If the candle crossed & stays above the “Buy Gen”, it is treated / considered as Bullish bias.
L#2: Possibility / Probability of REVERSAL near RLB#1 & UBTgt
L#3: If the candle stays above “Sell Gen” but below “Buy Gen”, it is treated / considered as Sidewise. Aggressive Traders can take Long position near “Sell Gen” either retesting or crossed from Below & vice-versa i.e. can take Short position near “Buy Gen” either retesting or crossed downward from Above.
L#4: If the candle crossed & stays below the “Sell Gen”, it is treated / considered a Bearish bias.
L#5: Possibility / Probability of REVERSAL near RLS#1 & USTgt
HZB (Buy side) & HZS (Sell side) => Hurdle Zone,
*** Specialty of “HZB#1, HZB#2 HZS#1 & HZS#2” is Sidewise (behaviour in Nature)
Rest Plotted and Mentioned on Chart
Color code Used:
Green =. Positive bias.
Red =. Negative bias.
RED in Between Green means Trend Finder / Momentum Change
/ CYCLE Change and Vice Versa.
Notice One thing: HOW LEVELS are Working.
Use any Momentum Indicator / Oscillator or as you "USED to" to Take entry.
━━━━━━━━━━━━━━━━━━━━━━━━━━━━━━━━━━━━━━━━━━━
⚠️ DISCLAIMER:
The information, views, and ideas shared here are purely for educational and informational purposes only. They are not intended as investment advice or a recommendation to buy, sell, or hold any financial instruments. I am not a SEBI-registered financial adviser.
Trading and investing in the stock market involves risk, and you should do your own research and analysis. You are solely responsible for any decisions made based on this research.
"As HARD EARNED MONEY IS YOUR's, So DECISION SHOULD HAVE TO BE YOUR's".
━━━━━━━━━━━━━━━━━━━━━━━━━━━━━━━━━
❇️ Follow notification about periodical View
💥 Do Comment for Stock WEEKLY Level Analysis.🚀
📊 Do you agree with this view?
✈️ HIT THE PLANE ICON if this technical observation resonates with you. It will Motivate me.
━━━━━━━━━━━━━━━━━━━━━━━━━━━━━━━━━
💡 If You LOOKING any CHART & want for Level and ANALYZE?
Share your desired stock names in the comments below! I will try to analyze the chart Levels, patterns and share my technical view (so far my Knowledge).
If Viewers think It can identify meaningful setups. Looking forward to hearing from all of you — let's keep this discussion going and help each other make better trading decisions.
________________^^^^^^^^^^^^^^^^_________________

NIFTY Intra-Swing Level Analysis for 06th Feb 2026NIFTY Intra-Swing Level Analysis for 06th Feb 2026
Like 05th Feb 2026 25685- 25705 Looks Crucial for tomorrow(06/02/2026)
If Stays Above mentioned level for 15-30 min may hit 25851, 25965 - 25975+
👇🏼Screenshot of NIFTY Spot All-day(05th FEB 2026) in 3 min TF.
🚀Follow GIFTNIFTY Post for NF levels
👇🏼Screenshot of GIFTNIFTY All-day(05thd FEB 2026) in 5 min TF..
━━━━━━━━━₹₹₹₹₹₹₹₹₹₹₹₹━━━━━━━━
💥Level Interpretation / description:
L#1: If the candle crossed & stays above the “Buy Gen”, it is treated / considered as Bullish bias.
L#2: Possibility / Probability of REVERSAL near RLB#1 & UBTgt
L#3: If the candle stays above “Sell Gen” but below “Buy Gen”, it is treated / considered as Sidewise. Aggressive Traders can take Long position near “Sell Gen” either retesting or crossed from Below & vice-versa i.e. can take Short position near “Buy Gen” either retesting or crossed downward from Above.
L#4: If the candle crossed & stays below the “Sell Gen”, it is treated / considered a Bearish bias.
L#5: Possibility / Probability of REVERSAL near RLS#1 & USTgt
HZB (Buy side) & HZS (Sell side) => Hurdle Zone,
*** Specialty of “HZB#1, HZB#2 HZS#1 & HZS#2” is Sidewise (behaviour in Nature)
Rest Plotted and Mentioned on Chart
Color code Used:
Green =. Positive bias.
Red =. Negative bias.
RED in Between Green means Trend Finder / Momentum Change
/ CYCLE Change and Vice Versa.
Notice One thing: HOW LEVELS are Working.
Use any Momentum Indicator / Oscillator or as you "USED to" to Take entry.
━━━━━━━━━━━━━━━━━━━━━━━━━━━━━━━━━━━━━━━━━━━
⚠️ DISCLAIMER:
The information, views, and ideas shared here are purely for educational and informational purposes only. They are not intended as investment advice or a recommendation to buy, sell, or hold any financial instruments. I am not a SEBI-registered financial adviser.
Trading and investing in the stock market involves risk, and you should do your own research and analysis. You are solely responsible for any decisions made based on this research.
"As HARD EARNED MONEY IS YOUR's, So DECISION SHOULD HAVE TO BE YOUR's".
━━━━━━━━━━━━━━━━━━━━━━━━━━━━━━━━━
❇️ Follow notification about periodical View
💥 Do Comment for Stock WEEKLY Level Analysis.🚀
📊 Do you agree with this view?
✈️ HIT THE PLANE ICON if this technical observation resonates with you. It will Motivate me.
━━━━━━━━━━━━━━━━━━━━━━━━━━━━━━━━━
💡 If You LOOKING any CHART & want for Level and ANALYZE?
Share your desired stock names in the comments below! I will try to analyze the chart Levels, patterns and share my technical view (so far my Knowledge).
If Viewers think It can identify meaningful setups. Looking forward to hearing from all of you — let's keep this discussion going and help each other make better trading decisions.________________^^^^^^^^^^^^^^^^_________________

$ETH in a descending impulse wave headed to $,681On the ETH chart, I see an impulse wave headed down to $1,681. It started at the peak on 23 Aug 2025 and Wave 3 completed almost at the 1.618 @ $2,619. Wave 5 will complete at the 2.618 @ $1,681, which aligns with the bottom of the wedge in place since Jun 2022 (and which also tagged the April 2025 bottom)

Positional or Longterm Opportunity in Triveni TurbineGo Long @ 506.5 for Targets of 619, 670, 721, and 818 with SL 462
Reasons to go Long :
1. On Weekly timeframe If we draw Fibonacci retracement from the recent swing low (A) to the swing high (B) then the stock took support from the 0.5 Fibonacci level.
2. In addition to this, the stock formed a Bullish Engulfing Pattern (marked with a orange color) around 0.5 Fibonacci level.
3. Also there is a strong demand zone (marked with a purple color) from which the stock is taking support.

Wave B Has Rebounded 15% Bottom Confirmed at 4,400?Wave B Has Rebounded 15% – Final Bottom or a Trap Before Wave C?
After a strong rally in yesterday’s Asian session, gold moved into consolidation during the European and US sessions, with a failed breakout late in the US session. In today’s Asian session, price broke above the 4,882–4,960 range, confirming it as a new buy-side base.
Gold has rebounded ~15% from the 4,404 area, driven by dip-buying demand and rising US–Iran geopolitical tensions, which remain a key catalyst alongside this week’s economic data.
From an Elliott Wave perspective, 4,400 marks the Wave A bottom. The market is now in a Wave B corrective rebound, with potential upside toward 5,140 – 5,200 – 5,220. Once Wave B completes, Wave C may follow, where signs of weakness and distribution will be watched to identify new swing-buy zones after the correction.
Support: 4,990–4,950 | 4,880–4,890 | 4,780–4,750 | 4,650–4,624
Resistance: 5,140 | 5,200 | 5,220
Note: Volatility remains elevated. Trade cautiously with strict risk and capital management.

ITC Level Analysis for 04th FEB 2026+Contd. to 03rd Feb Post.....
⚠️ Due to Impact of EX-Dividend of Rs 6.50/Share,
ITC May Open Near "RLS#1" level
Best level to enter between "RLS#2 & USTgt
Screen shot in 5 min TF
━━━━━━━━━₹₹₹₹₹₹₹₹₹₹₹₹━━━━━━━━
💥Level Interpretation / description:
L#1: If the candle crossed & stays above the “Buy Gen”, it is treated / considered as Bullish bias.
L#2: Possibility / Probability of REVERSAL near RLB#1 & UBTgt
L#3: If the candle stays above “Sell Gen” but below “Buy Gen”, it is treated / considered as Sidewise. Aggressive Traders can take Long position near “Sell Gen” either retesting or crossed from Below & vice-versa i.e. can take Short position near “Buy Gen” either retesting or crossed downward from Above.
L#4: If the candle crossed & stays below the “Sell Gen”, it is treated / considered a Bearish bias.
L#5: Possibility / Probability of REVERSAL near RLS#1 & USTgt
HZB (Buy side) & HZS (Sell side) => Hurdle Zone,
*** Specialty of “HZB#1, HZB#2 HZS#1 & HZS#2” is Sidewise (behaviour in Nature)
Rest Plotted and Mentioned on Chart
Color code Used:
Green =. Positive bias.
Red =. Negative bias.
RED in Between Green means Trend Finder / Momentum Change
/ CYCLE Change and Vice Versa.
Notice One thing: HOW LEVELS are Working.
Use any Momentum Indicator / Oscillator or as you "USED to" to Take entry.
━━━━━━━━━━━━━━━━━━━━━━━━━━━━━━━━━━━━━━━━━━━
⚠️ DISCLAIMER:
The information, views, and ideas shared here are purely for educational and informational purposes only. They are not intended as investment advice or a recommendation to buy, sell, or hold any financial instruments. I am not a SEBI-registered financial adviser.
Trading and investing in the stock market involves risk, and you should do your own research and analysis. You are solely responsible for any decisions made based on this research.
"As HARD EARNED MONEY IS YOUR's, So DECISION SHOULD HAVE TO BE YOUR's".
━━━━━━━━━━━━━━━━━━━━━━━━━━━━━━━━━
❇️ Follow notification about periodical View
💥 Do Comment for Stock WEEKLY Level Analysis.🚀
📊 Do you agree with this view?
✈️ HIT THE PLANE ICON if this technical observation resonates with you. It will Motivate me.
━━━━━━━━━━━━━━━━━━━━━━━━━━━━━━━━━
💡 If You LOOKING any CHART & want for Level and ANALYZE?
Share your desired stock names in the comments below! I will try to analyze the chart Levels, patterns and share my technical view (so far my Knowledge).
If Viewers think It can identify meaningful setups. Looking forward to hearing from all of you — let's keep this discussion going and help each other make better trading decisions.

FOXCONN of India - A overlook on DIXON TECHNSE:DIXON
Hey Folks,
Today we are talking about Dixon Technologies aka foxconn of India. the Q3 results shows +68% in PAT. which looks good as headline numbers. but diving deep I found that Dixon tech slides over a thin margin module as it is high-volume producer to marquee clients and that operating margin didn't show up as good as the other metrics, which seems attractive.
So, considering current geopolitics any slight hike in raw material could easily affect the operating cost thus affect on the profits.
But Yesterday, we found out the US INDIA Trade Deal out of blue which likely seemed to give more edge to the company in the export service. also the New budget aligns in favour with the manufacturing sector, that's also likely to give certain edge if the company keep the capital expenditure in check with the expectation to the last quarter.
Now, looking technically for long term perspective on the weekly chart. it has sustained above the 200EMA with a large green candle today. Also it closed above the last key support of 10650 (horizontal line in the chart). next target is the 0.78 level of fib i.e. 11700 to tackle. if it breaks that finds it fair value above that zone. we might see the new high of DIXON in near future.
I do not complicate much in technicals for long term view. So open to discussion how you look at it.
:) Thanks. Happy trading.

BACK to PAVILION! Focus on technicals now! As analysed NIFTY couldn’t sustain itself at higher levels and fell unidirectionally but it managed to close above our demand zone. As per our analysis, NIFTY is still weak and might continue its bearishness hence unless we see signs of reversal from 25500, every rise can be sold and can be traded based on technicals so plan your trades accordingly and keep watching everyone.

Tiindia 1w, 3 feb, reversal begins#TIINDIA
Reversal begans for murugappa group company.
Hercules cycle manufacturers and several auto parts in one car.
Shown waterfall one sided, now two green candles formed.
Wait for third candle to form and then we may see a three soldier pattern..
#tiindia

RELIANCE Set for 2026 Catalysts-Intraswing for 28th JAN 2026🔥Reliance Industries Set for 2026 Catalysts.
💯ARPU Skyrockets, and Mahakal New Energy Domination – 💥 ₹1,800 Target Locked!"
SCreenshot: Reliance Industries Ignites 2026 Boom - RELIANCE Positional Level Analysis
++++++++$$$$$$$$$$$++++++++
💥Level Interpretation / description:
L#1: If the candle crossed & stays above the “Buy Gen”, it is treated / considered as Bullish bias.
L#2: Possibility / Probability of REVERSAL near RLB#1 & UBTgt
L#3: If the candle stays above “Sell Gen” but below “Buy Gen”, it is treated / considered as Sidewise. Aggressive Traders can take Long position near “Sell Gen” either retesting or crossed from Below & vice-versa i.e. can take Short position near “Buy Gen” either retesting or crossed downward from Above.
L#4: If the candle crossed & stays below the “Sell Gen”, it is treated / considered a Bearish bias.
L#5: Possibility / Probability of REVERSAL near RLS#1 & USTgt
HZB (Buy side) & HZS (Sell side) => Hurdle Zone,
*** Specialty of “HZB#1, HZB#2 HZS#1 & HZS#2” is Sidewise (behaviour in Nature)
Rest Plotted and Mentioned on Chart
Color code Used:
Green =. Positive bias.
Red =. Negative bias.
RED in Between Green means Trend Finder / Momentum Change
/ CYCLE Change and Vice Versa.
Notice One thing: HOW LEVELS are Working.
Use any Momentum Indicator / Oscillator or as you "USED to" to Take entry.
━━━━━━━━━━━━━━━━━━━━━━━━━━━━━━━━━━━━━━━━━━━
⚠️ DISCLAIMER:
The information, views, and ideas shared here are purely for educational and informational purposes only. They are not intended as investment advice or a recommendation to buy, sell, or hold any financial instruments. I am not a SEBI-registered financial adviser.
Trading and investing in the stock market involves risk, and you should do your own research and analysis. You are solely responsible for any decisions made based on this research.
"As HARD EARNED MONEY IS YOUR's, So DECISION SHOULD HAVE TO BE YOUR's".
━━━━━━━━━━━━━━━━━━━━━━━━━━━━━━━━━
❇️ Follow notification about periodical View
💥 Do Comment for Stock WEEKLY Level Analysis.🚀
📊 Do you agree with this view?
✈️ HIT THE PLANE ICON if this technical observation resonates with you. It will Motivate me.
━━━━━━━━━━━━━━━━━━━━━━━━━━━━━━━━━
💡 If You LOOKING any CHART & want for Level and ANALYZE?
Share your desired stock names in the comments below! I will try to analyze the chart Levels, patterns and share my technical view (so far my Knowledge).
If Viewers think It can identify meaningful setups. Looking forward to hearing from all of you — let's keep this discussion going and help each other make better trading decisions.

NIFTY Intra-Swing Level Analysis for 04th Feb 2026NIFTY Intra-Swing Level Analysis: for 04th Feb 2026
🚀Follow GIFTNIFTY Post for NF levels
━━━━₹₹₹₹₹━━━━━₹₹₹₹₹━━━━
📊PCR Data - 10th Feb 2026 EXP. Basis:
Put OI: 11,36,079, Call OI: 13,32,391, PCR: 0.85 , As per OI Strength => Neutral to Bearish (Excluding Global Event)
Intraday Basis=> Put OI Chg: 5,91,996, Call OI Chg: 7,19,434, Change OI PCR: 0.82
━━━━━━━━━₹₹₹₹₹₹₹₹₹₹₹₹━━━━━━━━
💥Level Interpretation / description:
L#1: If the candle crossed & stays above the “Buy Gen”, it is treated / considered as Bullish bias.
L#2: Possibility / Probability of REVERSAL near RLB#1 & UBTgt
L#3: If the candle stays above “Sell Gen” but below “Buy Gen”, it is treated / considered as Sidewise. Aggressive Traders can take Long position near “Sell Gen” either retesting or crossed from Below & vice-versa i.e. can take Short position near “Buy Gen” either retesting or crossed downward from Above.
L#4: If the candle crossed & stays below the “Sell Gen”, it is treated / considered a Bearish bias.
L#5: Possibility / Probability of REVERSAL near RLS#1 & USTgt
HZB (Buy side) & HZS (Sell side) => Hurdle Zone,
*** Specialty of “HZB#1, HZB#2 HZS#1 & HZS#2” is Sidewise (behaviour in Nature)
Rest Plotted and Mentioned on Chart
Color code Used:
Green =. Positive bias.
Red =. Negative bias.
RED in Between Green means Trend Finder / Momentum Change
/ CYCLE Change and Vice Versa.
Notice One thing: HOW LEVELS are Working.
Use any Momentum Indicator / Oscillator or as you "USED to" to Take entry.
━━━━━━━━━━━━━━━━━━━━━━━━━━━━━━━━━━━━━━━━━━━
⚠️ DISCLAIMER:
The information, views, and ideas shared here are purely for educational and informational purposes only. They are not intended as investment advice or a recommendation to buy, sell, or hold any financial instruments. I am not a SEBI-registered financial adviser.
Trading and investing in the stock market involves risk, and you should do your own research and analysis. You are solely responsible for any decisions made based on this research.
"As HARD EARNED MONEY IS YOUR's, So DECISION SHOULD HAVE TO BE YOUR's".
━━━━━━━━━━━━━━━━━━━━━━━━━━━━━━━━━
❇️ Follow notification about periodical View
💥 Do Comment for Stock WEEKLY Level Analysis.🚀
📊 Do you agree with this view?
✈️ HIT THE PLANE ICON if this technical observation resonates with you. It will Motivate me.
━━━━━━━━━━━━━━━━━━━━━━━━━━━━━━━━━
💡 If You LOOKING any CHART & want for Level and ANALYZE?
Share your desired stock names in the comments below! I will try to analyze the chart Levels, patterns and share my technical view (so far my Knowledge).
If Viewers think It can identify meaningful setups. Looking forward to hearing from all of you — let's keep this discussion going and help each other make better trading decisions.

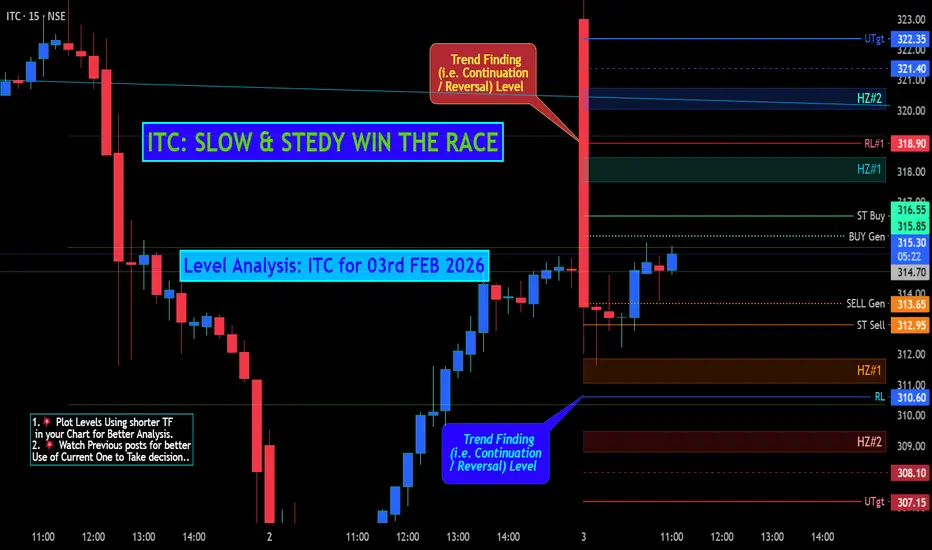
ITC: SLOW & STEDY WIN THE RACE 03rd FEB 2026+ Level AnalysisITC: SLOW & STEDY WIN THE RACE
Level Analysis: ITC for 03rd FEB 2026
━━━━━━━━━₹₹₹₹₹₹₹₹₹₹₹₹━━━━━━━━
💥Level Interpretation / description:
L#1: If the candle crossed & stays above the “Buy Gen”, it is treated / considered as Bullish bias.
L#2: Possibility / Probability of REVERSAL near RLB#1 & UBTgt
L#3: If the candle stays above “Sell Gen” but below “Buy Gen”, it is treated / considered as Sidewise. Aggressive Traders can take Long position near “Sell Gen” either retesting or crossed from Below & vice-versa i.e. can take Short position near “Buy Gen” either retesting or crossed downward from Above.
L#4: If the candle crossed & stays below the “Sell Gen”, it is treated / considered a Bearish bias.
L#5: Possibility / Probability of REVERSAL near RLS#1 & USTgt
HZB (Buy side) & HZS (Sell side) => Hurdle Zone,
*** Specialty of “HZB#1, HZB#2 HZS#1 & HZS#2” is Sidewise (behaviour in Nature)
Rest Plotted and Mentioned on Chart
Color code Used:
Green =. Positive bias.
Red =. Negative bias.
RED in Between Green means Trend Finder / Momentum Change
/ CYCLE Change and Vice Versa.
Notice One thing: HOW LEVELS are Working.
Use any Momentum Indicator / Oscillator or as you "USED to" to Take entry.
━━━━━━━━━━━━━━━━━━━━━━━━━━━━━━━━━━━━━━━━━━━
⚠️ DISCLAIMER:
The information, views, and ideas shared here are purely for educational and informational purposes only. They are not intended as investment advice or a recommendation to buy, sell, or hold any financial instruments. I am not a SEBI-registered financial adviser.
Trading and investing in the stock market involves risk, and you should do your own research and analysis. You are solely responsible for any decisions made based on this research.
"As HARD EARNED MONEY IS YOUR's, So DECISION SHOULD HAVE TO BE YOUR's".
━━━━━━━━━━━━━━━━━━━━━━━━━━━━━━━━━
❇️ Follow notification about periodical View
💥 Do Comment for Stock WEEKLY Level Analysis.🚀
📊 Do you agree with this view?
✈️ HIT THE PLANE ICON if this technical observation resonates with you. It will Motivate me.
━━━━━━━━━━━━━━━━━━━━━━━━━━━━━━━━━
💡 If You LOOKING any CHART & want for Level and ANALYZE?
Share your desired stock names in the comments below! I will try to analyze the chart Levels, patterns and share my technical view (so far my Knowledge).
If Viewers think It can identify meaningful setups. Looking forward to hearing from all of you — let's keep this discussion going and help each other make better trading decisions.
GIFTNIFTY Intra-Swing Level Analysis for 03rd FEB 2026GIFTNIFTY Intra-Swing Level Analysis for 03rd FEB 2026
🚀Follow & Compare NIFTY spot Post for Taking Trade
━━━━━━━━━₹₹₹₹₹₹₹₹₹₹₹₹━━━━━━━━
💥Level Interpretation / description:
L#1: If the candle crossed & stays above the “Buy Gen”, it is treated / considered as Bullish bias.
L#2: Possibility / Probability of REVERSAL near RLB#1 & UBTgt
L#3: If the candle stays above “Sell Gen” but below “Buy Gen”, it is treated / considered as Sidewise. Aggressive Traders can take Long position near “Sell Gen” either retesting or crossed from Below & vice-versa i.e. can take Short position near “Buy Gen” either retesting or crossed downward from Above.
L#4: If the candle crossed & stays below the “Sell Gen”, it is treated / considered a Bearish bias.
L#5: Possibility / Probability of REVERSAL near RLS#1 & USTgt
HZB (Buy side) & HZS (Sell side) => Hurdle Zone,
*** Specialty of “HZB#1, HZB#2 HZS#1 & HZS#2” is Sidewise (behaviour in Nature)
Rest Plotted and Mentioned on Chart
Color code Used:
Green =. Positive bias.
Red =. Negative bias.
RED in Between Green means Trend Finder / Momentum Change
/ CYCLE Change and Vice Versa.
Notice One thing: HOW LEVELS are Working.
Use any Momentum Indicator / Oscillator or as you "USED to" to Take entry.
━━━━━━━━━━━━━━━━━━━━━━━━━━━━━━━━━━━━━━━━━━━
⚠️ DISCLAIMER:
The information, views, and ideas shared here are purely for educational and informational purposes only. They are not intended as investment advice or a recommendation to buy, sell, or hold any financial instruments. I am not a SEBI-registered financial adviser.
Trading and investing in the stock market involves risk, and you should do your own research and analysis. You are solely responsible for any decisions made based on this research.
"As HARD EARNED MONEY IS YOUR's, So DECISION SHOULD HAVE TO BE YOUR's".
━━━━━━━━━━━━━━━━━━━━━━━━━━━━━━━━━
❇️ Follow notification about periodical View
💥 Do Comment for Stock WEEKLY Level Analysis.🚀
📊 Do you agree with this view?
✈️ HIT THE PLANE ICON if this technical observation resonates with you. It will Motivate me.
━━━━━━━━━━━━━━━━━━━━━━━━━━━━━━━━━
💡 If You LOOKING any CHART & want for Level and ANALYZE?
Share your desired stock names in the comments below! I will try to analyze the chart Levels, patterns and share my technical view (so far my Knowledge).
If Viewers think It can identify meaningful setups. Looking forward to hearing from all of you — let's keep this discussion going and help each other make better trading decisions.

NIFTY Positional Level Analysis for 03/02/2026+ USA Rate CutNIFTY Positional Level Analysis for 03rd Feb 2026+
❇️ IMPACT of USA Tariff Cut Announcement
on February 2, 2026 Published NEW Levels
👇🏼Screenshot of NIFTY Spot All-day(02nd FEB 2026 at 1.23 AM) in 15 min TF.
On February 2, 2026, US President Donald Trump announced a significant trade deal with India, reducing tariffs on Indian goods from 25% to 18% effective immediately, following a phone call with Indian Prime Minister Narendra Modi. This move also includes dropping a separate 25% tariff imposed in August 2025 on Indian imports due to India's purchases of Russian oil, in exchange for India's commitment to cease those imports. The effective tariff rate on Indian exports to the US will now stand at 18%, down from a combined 50% in some interpretations.
❇️ Key Deal Elements
Tariff Reductions: US reciprocal tariffs on Indian goods reduced to 18% from 25%, with the additional 25% "fentanyl-related" tariff (linked to Russian oil) fully removed. India agreed to reduce its tariffs and non-tariff barriers on US goods to zero in reciprocation.
Russian Oil Pledge: India committed to halting purchases of Russian-origin oil, uranium, natural gas, and related products, addressing US concerns over sanctions evasion. This aligns with potential US legislation like the Sanctioning Russia Act of 2025.
US Purchases from India: As part of the deal, the US agreed to purchase $500 billion worth of Indian energy, technology, agriculture, coal, and other products.
Litigation Context: The announcement follows ongoing US court challenges to Trump's tariff authority, including a Federal Circuit ruling in September 2025 that partially invalidated similar "fentanyl" and reciprocal tariffs, though stayed pending Supreme Court appeal (oral arguments heard November 2025).
❇️ Background and Strategic Implications
Tariff History: The initial 25% reciprocal tariff was imposed in August 2025, escalating to 50% with an additional levy tied to India's Russian oil imports amid the Ukraine conflict. This deal defuses tensions, especially post-Trump's reelection and focus on global trade imbalances.
For India: Significant relief for exporters (e.g., textiles, pharma, IT services), potentially boosting bilateral trade from $200+ billion annually. It also aligns with India's diversification from Russian energy amid global pressures.
Market Reaction: I ndian stocks / Index future (e.g., GIFTNIFTY) rallied 4+% on the news, with export-oriented sectors like auto and textiles gaining. Rupee strengthened slightly against USD. However, some criticism on social media views it as a "surrender" to US pressure, reducing India's leverage.
🚀Follow & Compare NIFTY spot Post for Taking Trade
🚀Follow GIFTNIFTY Post for NF levels
━━━━━━━━━₹₹₹₹₹₹₹₹₹₹₹₹━━━━━━━━
💥Level Interpretation / description:
L#1: If the candle crossed & stays above the “Buy Gen”, it is treated / considered as Bullish bias.
L#2: Possibility / Probability of REVERSAL near RLB#1 & UBTgt
L#3: If the candle stays above “Sell Gen” but below “Buy Gen”, it is treated / considered as Sidewise. Aggressive Traders can take Long position near “Sell Gen” either retesting or crossed from Below & vice-versa i.e. can take Short position near “Buy Gen” either retesting or crossed downward from Above.
L#4: If the candle crossed & stays below the “Sell Gen”, it is treated / considered a Bearish bias.
L#5: Possibility / Probability of REVERSAL near RLS#1 & USTgt
HZB (Buy side) & HZS (Sell side) => Hurdle Zone,
*** Specialty of “HZB#1, HZB#2 HZS#1 & HZS#2” is Sidewise (behaviour in Nature)
Rest Plotted and Mentioned on Chart
Color code Used:
Green =. Positive bias.
Red =. Negative bias.
RED in Between Green means Trend Finder / Momentum Change
/ CYCLE Change and Vice Versa.
Notice One thing: HOW LEVELS are Working.
Use any Momentum Indicator / Oscillator or as you "USED to" to Take entry.
━━━━━━━━━━━━━━━━━━━━━━━━━━━━━━━━━━━━━━━━━━━
⚠️ DISCLAIMER:
The information, views, and ideas shared here are purely for educational and informational purposes only. They are not intended as investment advice or a recommendation to buy, sell, or hold any financial instruments. I am not a SEBI-registered financial adviser.
Trading and investing in the stock market involves risk, and you should do your own research and analysis. You are solely responsible for any decisions made based on this research.
"As HARD EARNED MONEY IS YOUR's, So DECISION SHOULD HAVE TO BE YOUR's".
━━━━━━━━━━━━━━━━━━━━━━━━━━━━━━━━━
❇️ Follow notification about periodical View
💥 Do Comment for Stock WEEKLY Level Analysis.🚀
📊 Do you agree with this view?
✈️ HIT THE PLANE ICON if this technical observation resonates with you. It will Motivate me.
━━━━━━━━━━━━━━━━━━━━━━━━━━━━━━━━━
💡 If You LOOKING any CHART & want for Level and ANALYZE?
Share your desired stock names in the comments below! I will try to analyze the chart Levels, patterns and share my technical view (so far my Knowledge).
If Viewers think It can identify meaningful setups. Looking forward to hearing from all of you — let's keep this discussion going and help each other make better trading decisions.

ABCapital -> A Clear opportunity.Currently playing larger wave 3.
Played all earlier sub waves perfectly.
Currently playing sub wave C of 4 of 5 of 3.
Well aligned with fib ratio's.
Also clear divergence in RSI.
Minimum target of 335/-(Around 5%) is very much possible in short term.
