XAUUSD (ONDA) IntraSwing Levels For 02nd - 03rd JAN2026(3.30 am) $💰$ 🏃🏽 🏃🏼♀️ 🏃🏽♂️ $💰$
💥 Have a Pr💰fitable
New Year 2️⃣0️⃣2️⃣6️⃣🚀
1st Trading Day of New SUN
💥Level Interpretation / description:
L#1: If the candle crossed & stays above the “Buy Gen”, it is treated / considered as Bullish bias.
L#2: Possibility / Probability of REVERSAL near RLB#1 & UBTgt
L#3: If the candle stays above “Sell Gen” but below “Buy Gen”, it is treated / considered as Sidewise. Aggressive Traders can take Long position near “Sell Gen” either retesting or crossed from Below & vice-versa i.e. can take Short position near “Buy Gen” either retesting or crossed downward from Above.
L#4: If the candle crossed & stays below the “Sell Gen”, it is treated / considered a Bearish bias.
L#5: Possibility / Probability of REVERSAL near RLS#1 & USTgt
HZB (Buy side) & HZS (Sell side) => Hurdle Zone,
*** Specialty of “HZB#1, HZB#2 HZS#1 & HZS#2” is Sidewise (behaviour in Nature)
Rest Plotted and Mentioned on Chart
Color code Used:
Green =. Positive bias.
Red =. Negative bias.
RED in Between Green means Trend Finder / Momentum Change
/ CYCLE Change and Vice Versa.
Notice One thing: HOW LEVELS are Working.
Use any Momentum Indicator / Oscillator or as you "USED to" to Take entry.
⚠️ DISCLAIMER:
The information, views, and ideas shared here are purely for educational and informational purposes only. They are not intended as investment advice or a recommendation to buy, sell, or hold any financial instruments. I am not a SEBI-registered financial adviser.
Trading and investing in the stock market involves risk, and you should do your own research and analysis. You are solely responsible for any decisions made based on this research.
"As HARD EARNED MONEY IS YOUR's, So DECISION SHOULD HAVE TO BE YOUR's".
Do comment if Helpful .
Do Comment for In depth Analysis.
❇️ Follow notification about periodical View
💥 Do Comment for Stock WEEKLY Level Analysis.🚀
Fibonacci

GIFTNIFTY IntraSwing Levels For 02nd JAN 2026🚀Follow & Calculate Premium with NIFTY Post for NF Trading
💥Level Interpretation / description:
L#1: If the candle crossed & stays above the “Buy Gen”, it is treated / considered as Bullish bias.
L#2: Possibility / Probability of REVERSAL near RLB#1 & UBTgt
L#3: If the candle stays above “Sell Gen” but below “Buy Gen”, it is treated / considered as Sidewise. Aggressive Traders can take Long position near “Sell Gen” either retesting or crossed from Below & vice-versa i.e. can take Short position near “Buy Gen” either retesting or crossed downward from Above.
L#4: If the candle crossed & stays below the “Sell Gen”, it is treated / considered a Bearish bias.
L#5: Possibility / Probability of REVERSAL near RLS#1 & USTgt
HZB (Buy side) & HZS (Sell side) => Hurdle Zone,
*** Specialty of “HZB#1, HZB#2 HZS#1 & HZS#2” is Sidewise (behaviour in Nature)
Rest Plotted and Mentioned on Chart
Color code Used:
Green =. Positive bias.
Red =. Negative bias.
RED in Between Green means Trend Finder / Momentum Change
/ CYCLE Change and Vice Versa.
Notice One thing: HOW LEVELS are Working.
Use any Momentum Indicator / Oscillator or as you "USED to" to Take entry.
⚠️ DISCLAIMER:
The information, views, and ideas shared here are purely for educational and informational purposes only. They are not intended as investment advice or a recommendation to buy, sell, or hold any financial instruments. I am not a SEBI-registered financial adviser.
Trading and investing in the stock market involves risk, and you should do your own research and analysis. You are solely responsible for any decisions made based on this research.
"As HARD EARNED MONEY IS YOUR's, So DECISION SHOULD HAVE TO BE YOUR's".
Do comment if Helpful .
Do Comment for In depth Analysis.
❇️ Follow notification about periodical View
💥 Do Comment for Stock WEEKLY Level Analysis.🚀

Chumtrades XAUUSD Weekly Key Levels
Bias: Still favor BUY with the primary trend, watching for pullbacks to lower levels.
Support zones
4307 – 4300 (near-term support, key area to watch)
4260 – 4255 – 4250 (intermediate support)
4178 – 4168 (deep support, strong demand)
Resistance zones
4404 – 4413
4445 – 4465
4500 (ATH)
Weekly / Intraday scenario
Market is likely to trade in a range today.
Expected range:
Lower bound: 4300
Upper bound: 4513
👉 Overall strategy: Monitor price reaction at support zones, especially 4300 and below.

NIFTY Analysis for 2nd JAN '26: IntraSwing Spot level🚀Follow GIFTNIFTY Post for NF levels
💥Level Interpretation / description:
L#1: If the candle crossed & stays above the “Buy Gen”, it is treated / considered as Bullish bias.
L#2: Possibility / Probability of REVERSAL near RLB#1 & UBTgt
L#3: If the candle stays above “Sell Gen” but below “Buy Gen”, it is treated / considered as Sidewise. Aggressive Traders can take Long position near “Sell Gen” either retesting or crossed from Below & vice-versa i.e. can take Short position near “Buy Gen” either retesting or crossed downward from Above.
L#4: If the candle crossed & stays below the “Sell Gen”, it is treated / considered a Bearish bias.
L#5: Possibility / Probability of REVERSAL near RLS#1 & USTgt
HZB (Buy side) & HZS (Sell side) => Hurdle Zone,
*** Specialty of “HZB#1, HZB#2 HZS#1 & HZS#2” is Sidewise (behaviour in Nature)
Rest Plotted and Mentioned on Chart
Color code Used:
Green =. Positive bias.
Red =. Negative bias.
RED in Between Green means Trend Finder / Momentum Change
/ CYCLE Change and Vice Versa.
Notice One thing: HOW LEVELS are Working.
Use any Momentum Indicator / Oscillator or as you "USED to" to Take entry.
⚠️ DISCLAIMER:
The information, views, and ideas shared here are purely for educational and informational purposes only. They are not intended as investment advice or a recommendation to buy, sell, or hold any financial instruments. I am not a SEBI-registered financial adviser.
Trading and investing in the stock market involves risk, and you should do your own research and analysis. You are solely responsible for any decisions made based on this research.
"As HARD EARNED MONEY IS YOUR's, So DECISION SHOULD HAVE TO BE YOUR's".
Do comment if Helpful .
Do Comment for In depth Analysis.
❇️ Follow notification about periodical View
💥 Do Comment for Stock WEEKLY Level Analysis.🚀

reversal ? same as nifty ,
i am 80% bearsih in bn
avoid trading in range,
if Breakout and breakdown sustained then only take that side trade
if Breakout and breakdown failed then take contra trade
don't trade in fomo take , confirmation before entering trade

range break out ? avoid trading in range,
if breakdown are Breakout sustained and then only take trade,
if breakdown are Breakout failed then take contra trade,
70% bearish 30% bullish

GIFTNIFTY IntraSwing Levels For 01st JAN 2026🏃🏽🏃🏼♀️🏃🏽♂️💰2️⃣0️⃣2️⃣6️⃣🇪🇬 🇪🇬 💥🚀🥇🥈₹₹₹
₹₹₹ 🏃🏽 🏃🏼♀️ 🏃🏽♂️ 🏃🏽 🏃🏼♀️ 🏃🏽♂️ ₹₹₹
💥 Have a Pr💰fitable New Year 2️⃣0️⃣2️⃣6️⃣🚀
💥Level Interpretation / description:
L#1: If the candle crossed & stays above the “Buy Gen”, it is treated / considered as Bullish bias.
L#2: Possibility / Probability of REVERSAL near RLB#1 & UBTgt
L#3: If the candle stays above “Sell Gen” but below “Buy Gen”, it is treated / considered as Sidewise. Aggressive Traders can take Long position near “Sell Gen” either retesting or crossed from Below & vice-versa i.e. can take Short position near “Buy Gen” either retesting or crossed downward from Above.
L#4: If the candle crossed & stays below the “Sell Gen”, it is treated / considered a Bearish bias.
L#5: Possibility / Probability of REVERSAL near RLS#1 & USTgt
HZB (Buy side) & HZS (Sell side) => Hurdle Zone,
*** Specialty of “HZB#1, HZB#2 HZS#1 & HZS#2” is Sidewise (behaviour in Nature)
Rest Plotted and Mentioned on Chart
Color code Used:
Green =. Positive bias.
Red =. Negative bias.
RED in Between Green means Trend Finder / Momentum Change
/ CYCLE Change and Vice Versa.
Notice One thing: HOW LEVELS are Working.
Use any Momentum Indicator / Oscillator or as you "USED to" to Take entry.
⚠️ DISCLAIMER:
The information, views, and ideas shared here are purely for educational and informational purposes only. They are not intended as investment advice or a recommendation to buy, sell, or hold any financial instruments. I am not a SEBI-registered financial adviser.
Trading and investing in the stock market involves risk, and you should do your own research and analysis. You are solely responsible for any decisions made based on this research.
"As HARD EARNED MONEY IS YOUR's, So DECISION SHOULD HAVE TO BE YOUR's".
Do comment if Helpful .
Do Comment for In depth Analysis.
❇️ Follow notification about periodical View
💥 Do Comment for Stock WEEKLY Level Analysis.🚀

XAUUSD (ONDA) IntraSwing Levels For 31/12/25-01st JAN'26(3.30 am ₹₹₹ 🏃🏽 🏃🏼♀️ 🏃🏽♂️
💥 Have a Pr💰fitable
New Year 2️⃣0️⃣2️⃣6️⃣🚀
💥Level Interpretation / description:
L#1: If the candle crossed & stays above the “Buy Gen”, it is treated / considered as Bullish bias.
L#2: Possibility / Probability of REVERSAL near RLB#1 & UBTgt
L#3: If the candle stays above “Sell Gen” but below “Buy Gen”, it is treated / considered as Sidewise. Aggressive Traders can take Long position near “Sell Gen” either retesting or crossed from Below & vice-versa i.e. can take Short position near “Buy Gen” either retesting or crossed downward from Above.
L#4: If the candle crossed & stays below the “Sell Gen”, it is treated / considered a Bearish bias.
L#5: Possibility / Probability of REVERSAL near RLS#1 & USTgt
HZB (Buy side) & HZS (Sell side) => Hurdle Zone,
*** Specialty of “HZB#1, HZB#2 HZS#1 & HZS#2” is Sidewise (behaviour in Nature)
Rest Plotted and Mentioned on Chart
Color code Used:
Green =. Positive bias.
Red =. Negative bias.
RED in Between Green means Trend Finder / Momentum Change
/ CYCLE Change and Vice Versa.
Notice One thing: HOW LEVELS are Working.
Use any Momentum Indicator / Oscillator or as you "USED to" to Take entry.
⚠️ DISCLAIMER:
The information, views, and ideas shared here are purely for educational and informational purposes only. They are not intended as investment advice or a recommendation to buy, sell, or hold any financial instruments. I am not a SEBI-registered financial adviser.
Trading and investing in the stock market involves risk, and you should do your own research and analysis. You are solely responsible for any decisions made based on this research.
"As HARD EARNED MONEY IS YOUR's, So DECISION SHOULD HAVE TO BE YOUR's".
Do comment if Helpful .
Do Comment for In depth Analysis.
❇️ Follow notification about periodical View

NIFTY Analysis for 1st JAN '26: IntraSwing Spot levels" 🏃🏽🏃🏼♀️🏃🏽♂️Have a Pr💰fitable New Year 2️⃣0️⃣2️⃣6️⃣ "
💥Level Interpretation / description:
L#1: If the candle crossed & stays above the “Buy Gen”, it is treated / considered as Bullish bias.
L#2: Possibility / Probability of REVERSAL near RLB#1 & UBTgt
L#3: If the candle stays above “Sell Gen” but below “Buy Gen”, it is treated / considered as Sidewise. Aggressive Traders can take Long position near “Sell Gen” either retesting or crossed from Below & vice-versa i.e. can take Short position near “Buy Gen” either retesting or crossed downward from Above.
L#4: If the candle crossed & stays below the “Sell Gen”, it is treated / considered a Bearish bias.
L#5: Possibility / Probability of REVERSAL near RLS#1 & USTgt
HZB (Buy side) & HZS (Sell side) => Hurdle Zone,
*** Specialty of “HZB#1, HZB#2 HZS#1 & HZS#2” is Sidewise (behaviour in Nature)
Rest Plotted and Mentioned on Chart
Color code Used:
Green =. Positive bias.
Red =. Negative bias.
RED in Between Green means Trend Finder / Momentum Change
/ CYCLE Change and Vice Versa.
Notice One thing: HOW LEVELS are Working.
Use any Momentum Indicator / Oscillator or as you "USED to" to Take entry.
⚠️ DISCLAIMER:
The information, views, and ideas shared here are purely for educational and informational purposes only. They are not intended as investment advice or a recommendation to buy, sell, or hold any financial instruments. I am not a SEBI-registered financial adviser.
Trading and investing in the stock market involves risk, and you should do your own research and analysis. You are solely responsible for any decisions made based on this research.
"As HARD EARNED MONEY IS YOUR's, So DECISION SHOULD HAVE TO BE YOUR's".
Do comment if Helpful .
Do Comment for In depth Analysis.
❇️ Follow notification about periodical View

GIFTNIFTY IntraSwing Levels For 31st Dec '25💥💥💥 Last Trading Day of 2025 Calender Year.
Hope you all enjoyed. 💥💥💥
💥Level Interpretation / description:
L#1: If the candle crossed & stays above the “Buy Gen”, it is treated / considered as Bullish bias.
L#2: Possibility / Probability of REVERSAL near RLB#1 & UBTgt
L#3: If the candle stays above “Sell Gen” but below “Buy Gen”, it is treated / considered as Sidewise. Aggressive Traders can take Long position near “Sell Gen” either retesting or crossed from Below & vice-versa i.e. can take Short position near “Buy Gen” either retesting or crossed downward from Above.
L#4: If the candle crossed & stays below the “Sell Gen”, it is treated / considered a Bearish bias.
L#5: Possibility / Probability of REVERSAL near RLS#1 & USTgt
HZB (Buy side) & HZS (Sell side) => Hurdle Zone,
*** Specialty of “HZB#1, HZB#2 HZS#1 & HZS#2” is Sidewise (behaviour in Nature)
Rest Plotted and Mentioned on Chart
Color code Used:
Green =. Positive bias.
Red =. Negative bias.
RED in Between Green means Trend Finder / Momentum Change
/ CYCLE Change and Vice Versa.
Notice One thing: HOW LEVELS are Working.
Use any Momentum Indicator / Oscillator or as you "USED to" to Take entry.
⚠️ DISCLAIMER:
The information, views, and ideas shared here are purely for educational and informational purposes only. They are not intended as investment advice or a recommendation to buy, sell, or hold any financial instruments. I am not a SEBI-registered financial adviser.
Trading and investing in the stock market involves risk, and you should do your own research and analysis. You are solely responsible for any decisions made based on this research.
"As HARD EARNED MONEY IS YOUR's, So DECISION SHOULD HAVE TO BE YOUR's".
Do comment if Helpful .
Do Comment for In depth Analysis.
❇️ Follow notification about periodical View

DowJones (DJI) IntraSwing Levels for 30th Dec - 31st Dec 2025DowJones (DJI) IntraSwing Levels for 30th Dec - 31st Dec 2025 (2:30 am)
💥Level Interpretation / description:
L#1: If the candle crossed & stays above the “Buy Gen”, it is treated / considered as Bullish bias.
L#2: Possibility / Probability of REVERSAL near RLB#1 & UBTgt
L#3: If the candle stays above “Sell Gen” but below “Buy Gen”, it is treated / considered as Sidewise. Aggressive Traders can take Long position near “Sell Gen” either retesting or crossed from Below & vice-versa i.e. can take Short position near “Buy Gen” either retesting or crossed downward from Above.
L#4: If the candle crossed & stays below the “Sell Gen”, it is treated / considered a Bearish bias.
L#5: Possibility / Probability of REVERSAL near RLS#1 & USTgt
HZB (Buy side) & HZS (Sell side) => Hurdle Zone,
*** Specialty of “HZB#1, HZB#2 HZS#1 & HZS#2” is Sidewise (behaviour in Nature)
Rest Plotted and Mentioned on Chart
Color code Used:
Green =. Positive bias.
Red =. Negative bias.
RED in Between Green means Trend Finder / Momentum Change
/ CYCLE Change and Vice Versa.
Notice One thing: HOW LEVELS are Working.
Use any Momentum Indicator / Oscillator or as you "USED to" to Take entry.
⚠️ DISCLAIMER:
The information, views, and ideas shared here are purely for educational and informational purposes only. They are not intended as investment advice or a recommendation to buy, sell, or hold any financial instruments. I am not a SEBI-registered financial adviser.
Trading and investing in the stock market involves risk, and you should do your own research and analysis. You are solely responsible for any decisions made based on this research.
"As HARD EARNED MONEY IS YOUR's, So DECISION SHOULD HAVE TO BE YOUR's".
Do comment if Helpful .
Do Comment for In depth Analysis.
❇️ Follow notification about periodical View

XAU/USD: Watch for SELL after strong drop rebound◆ Market Context (M30)
Gold has just experienced a strong displacement-type drop, breaking the previous upward structure. The current increase is only a technical pullback, not enough to confirm a trend reversal.
◆ Structure & Cash Flow (SMC)
• The previous peak created a Lower High, confirming the short-term structure has shifted to bearish.
• Price is retracing to the Fibonacci 0.5 – 0.618 zone, coinciding with the old supply/distribution zone.
• This is an area prone to SELL-side reaction if there is no clear breakout.
◆ Key Levels
• Sell Zone (Fibo 0.5 – 0.618): ~4,435 – 4,445
• Current Price: ~4,379
• Nearest Bottom (Liquidity): ~4,300
• Invalid SELL scenario: M30 closes above 4,445
◆ Trading Scenarios
➤ Scenario 1 – SELL pullback (priority)
• Wait for price to retrace to 4,435 – 4,445
• Appearance of rejection candle/small breakdown → watch for SELL
• Targets: 4,360 → 4,330 → 4,300
• SL: above 4,445
➤ Scenario 2 – Do not SELL if…
• If price breaks and holds above 4,445
→ Bearish scenario is invalidated, wait for a new structure to form.
◆ Summary
• Main bias: Bearish – sell on pullback.
• The current increase is just a technical rebound after a strong sell-off.
• Avoid BUY against the trend when there is no clear upward CHoCH.

Jaysawal Neco’s JourneyJaysawal Neco’s stock wandered in the wilderness for years, stuck in the shadows below ₹30. Investors almost forgot it existed. But then, around 2024, something changed. The stock woke up, broke its chains, and started climbing the mountain of opportunity.
First, it crossed the old barrier at ₹56 a level that had held it captive for years. Then, like a warrior gaining strength, it surged past ₹90, a powerful resistance that marked the beginning of a new era.
Now, the stock stands at ₹91, looking toward the distant peak at ₹145 the land of Fibonacci’s promise. The path ahead is not without danger. If it slips below ₹65, the dream could fade. But if it holds strong, the journey to ₹145 could make legends.
Entry Point: ₹90–92 (where the hero stands now)
Stop-Loss: ₹65 (the safety rope if the climb gets risky)
Target 1: ₹118 (first milestone)
Target 2: ₹145 (the summit)

Chumtrades XAUUSD Any pullback is an opportunity to buy higher.This morning’s move was a corrective sell-off, best understood as profit-taking from BUY-side, not a trend reversal.
The overall structure remains within a rising trend channel, with no sign of a structural break → BUY bias stays intact, looking to buy pullbacks in line with the trend.
🟢 Key Support Zones
447x: near-term support (4476 – 4472 – 4470)
4450 – 4455
4430 – 4435
🔴 Key Resistance Zones
4548 – 4550
4560 – 4565
4599 – 4600 (upper resistance)
📌 Additional Note
453x is a mid-zone to watch closely for price reaction.
📊 Intraday Expectation
Price is expected to range sideways on the H2 timeframe
Range high: 4549
Range low: 4473
→ Possible BUY near the lower boundary and SELL near the upper boundary if the range holds.
⚠️ Risk Management
No major news at the moment; price is mainly driven by technical flows.
Holiday period → thin liquidity, higher risk of stop hunts.
Keep stops reasonable and avoid overtrading.
Wishing everyone a productive trading day.

XAU/USD: Buy now as it accumulates below resistance!◆ Market Context (M30)
Gold prices are maintaining a short-term uptrend. After the previous BOS increase, the market is currently accumulating just below the Resistance area, indicating that buyers are still in control but need more liquidity before expanding the range.
◆ SMC & Price Action
• The current structure is still Higher High – Higher Low, with no bearish CHoCH.
• Prices are compressing just below the Resistance Zone ~4,518, indicating the possibility of sweeping liquidity in both directions before a breakout.
• Below exists Buy-side Liquidity + FVG, which is a good support area for the trend continuation scenario.
◆ Key Levels on the chart
• Resistance Zone: ~4,518
• Buy Liquidity: 4,501 – 4,492
• FVG Buy: ~4,465
• Invalid bullish structure: M30 closes below 4,465
◆ Trading Scenarios
➤ Scenario 1 – BUY pullback (priority)
• Wait for the price to retrace to 4,501 – 4,492 (Buy Liquidity)
• If there is a price holding reaction → continue to BUY according to the trend
• Targets: 4,518 → 4,540+
• SL: below 4,465
➤ Scenario 2 – BUY deep at FVG
• In case the price sweeps more strongly to ~4,465 (FVG Buy)
• This is the last defense area for buyers in the current structure
• Expect a rebound to the old peak area
➤ Scenario 3 – Break & Continue
• If the price breaks decisively above 4,518 and holds
• Watch for a retest to BUY according to the expanding wave
◆ Summary
• Main bias: Bullish.
• Strategy: Buy the dip, do not SELL without a bearish CHoCH.
• Important observation areas: 4,501 – 4,492 – 4,465.
• Break above 4,518 will open a new upward phase.

XAU/USD: Buy at FVG + Fibo, sell at Upper Liquidity◆ Market Context (M30)
Gold maintains an upward trend with previous BOS movements. After the push to the nearest peak, the price is undergoing a technical correction to rebalance liquidity before choosing the next direction.
◆ SMC & Price Action
• The current decline is a pullback, with no bearish CHoCH confirming a reversal.
• The retracement area coincides with FVG + Fibo (0.5–0.618) → potential BUY reaction zone.
• Above exists Liquidity $$$ (Sell) – a target to attract liquidity if the price surges.
◆ Key Levels
• FVG – Fibo BUY: 4,466 – 4,461
• Liquidity SELL: ~4,584
• Intermediate resistance: 4,524
• Invalid bullish: H1/M30 closes below 4,455
◆ Trading Scenarios
➤ Scenario A – BUY Pullback (priority)
• Wait for price to retrace to 4,466–4,461
• Condition: candle holds price, does not break structural low
• Targets: 4,524 → 4,584
• SL: below 4,455
➤ Scenario B – Break & Continue
• If price holds above the current area and continues to close bullish candles
• Follow the trend, take partial profits at 4,524
➤ Scenario C – SELL Reaction (short-term)
• When price hits Liquidity ~4,584
• Only SELL if a clear rejection appears (wick/engulfing)
◆ Summary
• Main bias: Bullish.
• Strategy: Buy the dip, avoid counter-trend SELL without CHoCH.
• Decision zone: 4,466–4,461 | Target: 4,524 → 4,584.

Bullish Trend Intact, Focus on Buy-the-Dip Market ContextGold continues to trade firmly within an ascending channel, maintaining its bullish momentum after the latest impulsive move. The market is currently in a technical pullback phase, which is considered healthy within an uptrend rather than a sign of reversal.
On the fundamental side, dovish Fed expectations and the outlook for lower interest rates keep pressure on the USD, providing ongoing support for gold. As long as this macro backdrop remains unchanged, downside moves are expected to stay corrective.
Technical Structure (H1)
Bullish market structure remains valid (Higher Highs & Higher Lows)
Price is holding above the ascending trendline
No confirmed bearish break of structure
Overall bias remains bullish continuation
Key Price Zones
Primary BUY Zone: 4,480 – 4,470
(Trendline support + demand zone + structure support)
Deeper Support: 4,444
Upside Targets / Resistance:
4,512 → 4,563
Trading Plan – MMF Style
Primary Scenario – Trend-Following BUY
If price pulls back into 4,480 – 4,470 and holds on H1
→ Look for BUY setups aligned with the main trend
This zone represents a high-probability area for smart money re-entry
Targets
TP1: 4,512
TP2: 4,563
Scale out near major resistance areas
Alternative Scenario
If price does not retrace deeply and holds above 4,500
→ Wait for a break & retest before considering continuation BUYs
Avoid chasing price near the upper resistance zone
Invalidation
A H1 close below 4,444 would weaken the short-term bullish structure and require reassessment.

AWHCL: Signs of Trend ReversalThe stock of AWHCL has shown signs of recovery after a prolonged downtrend that began in September. Recent price action suggests a potential shift in momentum, supported by multiple technical factors across daily and weekly timeframes.
The stock has bounced from a long-term support level marked on the chart. The recent retracement from the swing high and higher low aligns with the 61.8% Fibonacci level, a zone often considered significant for trend continuation, indicating strong bullish momentum.
A bullish MACD crossover occurred on the daily chart last week, and notably, a weekly MACD crossover has been confirmed today. This dual timeframe alignment strengthens the bullish outlook.
The RSI readings support the bullish scenario, reflecting improving momentum without entering extreme overbought territory.
On the daily chart, the stock has managed to close above the 200DEMA, a key indicator of long-term trend strength which also seen by volume growth.
Key Levels to Monitor:
Support Zone: Around ₹417 (critical level for trend validation)
Resistance Zone: Near ₹632, which coincides with the 1.618 Fibonacci extension level, often viewed as a potential target in bullish setups.
Disclaimer: This analysis is intended for educational and informational purposes only. It does not constitute investment advice or a recommendation to buy, sell, or hold any financial instrument. Market participants should conduct independent research and consult a licensed financial advisor before making any investment decisions.

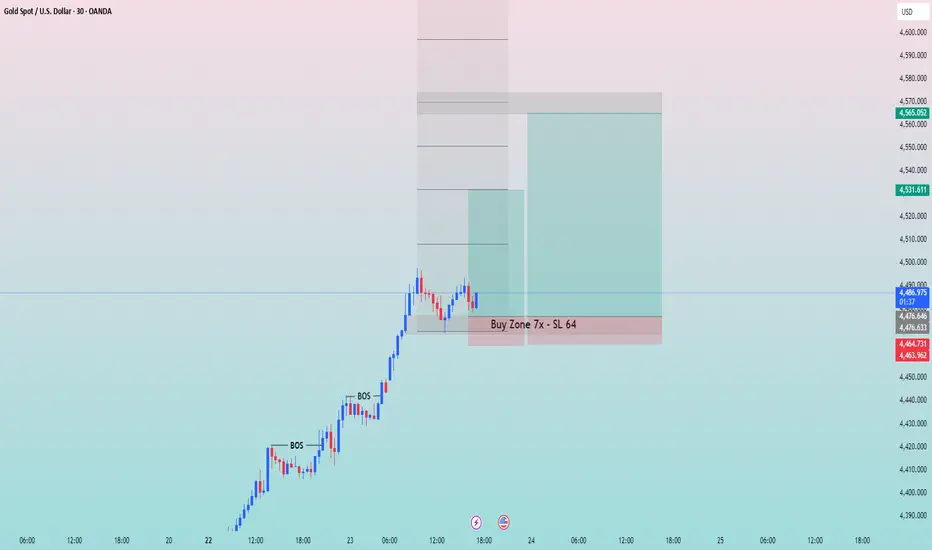
XAU/USD: Buy on pullback in strong upward trend!◆ Market Context (M30)
Gold is in a clear upward trend, demonstrated by a series of consecutive BOS and gradually higher lows/highs. After a strong push, the price is currently consolidating sideways in the premium area, indicating the market is pausing before choosing the next direction.
◆ SMC & Price Action
• The upward structure remains intact, with no bearish CHoCH appearing.
• The current adjustment area is the Buy Zone – where the price previously created a BOS.
• This sideways movement is rebalancing, often a precursor to the next upward move if support is not broken.
◆ Key Levels
• Buy Zone: 4,476 – 4,464
• Invalid upward: clear break below 4,464
• Upper targets:
▪ 4,531
▪ 4,565
◆ Trading Scenarios
➤ Scenario A – Pullback BUY (priority)
• Wait for a pullback or hold within Buy Zone 4,476 – 4,464
• Condition: candle holds price, does not break structural low
• Targets:
▪ 4,531
▪ 4,565
• SL: below 4,464
➤ Scenario B – Break & Continue
• If price holds above the current area and continues to close bullish candles
• Follow the trend, manage orders partially at target levels
➤ Scenario C – Defensive
• If 4,464 is clearly broken
• Short-term upward structure invalidated → stay out and wait for a new setup
◆ Summary
• Main trend: Strong bullish.
• Priority strategy: BUY with the trend, do not SELL against it.
• Decision area: 4,476 – 4,464.
• Next targets: 4,531 → 4,565.
XAU/USD – Strong Bullish Expansion, Focus on Pullback BuysMarket Context
Gold has delivered a strong bullish expansion after breaking out of the previous consolidation range. The impulsive move confirms aggressive buy-side participation, suggesting that the market is now in a trend-continuation phase rather than distribution.
From a macro perspective, expectations around a dovish Fed outlook and future rate cuts continue to weaken the USD, providing a supportive environment for gold. This keeps the broader bias tilted to the upside, with pullbacks viewed as opportunities to reload long positions.
Technical Structure (H1 – Short-Term)
Clear Bullish BOS confirmed after range breakout
Price is holding above prior resistance → flipped to support
Current price action shows rebalancing after impulse
No bearish structure break so far
Key Price Zones
Primary BUY Zone:
4,420 – 4,410
(previous resistance + demand + structure base)
Intermediate Support:
4,433 – 4,432
Upside Liquidity / Resistance:
4,466
4,500
4,540 – 4,550 (sell-side reaction zone)
Trading Plan – MMF Framework
Primary Scenario – Buy the Pullback
If price pulls back into 4,420 – 4,410, look for acceptance and bullish reaction
This zone is ideal for trend-following BUY setups
Expect continuation toward higher liquidity levels
Upside objectives:
TP1: 4,466
TP2: 4,500
TP3: 4,540 – 4,550 (possible reaction / partial profit area)
Alternative Scenario
If price does not retrace deeply and holds above 4,432, wait for a break & hold above 4,466, then look for continuation buys on shallow pullbacks
Avoid chasing price directly into the 4,540+ area
Invalidation
A confirmed H1 close below 4,405 would weaken the short-term bullish structure and suggest a deeper corrective phase.
Summary
Gold is in a strong bullish trend after a clean breakout.
Current moves are rebalancing, not reversal.
Bias remains BUY on pullbacks, targeting higher liquidity while respecting reaction zones above.

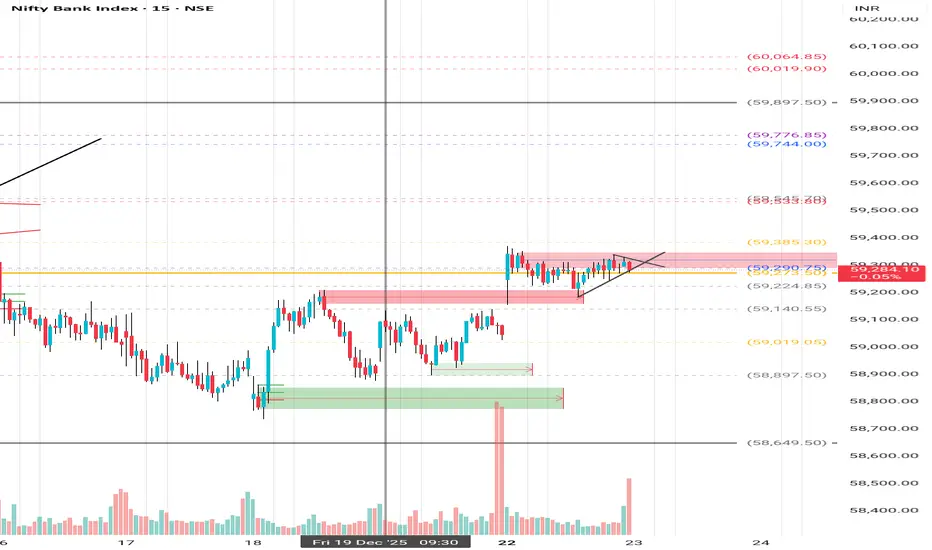
Bank Nifty - 23rd December Levels with TrendLines Bank Nifty – 23rd December Levels with Trendlines
Yesterday, only supply was created.
On Friday, that supply turned into demand.
If the market opens with a gap-up, then 23rd December supply will act as demand.
Check my Fibonacci levels – they are the most important for understanding the overall monthly direction.
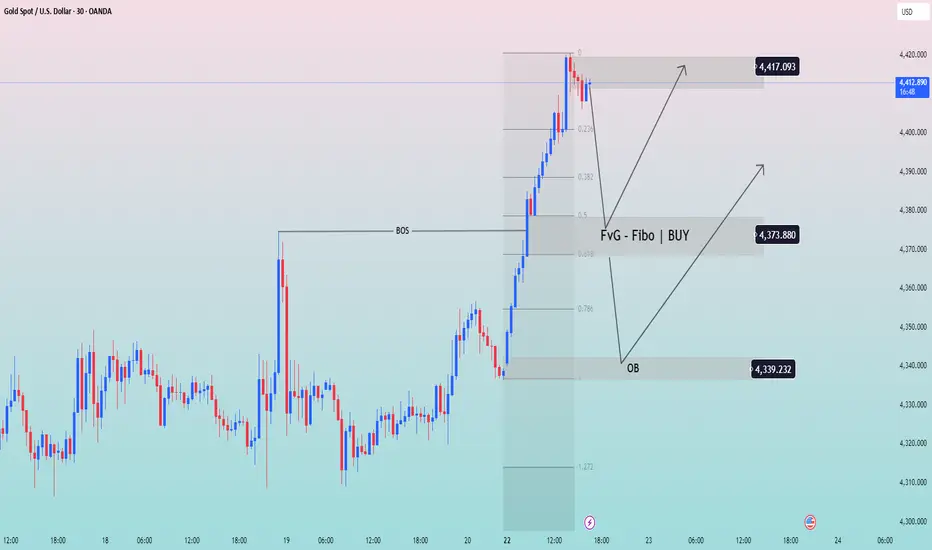
XAU/USD: Buy on BOS, FVG + Fibo retracement!◆ Market Context (M30)
Gold has just broken the rising BOS and created a strong push to the short-term peak area of 4,417. After the impulse, the market enters a pullback to rebalance—a common behavior before continuing the main trend.
◆ SMC & Price Action
• The rising structure remains valid (HH–HL).
• The FVG + Fibo zone (0.5–0.618) around 4,374 is the preferred area to look for buying pressure.
• The OB below ~4,339 is a deeper support area if the pullback extends.
• No bearish CHoCH yet → prioritize the bullish continuation scenario.
◆ Key Levels
• Nearest peak/resistance: 4,417
• FVG + Fibo (BUY zone): ~4,374
• Deep OB: ~4,339
• Invalid rise: clear break of 4,339
◆ Trading Scenarios
➤ Scenario A – Pullback BUY (priority)
• Wait for price to retrace to 4,374 (FVG + Fibo)
• Condition: rejection candle / maintain HL
• Targets:
▪ 4,397
▪ 4,417 (peak)
▪ extend if peak is broken
➤ Scenario B – Deeper Pullback
• If 4,374 is breached
• Monitor OB ~4,339 for buying reaction
• Only BUY with structural confirmation
➤ Scenario C – Break & Continue
• If price does not retrace deeply and holds above 4,397
• Follow the trend towards 4,417+
• Avoid FOMO at premium
◆ Summary
• Context: pullback in an uptrend.
• Decision zone: 4,374 → 4,339.
• Upper target: 4,417.
• Prioritize BUY according to structure, manage risk when price is at premium.
CHFJPY – Monthly Top Wick Expected This Week.Waiting for 2026CHFJPY is currently in a higher-timeframe bullish structure.
This week, price may form a top wick on the monthly candle, indicating short-term pause or consolidation.
From the second week of January, if volume supports the move, bullish continuation to the upside is expected.
This is a higher-timeframe bias and roadmap, not a lower-timeframe entry signal.
Waiting for confirmation before taking any position.
