Praj Ind (D): Aggressive Bullish Rev, Value Buy at Major SupportTimeframe: Daily | Scale: Linear
After a brutal 11-month downtrend, the stock has staged a violent "V-shaped" recovery from a 4-year historical support zone. This move is backed by the highest volume in months, signaling a potential trend change or a significant relief rally.
🚀 1. The "Why" (Catalyst for the 13%+ Surge)
The massive volume surge is likely driven by Value Buying and Short Covering :
- Historical Support: The stock hit ₹292 , a level not seen since mid-2022. Smart money often accumulates fundamentally sound companies at such multi-year structural supports.
- Oversold Conditions: After falling ~66%, the stock was deeply oversold. The removal of ethanol production caps for the 2025-26 supply year (fundamental tailwind) is finally being priced in.
📈 2. The Technical Structure
> The Floor (292-300): This is the "Line in the Sand." The stock tested this zone on Dec 9 and formed a base.
> The Ignition: The surge since yesterday (Dec 15) acts as an "Ignition Bar."
- Volume: 41.48 Million . This is not retail participation; this is institutional accumulation.
- Momentum: Rising ~14% in a short span confirms that the "bears are trapped."
📊 3. Indicators
- EMAs: The short-term EMAs (like 20-day) are yet to confirm a Positive Crossover because the move is so sharp. However, the price has decisively reclaimed the 20-day EMA , which is the first step.
- RSI: The rising RSI from oversold territory confirms momentum is shifting from bearish to bullish.
🎯 4. Future Scenarios & Key Levels
The primary challenge now is to sustain this vertical move.
> 🐂 Bullish Case (Continuation):
- Immediate Resistance: ₹369 . This is the previous breakdown level.
- Target: ₹427 . If ₹369 is cleared, the stock has an open path to ₹427 (which aligns with the 200-day EMA or major Fibonacci level).
> 🛡️ Support (The "Higher Low"):
- Immediate Support: ₹315 – ₹320 . In a healthy uptrend, the stock should not fall back to ₹292. Any pullback should ideally hold above ₹315 to form a "Higher Low" structure.
Conclusion
This is a classic "Dead Cat Bounce" turning into a Reversal . The volume confirms validity. The trade is now to buy on dips near ₹320 , targeting ₹369 and ₹427 . Avoid chasing the vertical rally; wait for a small cooling off.
Fibonacci

The railway stocks are okay for a reboundqThe Fib retracement might take the counters that have been is distress for a large part of last many years to go back to highs

USDJPY – Potential for a Volatile End to the WeekIt’s the last full trading week of the year before the Christmas break but that doesn’t necessarily mean that FX markets will be quiet. The calendar is still packed full of important risk events, and when combined with the possibility for decreasing levels of liquidity into Friday’s close it could be a recipe for volatility.
Take USDJPY for example. It has already been the biggest mover in the G7 currency space with its fall from opening levels at 155.80 on Monday down to a low of 154.68 so far this morning and the key risk events are still to come. These events take the form of US Non-farm Payrolls later today (1330 GMT), US CPI on Thursday (1330 GMT) and then the Bank of Japan interest rate decision (0300 GMT) and press conference (0630 GMT) on Friday.
Traders have been eagerly awaiting today’s latest US payrolls release which could impact the direction of the US Dollar in the short term. A weaker US labour market reading may increase the chances for a Federal Reserve interest rate cut in the first quarter of 2026, which could weigh on USDJPY prices, while a stronger number could see USDJPY strengthen.
Similarly, the direction of US inflation on Thursday could be important as some Fed policymakers have signalled they are uncomfortable with prices rising consistently above the US central bank’s 2% target. A higher-than-expected CPI reading could see US bond yields rise, taking USDJPY higher, while a weaker number could see USDJPY come under pressure as the focus shifts to the Bank of Japan rate decision on Friday morning.
At this meeting, the Japanese central bank is expected to raise interest rates by 25bps (around 90% probability), so anything else would be a shock that may lead to a nasty spike in USDJPY volatility. The comments of Governor Ueda in the press conference could also be important depending on what hints he gives about the potential for further rate hikes through 2026.
That’s it, and yes, I know, a lot to take in and prepare for! Looking at the charts, USDJPY has been in a 270-point trading range between 154.30-157.00 for the last month and there could be potential for that to change.
With that in mind, lets assess the technical outlook.
Technical Update: Are Further Corrective Themes Emerging?
The USDJPY rally from the 154.34 December 5th low to the 156.96 December 9th high was impressive, yet subsequent price action may be suggesting a slowing in upside momentum, even further price weakness.
A key concern for traders may be that the December 9th high remained well below the November 20th extreme at 157.89, reinforcing caution regarding near‑term price activity.
The risk is that this activity represents a ‘weak test’ of the 157.89 price high. In other words, while previous moves higher were accompanied by buying support strong enough to break and close above prior highs and resistance levels, this time the market has been unable to do so, raising concerns over the sustainability of upside momentum.
Traders may now question whether recent price activity signals a slowing of upside momentum and the potential for a phase of weakness. Much may depend on future sentiment once the outcome of the key risk events is known, making it prudent to remain aware of the key support and resistance levels as key reference points in the days ahead.
If Price Weakness is to Materialise:
It may still be argued that activity since the November 20th high reflects a phase of price consolidation within the longer‑term uptrend. Therefore, the focus may initially turn to the December 5th low at 154.34 as the first key support level.
Closing breaks below 154.34 could suggest a developing pattern of lower highs and lower lows, which is the basic definition of a downtrend. Should this occur, risks may then shift toward further price weakness with scope to test lower supports.
As the chart shows, closing breaks below support at 154.34 could see a deeper retracement of the October 1st to November 20th advance. If this is the case, the 38.2% level at 153.16 may be tested, with scope for extension towards the 50% retracement at 151.70.
If Support Holds and Price Strength Develops:
Of course, the 154.34 December 5th low support may yet hold and allow fresh price strength to develop. In that case, the focus may then turn to 156.01, the current level of the Bollinger mid‑average, as the first resistance. Closing breaks above 156.01 might now be required to open scope for higher levels
A confirmed break above 156.01 in USDJPY could trigger further upside pressure, with 156.96, the December 9th high, emerging as the next resistance. Should this level also give way, upside potential may extend toward 157.89, the November 20th high
The material provided here has not been prepared accordance with legal requirements designed to promote the independence of investment research and as such is considered to be a marketing communication. Whilst it is not subject to any prohibition on dealing ahead of the dissemination of investment research, we will not seek to take any advantage before providing it to our clients.
Pepperstone doesn’t represent that the material provided here is accurate, current or complete, and therefore shouldn’t be relied upon as such. The information, whether from a third party or not, isn’t to be considered as a recommendation; or an offer to buy or sell; or the solicitation of an offer to buy or sell any security, financial product or instrument; or to participate in any particular trading strategy. It does not take into account readers’ financial situation or investment objectives. We advise any readers of this content to seek their own advice. Without the approval of Pepperstone, reproduction or redistribution of this information isn’t permitted.

XAU/USD: Sell on Bearish OB, Buy Deep at Bullish OB1. Context & Price Structure (M30)
• The price is in a downward correction after a strong previous increase.
• On the retracement zone, EQH + ChoCH decrease appears → signal of weakening buying flow, prioritize "retracement to sell" in the short term.
• The price is still pressed under the descending trendline, so the short-term bias remains downward until a clear break occurs.
• Support Zone 4,275 is the decisive point: if held, it will rebound technically, if broken, it opens the path to the lower demand zone.
2. Key Levels (according to the chart drawn)
• OB Bearish (Sell Zone): 4,308 – 4,312 (≈ 4,311.888) → supply zone + trendline confluence, prioritize watching for SELL when retracing.
• Support Zone: 4,272 – 4,276 (≈ 4,275.451) → central support zone, can create a rebound/retracement.
• Mid Support / Target: 4,247.624 → next target if 4,275 is broken.
• OB Bullish (Buy Zone): 4,223.400 – 4,205.983 → strong demand zone, expected to sweep and reverse.
3. Trading Plan (with clear conditions)
Scenario 1 – SELL on retracement at Bearish OB (main scenario)
• If the price retraces to 4,308 – 4,312 and a rejection reaction appears:
strong pin bar
downward engulfing
or ChoCH decreases again on M15/M30
• Then prioritize SELL according to the correction trend.
• TP1: 4,275
• TP2: 4,247
• TP3: 4,223 (approaching OB Bullish)
• Invalidation: M30 closes above 4,318 and holds above → stop SELL idea.
Scenario 2 – BUY deep at Bullish OB (important scenario to catch a large retracement)
• If the price breaks 4,275 with a clear M30 candle and slides down to 4,223 – 4,206.
• Wait for Liquidity Sweep + reversal signal:
pin bar at OB
upward engulfing
or ChoCH increases (M15/M30)
• When confirmed, prioritize BUY.
• TP1: 4,247
• TP2: 4,275
• TP3: 4,308
• Invalidation: M30 closes below 4,198 → stay out and observe.
4. Risk Management Notes
• Do not chase SELL when the price is close to 4,275 (support zone).
• Do not BUY early before the price hits Bullish OB and confirmation is received.
• If the price reclaims strongly above the trendline + 4,312, the bias will shift to "BUY pullback" instead of "Sell retracement."

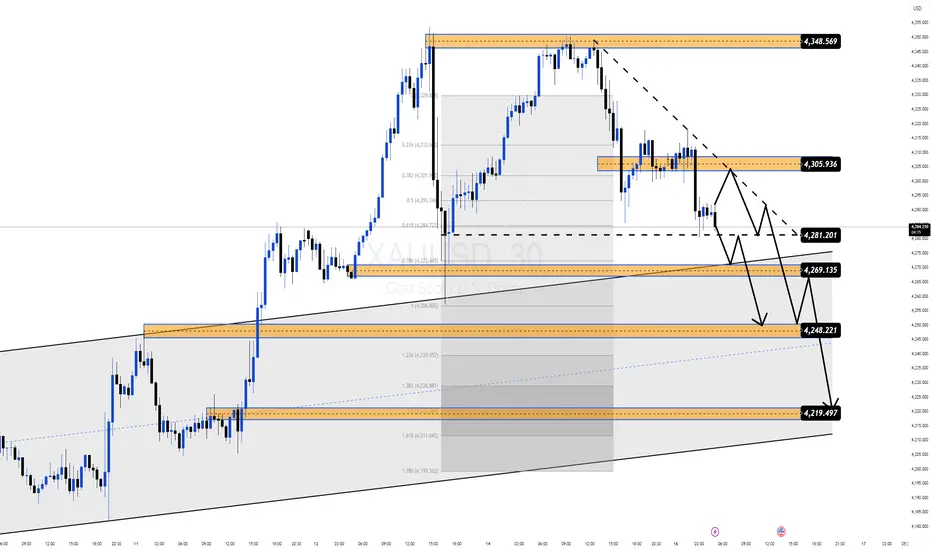
XAU/USD – Distribution at the Top, Sell on Rallies Market ContexAfter a strong bullish impulse, Gold is now showing clear signs of exhaustion near the upper liquidity zone. Price failed to sustain above the recent high and has started to rotate lower, suggesting a distribution phase rather than continuation.
From a macro perspective, although expectations around Fed policy remain mixed, short-term positioning looks crowded on the buy side, increasing the probability of a corrective move to rebalance liquidity.
Technical Structure (M30–H1)
Price rejected sharply from the 4,348 supply / liquidity zone
A lower high has formed under descending trendline resistance
Market is trading below key intraday structure, signaling bearish pressure
Current price action favors a sell-the-rally approach
Trading Plan – MMF Style
Primary Scenario – SELL Continuation
Preferred SELL zone: 4,300 – 4,306
Confirmation: bearish rejection / weak bullish momentum
Targets:
TP1: 4,281
TP2: 4,269
TP3: 4,248
Extended target: 4,219 (major demand + channel support)
Invalidation
A clean break and hold above 4,348 would invalidate the short-term bearish bias.
In that case, stand aside and wait for new structure confirmation.
MMF Perspective
At premium levels, risk favors patience over chasing buys.
The focus now is on capital protection and selling rallies, waiting for price to reach deeper demand zones before considering any new bullish setups.
Bias today: Bearish below 4,348 – Sell rallies, manage risk strictly.
BTC Weekly Downtrend
BTC has moving in a downtrend trend on weekly chartand soon moving to the 50% retracement level at 70.8k
further down is 58.4 - 48k zone
its a high probablility zone for a weekly bullish reversal to take place as it will the long consolidation of buyers.

Positional or Long Term Opportunity in NLC IndiaGo Long @ 244.9 for Targets of 288.1 and 298.9 with SL 234.1
Reasons to go Long :
1. On Weekly timeframe If we draw Fibonacci retracement from the recent swing low (A) to the swing high (B) then the stock took support from the 0.5 Fibonacci level.
2. In addition to this, the stock formed a Bullish Hammer Pattern (marked with a orange color) around 0.5 Fibonacci level.
3. Also the stock gave a Trendline breakout (marked with a red color).
4. Also there is a strong Trendline (marked with green color) which supports the stock.

Waiting for OB Reaction to Confirm the Next Move◆ Market Context (M30)
Price swept sell-side liquidity around 4,349–4,350 but failed to hold, indicating weakening buying pressure in premium. With a prior liquidity sweep at the lows and a bullish BOS, the current move is likely a rebalancing phase after liquidity absorption.
◆ SMC & Price Action
• Rejection after the upper sweep signals premium denial.
• The lower support zone marks the base of the prior bullish displacement (BOS base).
• OB + Fibo below act as an attraction zone for re-accumulation before direction is chosen.
◆ Key Levels
• Liquidity Sell: 4,349–4,350
• OB + Fibo (retest): 4,302–4,289
• Deeper support: 4,274
• Upper supply (if broken): 4,406
◆ Trading Scenarios
➤ Scenario A – Pullback BUY (Primary)
• Wait for a pullback into OB + Fibo 4,302–4,289
• Conditions: structure holds (no break of recent lows), bullish reaction
• Targets:
▪ 4,349
▪ Extension: 4,406
• Invalid if a clear break below 4,274
➤ Scenario B – Deeper Pullback
• If OB 4,302–4,289 is pierced
• Watch for reversal signals around 4,274
➤ Scenario C – Break & Continue (No FOMO)
• Only follow buys if price closes and holds above 4,350
• Monitor reactions at 4,406 for risk management/partials
◆ Summary
• Context: upper liquidity swept → favor pullbacks.
• Decision zone: OB + Fibo 4,302–4,289.
• Upside targets: 4,349 → 4,406.
• Avoid chasing price in premium.

Waiting for FVG / Liquidity Pullback, Trend-Following BUY Bias1. Market Context & Structure (H1)
• Gold has completed a liquidity sweep followed by a bullish BOS, confirming that the short-term uptrend remains intact.
• After the strong impulse, price is now entering a rebalancing / technical pullback phase rather than a reversal.
• The overall structure remains Higher High – Higher Low, favoring BUY strategies aligned with the dominant trend.
2. Key Technical Zones on the Chart
• Resistance / Supply Zone 1: 4,359 – 4,360
→ A previously strong reaction zone, where short-term corrections may occur.
• Resistance / Supply Zone 2: 4,394
→ Fibonacci 0.786 extension area, prone to profit-taking or upper liquidity sweeps.
• iFVG – Pullback Zone: 4,297 – 4,300
→ Inefficiency left during the bullish impulse, prioritized for the first BUY reaction.
• Liquidity Buy Zone: 4,267
→ Resting liquidity below, where a deeper sweep may occur before trend continuation.
3. Trading Scenarios – Captain Vincent Style
🔹 Primary Scenario – BUY at iFVG / Liquidity Buy (Preferred)
• Expect price to pull back from the 4,35x area toward 4,297 – 4,300 (iFVG) or deeper into 4,267 (Liquidity Buy).
• At the BUY zone, wait for confirmation signals:
– Strong rejection wicks
– Bullish engulfing
– Bullish ChoCH on M15–H1
• Preferred BUY Zones:
– BUY 1: 4,297 – 4,300
– BUY 2 (deeper): 4,267
• Targets:
– TP1: 4,359
– TP2: 4,394
– TP3 extension: continuation if 4,394 is broken.
• Invalidation:
– H1 close below 4,255 → short-term bullish structure weakens.
🔹 Secondary Scenario – Short-Term SELL Reaction at Supply
• If price rallies directly into 4,359 – 4,394 without a clear pullback, a short-term SELL reaction may appear.
• SELLs are scalp / counter-trend only, not the primary scenario.
• SELL target: pullback toward iFVG 4,297.
4. Risk & Management Notes
• Avoid FOMO BUY at high resistance zones.
• Prioritize BUY entries at discounted areas (FVG – Liquidity).
• Main bias remains BUY on pullbacks; SELLs are only technical reactions.
• Adjust position sizing carefully as the market is in an expansion phase.

XAU/USD – Bullish Trend Confirmed, Buy on PullbacksMarket Context
Gold remains firmly bullish, continuing to trade within a well-defined ascending channel. After a strong impulsive rally, the market is now entering a technical pullback phase to rebalance liquidity, which is a healthy behavior in a trending market rather than a sign of reversal.
From a macro perspective, dovish Fed expectations and the outlook for lower interest rates continue to support Gold. This keeps downside moves corrective in nature and favors trend-following BUY strategies.
Technical Structure (H1)
• Bullish structure remains intact with Higher Highs and Higher Lows
• Price is reacting at key confluence zones (trendline support + demand + Fibonacci)
• No confirmed bearish structure break at this stage
Trading Plan – MMF Style
Primary Scenario – Trend-Following BUY
• Preferred BUY zone: 4,296 – 4,292
• Stop Loss: below 4,286
Targets:
TP1: 4,327
TP2: 4,348
TP3: Extension if bullish momentum continues
→ Strategy: wait for pullbacks into key demand zones. No FOMO chasing at highs.
Alternative Scenario
• If price breaks and closes clearly below 4,241, short-term bullish structure weakens
• Stand aside and wait for a new structure confirmation
MMF Perspective
In a bullish market, the goal is not to predict the top, but to buy pullbacks at high-probability zones with favorable risk–reward.
As long as price holds above key supports, the primary bias remains BUY.

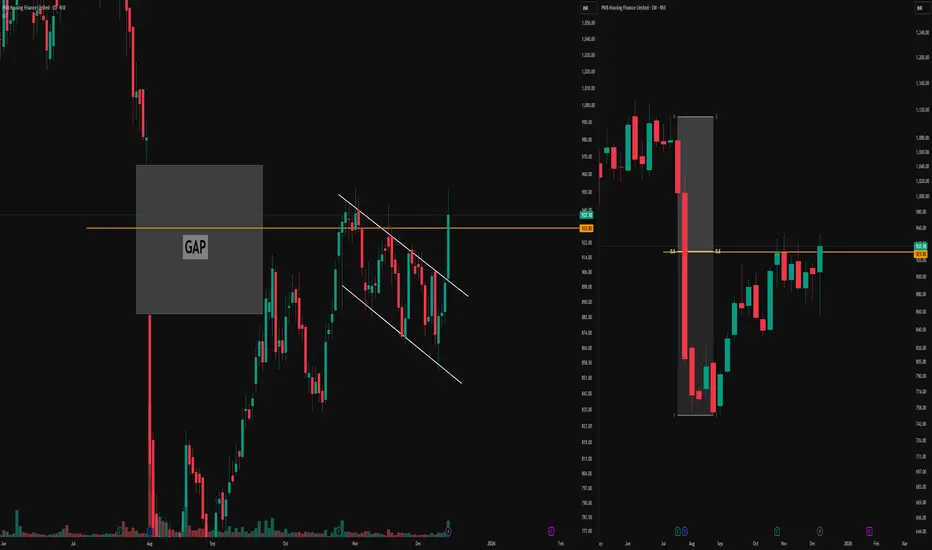
Parallel Channel, Stubborn Gap & 0.5 Equilibrium RejectionDaily Timeframe Details
The left chart on the daily timeframe displays a parallel channel structure forming after an initial one-sided move.
A significant gap emerged within this leg, which price has approached multiple times—first entering the gap area from below but rejecting sharply to form a higher low, then pushing toward a higher high without fully filling it.
This illustrates how gaps often resist easy fills from either direction, acting as persistent reference zones that demand confluence for interaction.
Weekly Timeframe Context
The right chart provides the weekly timeframe for the same instrument, highlighting repeated rejections at the 0.5 equilibrium level.
These weekly rejections align precisely with the daily gap interactions and channel boundaries, demonstrating how higher-timeframe equilibrium can underpin lower-timeframe price behavior without implying direction.
Such multi-timeframe alignment offers educational insight into structural references in market analysis.
This post serves purely educational and observational purposes and does not constitute buy, sell, or investment advice. Always conduct your own research.
HAPPSTMNDS - Weekly AnalysisIn the Weekly Chart of HAPPSTMNDS ,
we can see that, it has created a consolidation below the last FIBO support.
Enter on 506 with 487 as SL.

Bullish BOS Breakout, Watching Reaction at OB & Sell-Side Liquid◆ Market Context (H2)
Price has just broken a bullish BOS and closed above the previous equilibrium zone, confirming buyers are in control. After the strong impulse, the market has entered a rebalancing phase, where a short-term pullback often appears before continuation or a liquidity sweep to the upside.
◆ SMC & Price Action
• Bullish structure confirmed by consecutive BOS following the prior CHoCH.
• The 4,274 OB is the nearest demand zone where buyers previously reacted.
• Above lies sell-side liquidity at 4,355, with a further extension toward 4,408 — a potential distribution or short-term reversal zone.
• Price is currently in premium, so patience is preferred over FOMO entries.
◆ Key Levels
• Resistance / Liquidity: 4,355 → 4,408
• Support OB: 4,274
• Deeper OB: 4,217
◆ Trading Scenarios
➤ Scenario A – Pullback BUY (Primary)
• Wait for a pullback into OB 4,274
• Conditions: structure holds (no break of recent lows), bullish reaction appears
• Targets:
▪ 4,319
▪ 4,355 (Liquidity Sell)
▪ Extension: 4,408
➤ Scenario B – Break & Continue
• If price holds above 4,319 with bullish closes
• Monitor reactions at 4,355 for partial profit-taking
• Avoid chasing price in premium zones
➤ Scenario C – Deeper Pullback
• If OB 4,274 is clearly broken
• Price may retrace to OB 4,217 for re-accumulation
• Only consider BUY after a fresh bullish CHoCH
◆ Summary
• Primary trend: Bullish (BOS confirmed)
• Priority: Buy pullbacks, avoid FOMO
• Key decision zone: OB 4,274
• Upside liquidity targets: 4,355 → 4,408

Hindalco: Terminal Wedge, Reversal Risk HighStructural Context
Initially, I considered the decline from 864 toward 770 as a standard ABC correction. But the drop from Wave 2 was far too sharp and drove RSI into deep oversold territory — behaviour that aligns better with impulsive price action.
Because of this, the move is treated as a developing 1-2-3 rather than a corrective ABC.
This adjustment also aligns perfectly with the broader structure: a completed Wave 3 at 770.15, followed by a three-wave recovery into Wave 4.
Wave 4 Completion – Ending Diagonal + Fibonacci Symmetry
Wave C of the larger Wave 4(ABC Flat) shows a clean ending-diagonal wedge, and Wave (v) within it reached the 1.618 extension of Wave (i) measured from Wave (iv).
This Fibonacci precision adds strong weight to the interpretation that Wave 4 has completed at 833.50.
With this level established, the minor bounce into Wave (ii) now acts as the corrective pullback before the expected third wave down.
Invalidation remains at the 1.618 level around 833.50 — any move above that would negate the immediate bearish view.
Path Ahead – Toward Wave 5
As long as 833.50 holds, the expectation is for a five-wave decline toward the previous structural support near 770.15, completing Wave 5.
Wave (iii) should ideally accelerate, and momentum confirmation will be key as price moves into the mid-780s.
Disclaimer
This analysis is for educational purposes only and does not constitute investment advice. Please do your own research (DYOR) before making any trading decisions.

Waiting for Premium Pullback, Buy the Bullish Continuation1. Market Context & Structure (H1)
• After a prolonged consolidation phase, Gold has delivered a clear bullish BOS, breaking above the previous highs around 4,24x–4,25x.
• The current impulse originated from the EQL → OB 4,209 zone, confirming active buying flow and a shift into a short-term uptrend.
• Price is now trading above the Premium Zone at 4,265; any pullback into this area is considered a technical retracement within the bullish trend.
2. Key Technical Zones
• Main OB – Demand: around 4,209 → Origin of the current bullish leg; a strong BUY zone if price holds.
• Premium Pullback Buy Zone: 4,265 – 4,270 → First discount after BOS; priority area to look for BUY setups.
• Target 1 – Reaction Zone: 4,322 – 4,323 → Fibo 0.5–0.618 confluence; potential profit-taking / short-term sell reaction.
• Target 2 – Extension Zone: 4,366 – 4,367 (Fibo 1.272) → Bullish extension target and potential liquidity sweep zone.
3. Trading Scenarios
Main Scenario – Trend BUY at Premium Zone
• Wait for pullback to 4,265 – 4,270.
• Look for confirmation: long lower wicks, bullish engulfing, or bullish ChoCH on M15–H1.
• Execute BUY with trend continuation.
TP1: 4,322
TP2: 4,366
• Partial TP at TP1, move SL to BE, hold remainder to TP2.
• Invalidation: H1 close below 4,258 → pause BUY scenario.
Scenario 2 – Deep BUY at OB 4,209
• If price breaks Premium decisively and drops to OB 4,209, do not catch a falling knife.
• Wait for strong bullish reaction and reversal structure (new HL, bullish ChoCH).
TP: 4,265 → 4,322
4. Risk Management Notes
• Avoid FOMO BUY at highs after strong bullish candles.
• SELL setups are only short-term reactions, not the main bias.
• Bias remains BUY on dips as long as H1 holds above 4,209.

XAUUSD Bullish Confirmation Buy the PullbackGold has delivered a clear bullish structure break and is currently holding firmly inside an ascending trend channel. The recent impulsive move confirms strong participation from smart money, while the current price action reflects a healthy pullback–continuation phase, not a reversal.
From a fundamental perspective, dovish Fed expectations and a lower-rate outlook continue to support Gold. This keeps downside moves corrective in nature and favors trend-following BUY setups.
📊 Market Structure & MMF Flow (H1)
• Bullish structure is confirmed with Higher Highs and Higher Lows.
• Price is retracing toward demand zones to rebalance liquidity before the next expansion.
• No bearish structure break has appeared so far.
💎 Key Levels – MMF Style
• Primary Buy Zone: 4,268
• Deep Buy Zone: 4,238 – 4,219
• Upside Targets: TP1 4,305 → TP2 4,324
🎯 Trading Scenarios
Primary Scenario – Trend BUY
Alternative Scenario – Continuation above 4,305
🧭 MMF Intraday Bias
Bullish above 4,238
Invalidation below 4,219

Market Accumulating Liquidity, Two Clear Scenarios for TodayGold continues to move within a bullish structure, but short-term order flow shows distribution inside the OBS Sell Zone 4,236. Price is currently trapped in the middle of the range, suggesting the market may need a liquidity sweep before choosing its next direction.
Fundamentally, expectations of a dovish Fed still support gold on deeper pullbacks — but intraday, the two MMF flow setups are extremely clear.
📊 Technical Outlook (MMF Flow – H1)
🔸 OBS SELL ZONE: 4,236
• Strong reaction on first touch → supply confirmed
• Downtrend line converges here → high probability of liquidity traps
🔸 OBS BUY ZONE: 4,197
• First key demand zone below
• Aligned with channel support → likely bullish reaction
🔸 Sell-side Liquidity: 4,181
• If price sweeps this area → ideal reversal point
🔸 Premium SELL Reaction Zone: 4,284
• If gold expands upward → priority area for distribution / short-term correction
🎯 Two Main MMF Scenarios
Scenario 1 – SELL reaction → BUY trend continuation
• Price retests 4,236
• Bearish reaction → pushes price toward 4,197 – 4,181
• Reversal signal appears
• Targets: 4,236 → 4,284
➡️ This is the cleanest play following today’s liquidity flow.
Scenario 2 – Direct bullish expansion
• Price breaks and closes above 4,236
• Retests this zone
• Expands toward 4,284
➡️ Requires strong bullish momentum — no confirmation, no trade.
🧭 MMF Intraday Bias
• Bullish as long as price holds above 4,197
• Neutral → Bearish only if price closes below 4,181 (failed liquidity sweep)
The market is preparing for a breakout — let liquidity do its job before choosing direction.

ChumTrades XAUUSD intraday outlookXAUUSD – Intraday Plan (M15)
Market Context
Price is currently ranging in a very tight consolidation.
Momentum is weak → market favors intraday range trading rather than chasing breakouts.
Short-term structure remains intact; focus on price reaction at key levels.
Daily Strategy
Main approach: trade the range, trade the reaction.
Buy at predefined support / Fibonacci zones, sell at clear resistance.
If a breakout occurs, wait for a retest before following the move.
Avoid entries in the middle of the range.
Key Buy Zones
4246 – 4244 (Fibo 0.5)
4236 – 4233 (Fibo 0.618)
4210 – 4208 (deep support reaction)
❌ Bullish structure invalidation:
M15 close below 4200
Key Sell Zones
4300 – 4305 (psychological resistance)
4310 (Fibonacci extension – reaction sell)
Special Notes (Friday)
No major economic news today, but it is Friday – end of week.
Price action may become choppy and unpredictable, especially during the US session (a pattern seen in recent weeks).
Risk management is key:
Focus on short-term trades
Take profits early
Avoid holding positions over the weekend
Good luck Bro !

XAU/USD : Buy at OB 4,19x – 4,18x, Targets 4,24x → 4,26x 1. Market Structure (H1)
Gold is retracing back into bullish structure after breaking a series of bullish ChoCH and BoS, forming a new high around 4,24x. The current decline is only a technical pullback because:
• Price is returning to the Buy Order Block at 4,188 – 4,196.
• This zone aligns with trendline support and the demand base that fueled the previous impulse.
• The macro structure remains bullish as long as H1 does not close below 4,188.
→ This is a clear pullback–continuation setup: wait for price to retrace into discount, then target higher zones.
2. Key Levels
🔹 Demand Zone (Buy Zone): 4,188 – 4,196
• Bullish OB
• Trendline support
• Priority BUY area
🔹 Resistance 1: 4,217 – 4,218
• Multiple rejections
• Breakout → next bullish leg
🔹 Resistance 2: 4,238 – 4,239
• 0.5–0.618 Fibo confluence
• Possible mild sell reaction
🔹 Liquidity & Targets:
• 4,259 → Fibo 1.272
• 4,278 → Fibo 1.618 + resting liquidity
3. Trading Plan
🔸 Main Scenario – BUY at OB 4,19x – 4,18x
Conditions:
• Price taps 4,188 – 4,196
• Reversal signals: pin bar, engulfing, or bullish ChoCH
Targets:
TP1: 4,217
TP2: 4,238
TP3: 4,259
TP4: 4,278
Invalidation:
• H1 close below 4,185 → stay out.
🔸 Alternate Scenario – Price goes up without retesting OB
If price holds above 4,210 and breaks 4,217:
• Wait for retest of 4,217
• BUY continuation toward 4,238 → 4,259 → 4,278
Market Outlook
Gold is accumulating and building a base for a stronger breakout. The OB Buy zone 4,19x – 4,18x remains the highest-probability reversal area.

XAU/USD: Buy at OB 4.18x–4.17x; Sell on reaction.✍️ Captain Vincent – SMC Flow Analysis
📊 Market Structure (H1)
Gold continues to accumulate within the range of 4,200–4,220 after failing to break the recent peak. The structure shows:
• Multiple ChoCH – BoS declines → selling pressure still leads in the short term.
• However, the OB Buy 4,184–4,170 zone remains a crucial structural bottom, where buyers react strongly once swept.
• Above, the market leaves a Liquidity Sell area at 4,261, a natural target if gold gathers enough liquidity below.
→ The current phase is liquidity gathering before making a big move.
💎 Key Levels – Price Zones to Watch
🔸 Resistance / Sell Zone
• 4,218 → intraday resistance, price reacts multiple times.
• 4,243–4,244 → confluence of sideways peak + old BoS.
• Liquidity Sell: 4,261 → extended target if price breaks strongly upwards.
🔸 Support / Buy Zone
• 4,200–4,201 → short-term price balance zone.
• OB Buy 4,184–4,170 → strong demand, where the previous trend initiated.
• If breaking 4,170 → price may sweep deeper but remains in the ideal discount zone for BUY hunting.
🎯 Trading Plan – Clear and Easy to Follow
1️⃣ Main Scenario – Prioritize BUY at OB 4,184–4,170
Expect the market to create a sweep below 4,200, touching OB Buy to gather liquidity before bouncing up.
BUY Conditions:
• Price touches 4,184–4,170
• Reversal signals appear on M15–H1: pin bar, engulfing, rising ChoCH
• Decline slows down or buying force becomes clear
Targets:
• TP1: 4,190
• TP2: 4,200
• TP3: 4,215
• TP4 extended: 4,261 (Liquidity Sell)
Invalidation: H1 closes below 4,165 → stay out and reassess the structure.
2️⃣ Secondary Scenario – Short SELL when price retests 4.24x
If the price does not drop immediately but pulls up:
SELL Conditions:
• Retest 4,243–4,244
• Strong reaction appears: rejection wick, declining ChoCH
• Must not close H1 above 4,250
Targets:
• TP1: 4,235
• TP2: 4,225
• TP3: OB Buy 4,184–4,170
Invalidation: H1 closes above 4,250 → stop SELL, shift bias to observe breakout.
3️⃣ Extended Scenario – Sweep peak 4,261
Only activate when:
• Price bounces strongly from OB Buy
• Clear breakout of 4,243 zone
• Structure forms HL → HH
At that point, gold will tend to run straight up to sweep liquidity at 4,261 before the market chooses a new direction.
⚠️ Risk Management Notes
• Do not BUY when price is still within the resistance zone 4,218–4,243.
• SELL is only a short-term strategy, do not go against the major trend if a breakout occurs.
• OB Buy 4,184–4,170 is the zone with the highest probability of triggering an upward wave.

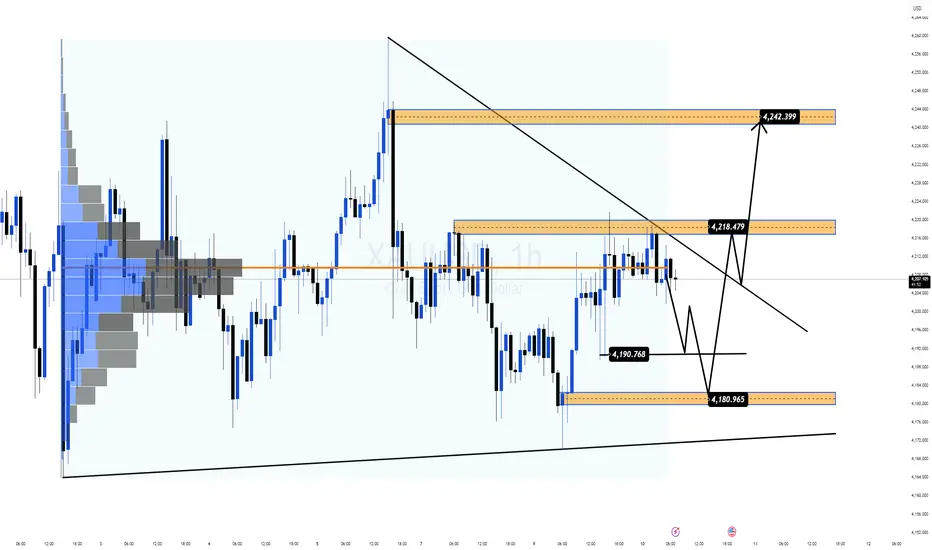
Price Compressing Below Trendline, Waiting for a Liquidity SweepGold continues to consolidate inside a narrow range as markets wait for fresh USD flows and upcoming Fed expectations. Sellers are losing momentum, but buyers still haven’t secured a clean breakout as price remains capped beneath the short-term descending trendline.
Current structure suggests a classic “liquidity sweep → bullish reversal” setup, with clear liquidity buildup sitting underneath the market.
📊 MMF Technical Outlook (H1)
1️⃣ Price reacting around a previous POC zone (Volume Profile)
Heavy traded area → easy for fake moves
No clean breakout above 4,218 yet
2️⃣ Key Levels – Main Setup Favors “Dip-Buy”
Important zones:
4,218 – 4,220 → Minor supply + descending trendline; breakout needed for bullish continuation
4,190 – 4,181 → Liquidity sweep zone (ideal buy area)
4,242 → Main upside target if breakout confirms
Structure shows price may dip lower first to clear liquidity before reversing upward.
🎯 MMF Daily Plan – BUY After Liquidity Sweep
▶️ Primary Scenario (High-Probability)
Wait for price to sweep liquidity into 4,190 → 4,181.
🔹 BUY Zone: 4,190 – 4,181
🔹 SL: below 4,172
🔹 TP1: 4,218
🔹 TP2: 4,242
Why this works:
Confluence: liquidity pocket + fib retracement + structural demand
MMF Flow suggests a clearing phase before bullish expansion
▶️ Secondary Scenario (Break & Retest)
If price breaks strongly above 4,218, wait for a clean retest to join the trend.
🔹 Entry: 4,218 – 4,220
🔹 TP: 4,242
🧭 MMF Bias Today
Bias: Neutral → Bullish as long as 4,180 holds
Avoid FOMO buys into 4,218 resistance
Only engage after a sweep or a clear BOS + retest
Gold Hits Buy Zone – Wait! Here's What to Confirm…◆ Market Context
On the M30 chart, the market shows a shift from a downtrend to a short-term recovery phase after forming BOS and CHoCH at the nearest bottoms. However, the upward movement has hit a prolonged downtrend line and reacted sharply downward again. This indicates that the trendline and upper resistance zone still maintain significant selling pressure.
◆ SMC & Price Action
• After breaking the upward BOS, the price made a strong push to 4,219 but couldn't sustain it, forming a downward reaction at the trendline and resistance zone.
• The Resistance Zone 4,211 – 4,219 has been confirmed by multiple price rejections.
• Currently, the market is adjusting to the Buy Support – Fibo – iFvG zone around 4,192. This is the first short-term support zone to test the buying momentum.
• If this zone doesn't hold, the price may return to the deeper liquidity zone 4,173 – where a large number of buyers' stop-losses are concentrated.
◆ Important Price Zones
Resistance (selling zone):
• 4,211
• 4,219
Short-term support:
• 4,192 (Fibo + iFvG + small OB)
Deeper support – Liquidity Pool:
• 4,173 (target zone if 4,192 support is broken)
◆ Main Trading Scenarios
➤ Scenario 1: Price holds at 4,192
• Wait for reversal signals at the support zone
• Recovery targets:
▪ 4,211
▪ 4,219
• If 4,219 is broken → the price may extend to a higher zone, but there is currently no confirmation signal for this.
➤ Scenario 2: Price breaks 4,192 support
• Short-term upward structure invalidated
• Prioritize following the downtrend
• Next targets:
▪ 4,173
▪ monitor liquidity reactions in this area to identify subsequent buying opportunities
➤ Scenario 3: Retrace to resistance for further selling
If the price retraces to 4,211 – 4,219 but doesn't break:
• Monitor rejection patterns
• This is a suitable zone to continue the downward movement following the main flow
◆ Summary
• The main trend still leans towards a decline, with the downtrend line in control.
• The 4,192 zone is a crucial reaction point to determine if buyers still have enough strength.
• If 4,192 is lost, the market is likely to seek liquidity at 4,173.
• If 4,192 holds, the price may recover to 4,211 – 4,219 before determining the next direction.

Chumtrades XAUUSD Outlook – Will Gold Continue Sideways Today?🎯 XAUUSD – Sideway Day Before FOMC
1️⃣ Market Context
H4 is clearly moving sideways: small candle bodies – long upper and lower wicks, indicating hesitation before FOMC (occurring the night of the 11th into the morning of the 12th).
The price is currently locked in the H4 range:
Lower boundary: 4176–4180
Upper boundary: 4215–4218
Today I am observing the price moving sideways within this range.
2️⃣ Intraday Trading Strategy
🟢 BUY low – priority
Watch for reactions at the zones:
4180 – 4182
4174 – 4178 (bottom of H4 range)
4155 – 415X (most attractive BUY zone)
→ Short target: 4200 – 4210
→ SL below support zone by 100 pips
🔻 SELL high – priority
Watch for reactions at:
4212 – 4218 (top of H4 range)
4230 – 4233 (strong resistance – most attractive sell zone)
→ Target: return to mid-range 4190 → bottom of range 417X
→ SL above resistance zone by 100 pips
The nearest zone is 4202-4198, this entry can be considered
3️⃣ Expected Movement
Today → Sideways within H4 box 4176 ⇆ 4212.
Just trade according to the range: buy low – sell high.
Expected daily fluctuation range is 50-55 prices.
A true breakout may occur tomorrow or the day after, as the market prepares for this week's FOMC.
📌 Note
Prioritize candle reactions at price zones.
Avoid FOMO in the middle of the range.
Divide positions smaller than usual as the market tightens before major news.
Find this analysis useful?
Press Follow to update the plan daily before trading hours and discuss more effective strategies!
Wishing everyone a day of total victory in trading!
