XAU/USD – Gold Completes Liquidity Sweep Phase🔍 Market Context
After a prolonged decline from the peak ATH GOLD 4,371 USD , gold has formed a Liquidity Sweep around the 4,010 USD zone, where the selling side was completely absorbed by strong buying pressure from the demand zone below.
The price structure shows signs of a Change of Character (ChoCH) for the first time since the peak, along with the appearance of an Order Block (OB) 4,081 USD – the starting point for a new upward momentum.
This indicates a high possibility that the market is entering a technical retracement phase , aiming to retest the FVG resistance zone above, or even expand back to the ATH zone if buying pressure continues.
💎 Key Technical Structure
Liquidity Sweep: 4,010 – 4,020 USD → liquidity sweep bottom zone, increased volume appears, confirming absorption of sell orders.
Order Block (OB): 4,081 – 4,090 USD → starting zone for recovery momentum; if the price retests this zone and holds → confirmation signal for an upward phase.
Fair Value Gaps (FVG):
• FVG1: 4,196 – 4,210 USD → first target for the recovery wave.
• FVG2: 4,234 – 4,250 USD → next target, confluence of medium-term resistance.
OB | ATH GOLD: 4,370 – 4,380 USD → major resistance zone, previous peak; if the price surpasses → confirmation of a new upward trend.
Current market structure:
→ Short-term: bullish recovery (recovering from the bottom zone).
→ Medium-term: waiting for confirmation to break 4,234 to transition to a complete bullish structure.
📈 Trading Scenarios
1️⃣ BUY Setup #1 – Retest the Order Block 4,081 USD
Entry: 4,081 – 4,085
SL: 4,060
TP1: 4,196
TP2: 4,234
TP3: 4,370
✅ Conditions:
Wait for the price to retest the OB 4,081 zone, a confirmation signal for an increase appears (rejection / engulfing bullish) or a small BoS on M15.
➡️ This is a classic buy-the-dip setup after a Liquidity Sweep – high probability due to the confluence of OB + ChoCH + strong demand zone.
2️⃣ BUY Setup #2 – Break & Retest FVG 4,196 USD
Entry: 4,196 – 4,200
SL: 4,180
TP: 4,234 → 4,370
✅ Conditions:
The price breaks up the first FVG with good volume, then lightly retests without closing candles below 4,180.
➡️ Trend-following setup, following the money flow when the price confirms breaking the short-term resistance zone.
📉 Alternative Scenario – SELL reaction at 4,234 USD (Short-term Scalp)
Entry: 4,234 – 4,240
SL: 4,255
TP: 4,196 → 4,100
✅ Conditions:
If the price reacts strongly and fails at the second FVG without follow-up volume increase → a short adjustment phase may appear.
➡️ Short-term sell, only execute if there is no continuation confirmation at FVG2.
⚠️ Risk Management
Prioritise BUY according to the main recovery trend, only SELL when there is a clear reaction.
Do not FOMO buy in the middle range (4,130–4,180).
If the price closes H1 candles below 4,060 → invalidate the recovery trend, pause all buy orders.
💬 Conclusion
Gold has completed the Liquidity Sweep phase and is signaling a sustainable technical reversal .
Two important zones to monitor:
4,081 USD (OB Zone): first rebound support zone.
4,234 USD (FVG Zone): zone confirming a new upward structure.
If the price holds OB and breaks through FVG, there is a high chance gold will resume its upward momentum towards the 4,370 USD (ATH GOLD) zone.
👉 Reasonable Strategy:
Buy 4,081 USD → TP 4,234 / 4,370 USD.
Sell reaction 4,234 USD only when a clear reversal signal appears.
🔥 “Liquidity has been swept — now it’s time to ride the recovery wave.”
⏰ Timeframe: 1H
📅 Updated: 23/10/2025
✍️ Analysis by: Captain Vincent
Fibonacci

XAU/USD – Gold Tests Final Structure Before Deciding New Wave“If the 3,950 USD zone is breached, the long-term uptrend may end.”
🔍 Market Context
After reaching the historic peak ATH GOLD 4,381 USD , gold has sharply corrected and formed a clear Change of Character (ChoCH) on the H1 timeframe.
Currently, the price is technically recovering to the Resistance – FVG – Fibonacci 4,216 USD zone, which was previously a distribution peak.
The sellers are regaining short-term dominance, while the Order Block zone (3,953–3,960 USD) — which was the starting point of the strongest growth on H4/Daily — is becoming the most critical defense line of the uptrend.
If this zone is decisively broken, it is highly likely that the medium-term bullish structure will break and trigger a bearish expansion towards deeper liquidity zones like 3,689 USD.
💎 Technical Analysis
Resistance – FVG – Fib Zone: 4,216 – 4,228 → confluence resistance zone FVG + Fibo 0.618, suitable for sell reaction.
Liquidity Sweep Zone: 4,043 – 4,006 → intermediate liquidity sweep zone, may see a temporary pause.
Order Block | Structural Base: 3,953 – 3,960 → H4 momentum creation zone → ATH; if breached, long-term bullish structure is invalidated.
Liquidity Zone $$$: 3,689 – 3,685 → deep liquidity zone, potential target if OB is broken.
Overall Structure:
→ Short-term: bearish corrective phase.
→ Medium-term: bullish remains if 3,950 is not broken.
📉 Trading Scenarios
1️⃣ SELL Setup – Reaction at 4,216 – 4,228 USD zone
Entry: 4,216 – 4,228
SL: 4,240
TP1: 4,043
TP2: 3,956
TP3: 3,689
✅ Condition:
Wait for a clear reversal signal (strong rejection or bearish engulfing) on H1/M15 at the FVG resistance zone.
➡️ Classic “Sell the Rally” setup – follow the flow post-ChoCH, targeting the key OB zone 3,953 USD.
2️⃣ BUY Setup – Reaction at Order Block 3,953 – 3,960 USD
Entry: 3,956 – 3,953
SL: 3,940
TP: 4,043 → 4,216
✅ Condition:
Price holds OB and a strong reversal signal appears (bullish engulfing / increased volume / small BoS structure turns bullish again).
➡️ This is the decisive zone for the medium-term trend: if it bounces strongly, buyers will regain control; if it breaks, gold enters a new deep decline cycle.
⚠️ Risk Management
Prioritise SELL when price retraces to 4,216 – 4,228 with reversal signals.
BUY at 3,953 only with a clear reaction; if broken, cease all buy orders.
When price closes H4 candle below 3,950 → confirm bearish break, extend target to 3,689 USD.
💬 Conclusion
Gold is testing the Order Block foundation of the long-term uptrend (3,953–3,960 USD) .
If this zone holds, the market may rebound to 4,216 – 4,280;
but if breached, gold is likely to open a deep decline phase towards 3,689 USD – where a large liquidity pool is concentrated at the bottom.
👉 Reasonable Strategy:
Sell 4,216 – 4,228 USD if clear reversal signals appear.
Buy 3,953 – 3,960 USD if strong reaction;
If 3,950 is breached → confirm extended downtrend, prioritise SELL continuation.
🔥 “This Order Block built the last gold rally — if it breaks, the next leg down will be brutal.”
⏰ Timeframe: 1H – reference H4/Daily
📅 Update: 22/10/2025
✍️ Analysis by: Captain Vincent

XAUUSD – Awaiting a Breakout to Confirm the Next Bullish WaveGold remains under pressure, trading slightly below 4,100 USD/oz despite ongoing geopolitical tensions and weak global sentiment.
On the higher timeframe, the structure still respects its ascending channel, showing no signs of a deep breakdown yet.
During the early Asian session, renewed buying interest has started to emerge, supported by a stable inflow of safe-haven demand.
Technically, price is attempting to form a bullish continuation structure (Dow wave) around the 4,110 zone.
If a breakout above this key level occurs, gold could accelerate toward 4,155, and potentially extend into a corrective bullish wave targeting 4,220–4,260, aligning with the Fibonacci retracement confluence and the CP/OBS sell zone on the chart.
Technical Outlook (M30):
Price action suggests a potential wave recovery structure forming after last week’s steep decline.
The 4,155 level acts as a key inflection point — it will decide whether bulls regain control or bears push for another correction.
Key Levels:
CP Zone Up / Breakout Base: 4,053 – 4,055
Short-Term Key Level: 4,110 – 4,115
Mid-Level Resistance: 4,155 (structure pivot)
Fibo Sell Zone / Wave End Target: 4,220 – 4,263
Trading Plan:
🔹BUY Setup #1
💥Entry: 4,020 – 4,018
❌Stop Loss: 4,010
✔️Take Profit: 4,030 → 4,035 → 4,040 → 4,050 → 4,060 → 4,100
⏸Bias: Reaccumulation Phase (structure support)
🔹BUY Setup #2 (Scalp Play)
🔔Entry: 4,053 – 4,051
❌Stop Loss: 4,043
✔️Take Profit: 4,060 → 4,070 → 4,080 → 4,090 → 4,100 → 4,150
⏸Note: Ideal for intraday traders watching the breakout base.
🔹SELL ZONE (Liquidity Reaction Zone)
📊Entry: 4,263 – 4,265
❌Stop Loss: 4,273
✔️Take Profit: 4,255 → 4,250 → 4,240 → 4,230 → 4,220 → 4,210 → 4,200
⭐️Summary:
Gold continues to consolidate above 4,050, showing signs of early recovery after the recent 3,000-pip correction.
The 4,155 level remains the key pivot for short-term direction — a breakout here could confirm a Wave 3–5 recovery structure, while rejection could bring one more pullback.
Macro and geopolitical uncertainty still favour safe-haven flows, keeping the bullish scenario valid as long as 4,000–4,020 holds.
📊What’s your take — will gold break above 4,155 to start a new bullish wave, or reject and extend the correction further?

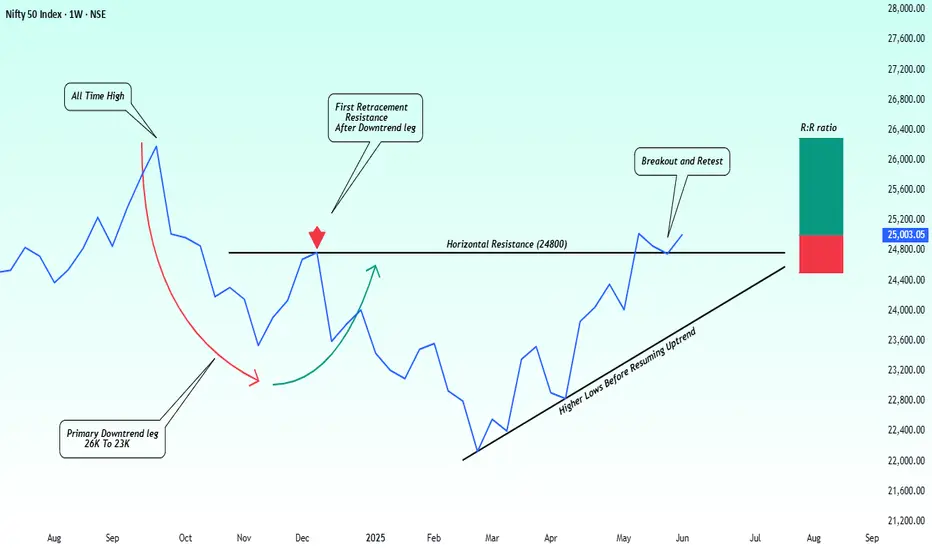
NiftY Weekly: From Primary Downtrend to BreakoutHi Traders, Sharing a clean structural setup spotted on the Nifty weekly chart. Hope this helps you in your planning. Feedback and thoughts are always welcome!
Nifty Weekly Trade Setup — Targeting 26,300--::
Following a significant correction from the all-time high near the 26000 zone Nifty formed a well defined primary downtrend leg bottoming around 22000. What’s developed since is a classic structural shift from distribution → accumulation → potential markup let's discuss.
After the downtrend price attempted a retracement rally, but it was rejected at the prior breakdown zone and creating a clear horizontal resistance. This rejection led to a base formation supported by a series of higher lows, indicating reduced selling pressure and early signs of buyer strength.
Eventually, Nifty broke above the resistance zone and more importantly held its retest, turning resistance into support. This clean breakout + retest structure is often a precursor to trend continuation.
Technical Highlights-:
Primary Downtrend: 26000 To 23000.
Failed Retracement Resistance: 24800.
Breakout Confirmation: Price moved above and retested 24800.
Structure: Series of higher lows.
Support Zone: 24800 To 24500.
Momentum: Bullish price action with controlled pullbacks.
Trade Setup-:
Bias: Long
Entry: Current levels or dips toward 24900
Stop-Loss: Below 24500
Target:26000, 26300 (previous all-time high zone)
Rationale-:
This trade aligns with classic price action principles:
Breakdown zone turned into support.
Structure of higher lows holding firm.
Valid breakout-retest confirmation.
Risk clearly defined with natural invalidation.
With Nifty respecting structure and momentum building gradually, a revisit to the 26300 zone looks increasingly probable in the coming weeks.
Hope you will like the idea, Best regards- Amit.
GOLD RECOVERS: H1 Bounces at $4,150 – Sniping the Fibo SELL Zone🎯 Macro Summary & Bias: Weak USD & CPI Focus Drive Recovery
Gold price gained some traction in early European trading on Wednesday, recovering above the $4,150 level.
Primary Driver: The weaker US Dollar (USD) is currently supporting the price recovery.
Mixed Forces: Easing US-China trade tensions are putting some pressure on Gold, but this is offset by Fed rate cut expectations and general market uncertainty, which should limit the downside.
Key Event: Traders are keenly focused on the US CPI (Consumer Price Index) inflation report for September this Friday. Any sign of hotter-than-expected US inflation could lift the USD and pressure Gold in the short term.
Technical Bias: After the DOUBLE TOP DUMP and a +3000 PIPS move down, the market is now attempting a corrective rally. Our strategy is to SELL the strong Fibo/Volume resistance (Sell on Rally) before looking for the next BUY zone.
📊 In-Depth Technical Analysis (H1): Pinpointing the FIBO Reaction Levels
Based on the recent major market reversal from the Double Top and the current corrective bounce (Referencing image_43ce7f.png), we have our strategic levels:
1. Strategic SELL Zones (FIBO SELL REACT ZONES):
These are the primary resistance zones for executing SELL trades, anticipating the continuation of the post-dump correction:
REACTION FIBO 0.5 ZONE - SELL ZONE 4190 - 4200: This is the first critical resistance zone (0.5 Fibo retracement) to look for a Short entry.
REACTION FIBO - SELL ZONE BIG VOLUME for SELL SIDE 4300 - 4310: This is the major supply/liquidity zone and the ultimate target for the current corrective rally.
2. Strategic BUY Zone (ORDER BUY REACT ZONE):
This is the key support area where the previous dump found temporary relief, which we use for stop-loss or potential re-entry:
ORDER BUY ZONE 4100 - 4090: This is the immediate support zone formed after the dump, which is currently holding the price.
📈 TODAY'S ACTION PLAN
Primary Action (Prioritize SELL on Rally): Wait for the corrective bounce to reach the REACTION FIBO 0.5 ZONE - SELL ZONE 4190 - 4200.
Short Entry: Execute the SELL entry upon confirmed reversal candles (H1/M30/M15) in the 4190 - 4200 zone.
Targets (TP): Aim to retest the recent low and the LIQUIDITY PUMP area.
Contingency BUY: If price breaks decisively above 4200, the rally may extend to the BIG VOLUME SELL ZONE 4300 - 4310.
⚠️ Risk Warning
Risk Management: Place Stop Loss (SL) above the 4200 zone for the short entry. Watch the US CPI report on Friday closely, as inflation data could cause extreme volatility.
Wishing all FranCi$$_FiboMatrix traders a disciplined and victorious day!

GOLD PULLBACK: $4330 SLIDE! Sniping the Fibo BUY Zone🎯 Macro Summary & Bias: USD Stability Triggers Profit-Taking
Gold is extending its corrective slide from the all-time high zone, hitting around $4,331 - $4,330.
Primary Headwind: The US Dollar (USD) attracted buyers for three consecutive days, causing stability which triggered profit-taking in the overbought Gold market.
Long-Term Support: DXY trades slightly negatively due to the US government shutdown and trade tensions, keeping the long-term bullish outlook intact.
Technical Bias: The market is in a deep correction/profit-taking phase. Our focus is strictly on finding the FIBO BUY REACT ZONES to join the underlying bullish trend. DO NOT CHASE THE SELL MOVE.
📊 In-Depth Technical Analysis (H1): Pinpointing the FIBO Reaction Levels
Based on the current corrective structure and the Fibo/Volume zones defined on image_ddd575.png, we have our strategic levels:
1. Strategic SELL Zones (FIBO SELL REACT ZONES):
These are current resistance areas for short-term rejection or supply zone testing:
REACTION FIBO SELL ZONE 4340 - 4320: Current resistance. Look for a SCALP SELL opportunity if the price rejects this zone.
REACTION SELL ZONE - Big Volume for Sell Side 435x: Major supply/liquidity zone if price attempts a deeper retracement.
2. Strategic BUY Zones (FIBO BUY REACT ZONE):
These are the most critical Fibo support zones for initiating Long entries:
REACTION FIBO BUY ZONE 4270 - 4265: The first crucial Fibo Retracement support.
REACTION BUY ZONE - Big Volume For Buy Side 4230 - 4220: The high-volume demand zone and optimal entry point for the major Long trade.
📈 TODAY'S ACTION PLAN
Primary Action (Prioritize BUY): Wait for the price to correct to the REACTION FIBO BUY ZONE 4270 - 4265 or 4230 - 4220.
Long Entry: Execute the BUY entry only upon confirmed reversal candles (H1/M30/M15).
Scalp SELL Action: If the price strongly rejects the 4340 - 4320 zone, a quick SCALP SELL targeting the nearest BUY ZONE can be considered.
Targets (TP): Aim for the highs and the 435x Sell Zone for the Longs.
⚠️ Risk Warning
Risk Management: Always place a safe Stop Loss (SL) below the nearest active BUY ZONE. DO NOT OVERLEVERAGE in this corrective phase.
Wishing all FranCi$$_FiboMatrix traders a disciplined and victorious day!

Gold Holding Gains Ahead of Key US CPI DataGold extends its bullish momentum in early Asian trading, hovering near ₹4,370, supported by rate-cut expectations from the Fed and ongoing US government shutdown concerns, which continue to pressure the USD.
According to CME FedWatch, markets are now pricing in a 99% probability of another rate cut next week — a strong catalyst for gold bulls.
Lower interest rates reduce the opportunity cost of holding non-yielding assets like gold, reinforcing the medium-term uptrend.
However, all eyes are on the US September CPI report due later this week.
A hotter-than-expected reading could temporarily lift the USD and trigger short-term volatility in gold prices.
🔍 MMFlow Technical Outlook
Gold is currently consolidating around the ₹4,320–₹4,370 range after reaching the ATH zone.
Price action shows a clear liquidity sweep at the highs, followed by a minor retracement — still within the bullish structure.
The main trendline remains intact, suggesting that any dip toward ₹4,305–₹4,260 may attract new buyers.
⚙️ Trading Plan (MMFlow View)
🔼BUY SCALP
📌Entry: ₹4,302 – ₹4,300 (½ volume)
❌Stop Loss: ₹4,292
✔️Take Profit: ₹4,310 → ₹4,315 → ₹4,320 → ₹4,330 → ₹4,340 → ₹4,350+
🔼BUY ZONE (Swing)
✨Entry: ₹4,260 – ₹4,258
❌Stop Loss: ₹4,252
✔️Take Profit: ₹4,265 → ₹4,270 → ₹4,280 → ₹4,290 → ₹4,300+
📈Buy setups remain favored as long as price holds above ₹4,260.
Intraday sell reactions near ₹4,360–₹4,378 are short-term only — watch for liquidity grabs and bullish re-entry opportunities.
⚡️Key MMFlow Zones
CP Down Zone / OBS Sell Zone: ₹4,360
ATH Liquidity Sell Zone: ₹4,448
Retest Trendline / OBS Buy Zone: ₹4,305
End FVG Uptrend / OBS Buy Zone: ₹4,260
Sentiment: 🟢 Bullish Bias
Bias Confirmation: CPI Data & Fed Rate Expectations
Strategy: Buy-the-Dip → Target Liquidity Above ₹4,370–₹4,380
🔥 Stay patient — let liquidity drive the next leg. MMFlow tracks smart money zones, not emotions.

XAU/USD – Gold Technical Rebound Prepares for Next Waveb]🔍 Market Context
After reaching a peak at the ATH GOLD 4,391 USD region, gold has undergone a technical correction — reflecting temporary profit-taking following a strong upward trend.
The market structure still maintains a bullish bias as the support zones below (FVG + OB) remain intact and untested.
Currently, the price is hovering around 4,325 USD, indicating that selling pressure has weakened.
Buyers are likely to return at two strategic zones below — where institutional money (Smart Money) typically accumulates positions before the next upward wave.
💎 Technical Analysis
ATH GOLD: 4,391 USD
Liquidity Zone $$$: 4,465 – 4,424 USD → the upper liquidity zone, the main target for the next upward wave.
FVG Zone: 4,284 – 4,267 USD → an unfilled gap, likely to be retested.
Order Block Zone: 4,244 – 4,230 USD → deep discount zone confluence with Fibo 0.786, high probability of strong reaction.
Liquidity Clear $$$: 4,186 – 4,190 USD → the last defense zone of the main upward trend.
Overall structure remains bullish ; the current decline is merely a phase of adjustment to “accumulate liquidity” before continuing the upward momentum.
📈 Trading Scenarios
1️⃣ BUY Setup #1 – FVG Zone 4,267 USD
Entry: 4,267 – 4,270
SL: 4,255
TP: 4,330 → 4,366 → 4,391
✅ Condition: Confirming bullish candle (rejection / engulfing bullish) at the FVG zone or a small BoS appears on M15.
➡️ Short-term “buy-the-dip” setup, leveraging the unfilled FVG zone — where technical buyers often initiate positions first.
2️⃣ BUY Setup #2 – Order Block Zone 4,244 USD
Entry: 4,244 – 4,230
SL: 4,210
TP: 4,284 → 4,366 → 4,391 → 4,424
✅ Condition: Strong confirming candle (engulfing bullish) or a retracement pattern breaking a small BoS back up.
➡️ Swing-buy setup at deep discount zone — confluence of OB + Fibo 0.786, high probability and optimal R:R.
⚠️ Risk Management
Avoid FOMO buying in the middle of the range (4,320–4,340).
Prioritize waiting for clear reactions at 4,267 and 4,244 before entering trades.
If the price closes an H1 candle below 4,210 → pause all buy orders, re-evaluate price action at 4,186.
Maintain moderate trading volume during the current rebound phase.
💬 Conclusion
Gold is in a phase of healthy technical correction within a major upward trend.
The two zones 4,267 USD (FVG Zone) and 4,244 USD (Order Block Zone) are key “accumulation” areas for large capital.
When bullish confirmation signals appear, these will be safe buy positions before gold heads back to the peak 4,391 – 4,465 USD .
👉 Reasonable Strategy:
Buy at 4,267 – 4,270 USD if reversal confirmation occurs.
Buy at 4,244 – 4,230 USD if a strong OB reaction signal appears.
🔥 “Smart money waits at precise levels — not at the top. The next gold wave will emerge between 4.267 and 4.244.”

XAUUSD PLAN | When balanced breaks, strength leaves its mark.🔍 Market Context
After setting a short-term peak at the 4,385 – 4,372 USD zone, gold has entered a strong technical correction phase, with a series of consecutive red candles breaking the short-term upward structure.
The sellers temporarily dominate, pushing the price through the H1 upward trendline. However, the support zone below (Liquidity Zone + Order Block Bullish) is beginning to show absorption, indicating that buyers might return at discounted price zones.
💎 Technical Analysis
Previous Bullish BoS: confirms the main trend is still long-term bullish .
FVG Down Zone: 4,285 – 4,260 USD → a price imbalance zone left in the downtrend, possibly where the price may retrace to “fill the gap” before choosing a direction.
Liquidity Zone $$$: 4,222 – 4,218 USD → a short-term support zone where new buying liquidity appears.
Order Block Bullish: 4,203 – 4,185 USD → a confluence area between OB and Fibo 0.786, where large capital might return.
Deep Bullish OB: 4,142 – 4,128 USD → the last defensive zone for the main upward trend.
Order Block Bearish: 4,372 – 4,385 USD → a critical resistance zone, likely to react if the price retraces.
The current structure shows gold is in a retracement – liquidity rebalancing phase, with insufficient signals to reverse the trend.
📈 Trading Scenarios
1️⃣ Main Scenario – Buy reaction at Liquidity zone 4,222 – 4,203 USD
Entry: 4,222 – 4,203
SL: 4,185
TP: 4,260 → 4,318 → 4,372
✅ Condition: Strong rejection candle (rejection / engulfing bullish) appears at the support zone or small reversal BoS.
➡️ This is a “buy the dip” setup following the main trend, leveraging the liquidity zone and confluence OB.
2️⃣ Secondary Scenario – Sell reaction at FVG Down 4,285 – 4,260 USD
Entry: 4,260 – 4,285
SL: 4,300
TP: 4,222 → 4,203
✅ Condition: Strong bearish candle or rejection signal appears at the FVG zone.
➡️ This setup is for scalping traders or short-term shorts in the unfilled price balance zone.
⚠️ Risk Management
Do not FOMO buy when the price has not confirmed the 4,222 zone.
If the price breaks below 4,185 → wait for a re-test to continue selling towards the 4,128 zone.
Keep moderate volume, as the market is in a rebalancing phase – liquidity remains noisy.
💬 Conclusion
Gold is in a transitional phase after a strong decline .
The 4,222 – 4,203 USD zone will be key to determining whether the medium-term upward trend continues.
If this zone holds, gold is likely to retest the 4,318 – 4,372 USD zone.
👉 Reasonable Strategy:
Buy reaction at 4,222 – 4,203 USD when confirmed.
Technical Sell at FVG 4,260 – 4,285 USD if a clear rejection appears.
🔥 “When the market is unbalanced, the strongest side will leave a mark – and this time, the mark is around the 4,220 USD zone.”

AdityaBirlaCapital - Investment IdeasAditya Birla Capital Ltd - Technical Analysis
Simple Technical Analysis Summary
Aditya Birla Capital is breaking out from a multi-year resistance zone with a classic and perfect rounding bottom pattern playing out on the monthly timeframe.
Fibonacci targets have been activated!
Key Technical Observations
1. Multi-Year Rounding Bottom Pattern
The stock has completed a textbook rounding bottom formation spanning multiple years. This is one of the most reliable bullish reversal patterns in technical analysis, indicating a fundamental shift from bearish to bullish sentiment.
2. Breakout from Multi-Year Resistance
After years of consolidation and base building, the stock has successfully broken out from a significant resistance zone around ₹255. This breakout signals the potential beginning of a new uptrend cycle.
3. Monthly Timeframe Confirmation
The pattern is forming and confirming on the monthly timeframe, which carries significantly more weight than shorter timeframes. Monthly breakouts tend to lead to sustained moves.
4. Fibonacci Extension Framework
Multiple Fibonacci extension levels have been identified and activated, providing a clear roadmap for potential price targets based on the measured move from the rounding bottom pattern.
#Fibonacci Extension Target Levels
Based on the rounding bottom pattern measurement and Fibonacci extensions:
- Target 1: 314.20 (1.272 Fibonacci Extension)
- Target 2: 345.10 (1.414 Fibonacci Extension)
- Target 3: 389.90 (1.618 Fibonacci Extension)
- Extended Target: 472.00 (2.0 Fibonacci Extension)
Key Support Levels
- Immediate Support: 255.00 (Breakout level / Previous resistance turned support)
- Secondary Support: 171.86 (0.618 Fibonacci retracement)
- Critical Support: 146.17 (0.5 Fibonacci retracement)
- Base Support: 42.35 (Rounding bottom base)
- Pattern suggests long-term bullish structure - Risk-reward favorable for position building on dips
Risk Management:
- Maintain stoploss below 255 on monthly closing basis
- For aggressive traders: 240 (allowing some wiggle room)
- For conservative traders: 235 (below breakout zone)
Invalidation Level:
- Monthly close below 240 would weaken the bullish structure
- Break below 220 would invalidate the immediate bullish setup
DISCLOSURE & RISK WARNING:
This analysis is provided for educational and informational purposes only and should not be construed as financial advice, investment recommendation, or an offer to buy or sell securities. Past performance is not indicative of future results.

#Cipla - #ShortTerm #Inveatment IdeaCipla Ltd - Technical Analysis
Current Price: 1,639.10
Timeframe: Monthly Chart Analysis
This analysis utilizes:
- Monthly and Weekly timeframe analysis
- Fibonacci extension and retracement levels
- Support/resistance identification
- RSI momentum analysis
- Price action patterns
Technical Structure Overview
1. Monthly Consolidation Phase
After making a higher high, Cipla is currently in a consolidation phase on the monthly chart, forming a strong base. This consolidation suggests preparation for a potential significant move higher.
2. Breakout Level to Watch
The critical level to monitor for breakout confirmation is around the recent high zone. A decisive break above this level could trigger the next leg of the uptrend.
3. Weekly Timeframe Confirmation
For higher probability setups, confirmation should be sought on the weekly timeframe before taking any positions. This multi-timeframe approach reduces false signals.
4. Fibonacci Extension Targets
Based on Fibonacci patterns, the following extension levels have been identified as potential targets for future price movement.
5. Risk Management Strategy
Following a risk-reward approach is essential for this setup given the consolidation phase and potential for significant moves in either direction.
Fibonacci Extension Target Levels
Based on technical projections:
- Target 1: 1,872.70 (1.272 Extension at 1,878.05)
- Target 2: 1,986.95 (1.414 Extension at 1,987.15)
- Target 3: 2,145.45 (1.618 Extension at 2,143.95)
Key Support Levels
Primary Support: 1,345.75 (0.5 Fibonacci level)
Critical Support: 900.50 (0 level - invalidation zone)
Trading Considerations
Bullish Scenario:
- Wait for monthly candle close above consolidation range
- Confirm momentum on weekly timeframe
- Enter on weekly pullback for optimal risk-reward
Invalidation:
- Break and close below ₹1,345.75 would weaken the bullish structure
- RSI showing divergence patterns to monitor
DISCLOSURE & RISK WARNING:
This analysis is provided for educational and informational purposes only and should not be construed as financial advice, investment recommendation, or an offer to buy or sell securities. Past performance is not indicative of future results.

Hindpetro Long - Investment IdeaHindustan Petroleum (HINDPETRO) - Monthly Chart Analysis
Current Price: 441.75
Major #Breakout in Progress
**Timeframe:** Monthly (Long-term View)
Key Technical Event:
🚀 Historic Breakout - Stock has broken above 2017 all-time high after 8 years of consolidation
- Breakout Level: 325.55
- Retest Zone: 410-420 - Currently retesting breakout
Hindpetro is Brewing for fresh new highs above ₹441
Target Projections based on #Patterns and #Fibonocci levels.
Interim Targets:
- Support holding at ₹416
- Immediate resistance: ₹480-500 zone
Short Term Targets:
- Tgt 1: 530
- Tgt 2: 657
Extended Targets: 593-629
Technical Significance:
- **8-year base breakout** = High probability of sustained uptrend
- Monthly trend reversal confirmed
- Trading well above long-term moving average
- Volume-supported breakout suggests institutional accumulation
Risk Management:
- Stop Loss: Below 410 on monthly closing basis
- Key Support: 325 (previous resistance now support)
Outlook:
After breaking a major multi-year resistance, HINDPETRO is consolidating gains and positioning for the next leg up. Patient accumulation recommended on dips toward ₹410-420.
This is for educational purposes only.* Do your Own analysis before taking Trade.

GOLD Accumulates Above $4200 Which Fibo React Zone Fires First ?🎯 Macro Summary & Bias: The Calm Before the Geopolitical Storm
Gold is trading above the psychological $4,200 mark but struggled to gain meaningful traction on Monday due to mixed forces.
Driving Forces: Increased geopolitical tensions and trade uncertainty act as tailwinds for the safe-haven asset.
USD Weakness: Expectations for more Fed rate cuts and the US government shutdown weaken the USD, providing support for XAU/USD. Traders have fully priced in two more rate cuts this year, which continues to pressure the US Dollar.
Technical Outlook: Gold is currently consolidating above $4,200, signaling that the bullish structure remains intact. We are now watching for confirmation at key Fibo levels before the next breakout.
📊 In-Depth Technical Analysis (H1): Pinpointing the FIBO Reaction Levels
Our core strategy is to BUY ON DIPS at the identified Fibo Reaction Zones and look for short-term Sells only as resistance tests (Referencing image_58f686.png).
1. Strategic BUY Zones (FIBO BUY REACT ZONE):
These are the crucial support zones for initiating Long entries:
Reaction Fibo Buy Zone 4230 - 422x. This is the immediate, primary support zone where we anticipate the first bounce.
Big Volume For The BUY Side 4205 - 4200. This is the major demand zone and the ultimate pullback point to catch the large growth wave.
2. Strategic SELL Zones (FIBO SELL REACT ZONES):
These are high-volume resistance areas for potential Take Profit (TP) or short-term Scalp Sells:
Reaction Fibo Sell Zone 4280 - 4285. The first key resistance level where the price may encounter selling pressure.
Reaction Fibo Sell Zone 4315 - 4320. The next significant resistance and TP level.
Big Volume For The Sell Side 4356 - 4360. The major supply and long-term TP target.
📈 TODAY'S ACTION PLAN
Primary Action (Prioritize CHỜ ĐỢI BUY): The market is consolidating. Do NOT FOMO. Patiently wait for the price to correct to the Reaction Fibo Buy Zone 4230 - 422x.
Long Entry: Upon confirmation (H1/M30/M15 reversal candles) at the BUY Zones, confidently activate the Long (BUY) entry.
Targets (TP): Aim for the successive SELL Zones: 428x, 431x, and the ultimate target at 4356 - 4360.
⚠️ Risk Warning
Risk Management: Always place a safe Stop Loss (SL) below the nearest active BUY ZONE. Monitor trade talks closely as they could trigger sharp volatility.
Wishing all FranCi$$_FiboMatrix traders a disciplined and victorious week!

4,200 or 4,285? Gold’s Next Move Decides It All📊 Market Overview
Gold remains under pressure at the start of the week, trading below last week’s record highs, after a sharp correction from the 4,380s down to the 4,240 zone.
Investor sentiment is cautious as the market navigates a mix of uncertain U.S. economic data, a still-closed U.S. government, and renewed geopolitical tensions across multiple regions — all of which are fueling both fear and indecision in the market.
During early Asian hours, gold showed a mild recovery but continues to move sideways in a tight consolidation range, reflecting indecisive liquidity buildup before the next major move.
🧠 Technical Structure (MMFLOW View)
Gold is consolidating between short-term support near 4,206–4,204 and resistance around 4,285–4,287.
Liquidity has started to cluster above and below the current range, suggesting that a breakout is imminent.
The 4,166 – 4,140 region remains a major Smart Money re-entry zone, aligned with the CP BUY ZONE + OBS demand block.
On the upside, 4,313 – 4,342 stands as a key supply zone where large sellers previously stepped in.
Until price breaks out decisively, traders should expect choppy intraday conditions with limited follow-through.
🔑 Key Levels to Watch
🟢 BUY ZONE (Liquidity Re-entry Zone)
Zone: 4,206 – 4,204
SL: 4,200
TP: 4,210 – 4,215 – 4,220 – 4,230 – 4,240 – 4,250 – ???
🔴 SELL ZONE (Liquidity Reaction Zone)
Zone: 4,285 – 4,287
SL: 4,292
TP: 4,280 – 4,275 – 4,270 – 4,260 – 4,250 – ???
⚙️ MMFLOW Scenarios
1️⃣ Bullish Scenario:
If gold sustains above the 4,200 – 4,210 support area, a short-term rebound toward 4,270 – 4,285 can be expected.
Breaking above 4,287 would open room toward 4,313 – 4,342 (OBS Sell Zone), where Smart Money may begin distributing again.
2️⃣ Bearish Scenario:
A clean break below 4,200 could trigger a deeper retracement toward 4,166 – 4,140 (CP BUY ZONE).
This would still represent a healthy correction within the broader bullish macro structure.
⚡️ MMFLOW Insights
Market remains neutral-to-bullish, but current movement reflects accumulation within a compression range.
Sideway structure indicates the market is loading liquidity for the next impulsive leg.
Patience is key — traders should wait for clean breakout confirmations before scaling positions.
⚠️ Trading Notes
✅ Use tight Stop Losses — gold’s volatility remains unpredictable during macro uncertainty.
✅ Avoid over-leveraging while price stays inside the sideway channel.
✅ Focus on reaction zones (CP, OBS, and liquidity sweeps) for precise entries.
🧭 Quick Summary
Gold trades sideways below record highs.
Key support: 4,206 – 4,204, key resistance: 4,285 – 4,287.
Short-term bias: Range-bound with bullish undertone.
Best approach: Buy dips at liquidity zones; wait for breakout confirmation before trend trades.

GOLD Awaiting Sell Reaction at Peak & Buy Pullback Support🔍 Market Context
After a series of strong Break of Structure (BoS) , gold has reached a new ATH at 4,385 USD – marking a sustainable uptrend over the past 3 sessions.
However, this peak area is currently acting as a significant psychological and technical barrier . Buying momentum is temporarily slowing as the price reacts to the Liquidity Zone around 4,351 – 4,385 USD .
The market is in a phase of liquidity rebalancing .
The major trend remains upward, but the current price area may see a short-term correction before further wave expansion.
💎 Technical Analysis
ATH GOLD: 4,385 USD
Sell Liquidity Zone: 4,430 – 4,435 USD → high liquidity resistance zone, potential for short-term sell reactions.
Liquidity Zone $$$: 4,284 – 4,282 USD → nearby support zone, confluence with trendline.
Order Block | Fibonacci Zone: 4,226 – 4,230 USD → deep discount zone confluencing with Fibo 0.618, high reversal potential.
Overall Structure: remains bullish , but showing short-term signs of weakness as the price fails to hold above 4,360.
📈 Trading Scenarios
1️⃣ SELL Setup – Rejection at peak area 4,385 – 4,433 USD
Entry: 4,430 - 4,435
SL: 4,440
TP: 4,425 → 4,420 →4,415→4,410→4405
✅ Condition: Appearance of rejection or strong bearish engulfing candles at high Liquidity zone.
➡️ This is a liquidity reaction setup – sell when the price sweeps the peak and clear sell signals from major players appear.
2️⃣ BUY Setup #1 – Pullback at 4,284 – 4,282 USD
Entry: 4,284 – 4,282
SL: 4,272
TP: 4,290 → 4,300 → 4,310/Open
✅ Condition: Strong H1 candle reaction at support or minor reversal structure.
➡️ Buy with the main trend, taking advantage of a slight pullback around the support Liquidity zone.
3️⃣ BUY Setup #2 – OB Deep Zone 4,226 – 4,230 USD
Entry: 4,226 – 4,230
SL: 4,190
TP: 4,235 → 4,240 → 4,250/Open
✅ Condition: Appearance of bullish BoS or confirming bullish engulfing candle.
➡️ This is a deep discount zone, suitable for swing orders following the main trend.
⚠️ Risk Management
Avoid FOMO buying at high zones (4,360+).
Prioritize observing price behavior at 4,284 and 4,226 before entering orders.
Sell orders at 4,385–4,430 are only triggered if there is a clear confirmation signal.
Maintain moderate volume, avoid averaging down without confirmation.
💬 Conclusion
Gold is accumulating after reaching the peak of 4,385 USD , this is a crucial phase to determine the correction before the new upward wave.
The most effective strategy now is sell reaction at the high peak area 4,385 – 4,430 and buy with the trend at 4,284 – 4,226 USD when confirmation appears.
👉 Reasonable Strategy:
Sell Reaction: 4,385 – 4,430 → TP 4,284 – 4,226
Buy Pullback: 4,284 – 4,282
Buy OB Deep: 4,226 – 4,230

Infy remains under pressure, stuck in long-term sideways rangeTopic Statement:
Infy has struggled this year with repeated price declines, remaining stuck in a wide sideways zone while trading at heavily oversold levels.
Key Points:
1. The price has fallen to the 38.2% Fibonacci retracement level multiple times, where it continues to receive support
2. It is currently trading below both the 50-day and 200-day EMAs, marking the stock as highly oversold
3. Infy has been range-bound between 1300 and 2000 since 2022, reflecting a prolonged phase of consolidation and indecision

Fibo BUY Zone Mandatory for Trend Continuation.🎯 Macro Summary & Bias: The Bulls Are Unstoppable!
Gold is the most sought-after asset as XAU/USD aims directly for the $4,300 mark and further.
Primary Catalyst: Financial markets remain cautious amidst the ongoing US government shutdown.
Driving Force: Widespread USD weakness—fueled by the funding battle in the US government—strengthens the bullish case for Gold.
Record Strength: XAU/USD is maintaining positive upward momentum despite extreme overbought conditions.
Technical Focus: In this continuous Bull market, FIBO is the paramount tool for identifying the critical pullback points to initiate BUY entries.
📊 In-Depth Technical Analysis (H1): Pinpointing the FIBO Reaction Levels
Our core strategy remains BUY ON DIPS at the most precise Fibo levels, leveraging the strong Parabolic structure.
1. Strategic BUY Zone (FIBO BUY REACT ZONE):
This is the most crucial Fibo support zone where we anticipate a high-probability pullback:
4,321.332 The REACTION FIBO BUY ZONE 0.5.
This is the most vital retracement point to catch the next growth wave.
2. Sell/Take-Profit Targets (FIBO SELL TARGETS):
These are the Fibo extension targets where the Longs are aiming:
TP Target 1 (Extension) 4,436.179 The REACTION FIBO SELL ZONE 1.5 - 1.618. The next immediate target for the rally.
TP Target 2 (Deep Extension) 4,538.394 The REACTION FIBO SELL ZONE 2.5 - 2.618. The long-term target if momentum remains unchecked.
📈 TODAY'S ACTION PLAN
Primary Action (Prioritize BUY): Patiently wait for the price to correct to the REACTION FIBO BUY ZONE 0.5 at 4,321.332.
Upon confirmation (H1/M30/M15 reversal candles), confidently activate the Long (BUY) entry.
Targets (TP): Aim for TP Target 1 (4,436.179) and further to TP Target 2 (4,538.394).
⚠️ Risk Warning
Risk Warning: Given the extreme overbought conditions, always place a safe Stop Loss (SL) below the Fibo BUY ZONE and maintain stringent risk management!
Wishing all FranCi$$_FiboMatrix traders a disciplined and victorious day!

Gold Retests All-Time Highs – Bulls Still in Full Control📊 Market Overview
Gold experienced a sharp intraday drop during the Asian session, testing the 4,280 – 4,279 USD zone before quickly recovering. Despite short-term volatility, it continues to close the week in green for the ninth consecutive time — confirming the strength of the ongoing bullish cycle.
The broader fundamentals remain supportive:
💥 Persistent geopolitical tensions keep safe-haven demand high.
⚖️ US–China trade uncertainty and the risk of a prolonged US government shutdown weaken risk appetite.
💵 Fed rate-cut expectations and USD softness continue to favor gold upside.
In short — Smart Money remains positioned long, and every dip still looks like a liquidity grab for re-accumulation.
🧠 Technical Structure (MMFLOW View)
On the M30 timeframe, gold continues to respect an ascending channel, currently forming a liquidity trap and breakout setup around 4,280 – 4,330.
Price action suggests gold may be completing a short-term corrective wave (B) before resuming the larger bullish impulse.
The structure remains technically bullish, with all pullbacks showing strong rejections from demand zones.
🔑 Key Levels to Watch
🟢 BUY ZONE (Primary Setup)
Zone: 4,230 – 4,228
SL: 4,220
TP: 4,240 – 4,250 – 4,260 – 4,270 – ???
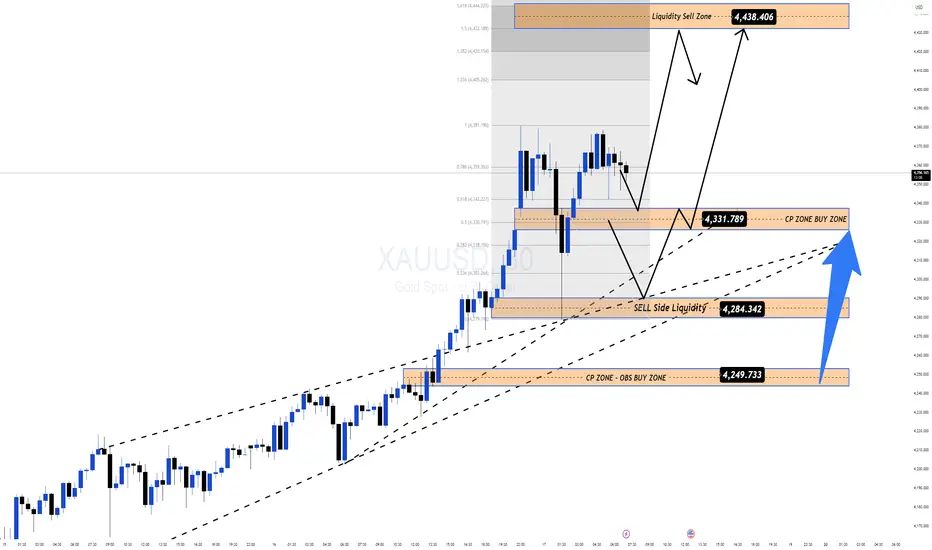
🔵 CP ZONE BUY (Secondary Support)
Zone: 4,284 – 4,285
SL: 4,275
TP: 4,300 – 4,315 – 4,330 – 4,340 – ???
🔴 SCALP SELL (Liquidity Reaction Zone)
Zone: 4,438 – 4,440
SL: 4,448
TP: 4,420 – 4,410 – 4,390 – ???
⚙️ MMFLOW Scenarios
1️⃣ Primary Bullish Scenario:
If gold holds above 4,280 – 4,284, expect continuation toward 4,380 – 4,438 (Liquidity Sell Zone).
The 4,284 level is the key control point where Smart Money may look to re-enter long positions.
2️⃣ Alternative Correction Scenario:
A clean break below 4,280 could drive price toward 4,249 – 4,243 (CP Buy Zone) before another bullish push higher.
This structure still aligns with a Healthy Correction Pattern within a broader uptrend.
⚡️ MMFLOW Insights
Gold remains in a mid-term expansion phase, with both macro and technical alignment favoring continued upside.
The 4,280 – 4,330 range acts as a Smart Money accumulation zone, preparing for a liquidity sweep higher.
Medium-term upside target: 4,438 – 4,445 USD/oz (Liquidity Sell Zone).
⚠️ Trading Notes
✅ Always use a protective Stop Loss — volatility can spike during liquidity hunts.
✅ Avoid chasing entries at highs; wait for reaction around BUY ZONES.
✅ Focus on liquidity confluence zones (Fibo + CP Zone + Order Block) for the highest-probability setups.
🧭 Quick Summary
Gold remains resilient despite early-session volatility.
Watch BUY ZONES at 4,230 – 4,228 and 4,284 – 4,285 for possible long re-entries.
Short-term target: 4,380 – 4,438 USD/oz.
Bias: Bullish – Buy the dips, not the breakouts.
Pause for the Gold Rally#Gold Technical Analysis Report - USD
**Chart Analysis: Gold Spot / U.S. Dollar - 3M**
**Current Price Level:** $2,618 USD
Key Observations:
Gold is currently testing a critical resistance level at 4380.399, which aligns with major Fibonacci extension levels identified on yearly and quarterly charts. The price action shows a consolidation phase after the recent rally, with the market displaying indecision around this significant technical barrier.
Technical Levels:
The Fibonacci retracement structure reveals multiple support zones below the current resistance. Should price face rejection at 4380.399, technical analysis suggests potential pullback zones at 3743, 3403, and 3166 based on the proportional PA (Price Action) alignment on higher timeframe charts.
Market Sentiment:
The long-term uptrend remains intact, with the price structure maintaining higher lows and higher highs from the 1999-2026 timeframe. Current momentum appears to be consolidating before the next directional move, typical of markets approaching significant resistance levels.
Trading Considerations:
Traders should monitor how price responds at the 4380.399 resistance. A break above this level could signal continuation toward 5410 (2.618 Fibonacci extension). Conversely, a rejection could lead to a retest of the identified support zones. Risk management is essential given the proximity to resistance and current consolidation phase.
Disclaimer:
This analysis is for educational purposes only and should not be considered financial advice. Always conduct your own due diligence and consult a financial advisor before making trading decisions.

Gold Plan | Where will gold drop today?🔍 Market Context
Gold continues to maintain a short-term upward trend following a series of Break of Structure (BoS) , confirming active buying from lower zones.
Currently, the price is approaching the ATH GOLD zone and heading towards the Liquidity Sell Zone 4,281 USD – a densely liquid area where short-term sell reactions from major players may occur.
After a hot rise, technical correction risks are starting to increase. Lower zones like 4,186 – 4,152 – 4,130 USD will be potential “accumulation zones” for institutional buyers in the upcoming pullback.
💎 Technical Analysis
ATH GOLD: 4,275 – 4,280 USD
Liquidity Sell Zone: 4,281 – 4,285 USD → high liquidity resistance area, may trigger short-term reversal reactions.
Liquidity Zone $$$: 4,186 – 4,152 USD → crucial support area in the uptrend, where technical reactions are expected.
FVG – BoS Zone: 4,152 – 4,148 USD → “price balance” zone yet to be filled, likely to be retested.
OB Deep Zone: 4,130 – 4,120 USD → deep demand zone converging with Fibo 0.786 – ideal area for large capital to re-accumulate.
Overall structure remains bullish , but in the premium zone – an area where institutions typically distribute orders to gain liquidity before adjusting.
📈 Trading Scenarios
1️⃣ Main Scenario – Sell reaction at Liquidity Zone 4,281 USD
When the price hits the 4,275 – 4,281 USD zone and clear reversal signals appear (rejection candles, bearish engulfing, or minor structure break),
→ open short-term sell orders (scalp/intraday).
Target: 4,186 → 4,152 USD.
Stop Loss: above 4,285 USD.
➡️ This is a typical “liquidity sweep – technical reaction” scenario, capitalising on short-term sell-offs at high liquidity peaks.
2️⃣ Secondary Scenario – Buy back following the main trend after correction
When the price corrects to the 4,186 – 4,152 USD zone or deeper to OB Deep 4,130 USD ,
and clear upward confirmation signals appear (strong rejection or minor BoS increasing again),
→ open buy orders in line with the main trend.
Target: 4,230 → 4,275 USD.
Stop Loss: below 4,120 USD.
➡️ Trend-following scenario – waiting for price correction to discount zones to accumulate in line with the larger trend.
⚠️ Risk Management
Do not FOMO buy when the price is hitting the 4,275 – 4,281 USD zone.
Prioritise short-term sells with clear confirmations or buys at lower OB zones.
Keep light volume when trading against the main trend.
Observe reactions at the 4,186 zone – this is the key level of the day.
💬 Conclusion
Gold is at the peak of the current rise , short-term profit-taking pressure may appear around the 4,281 USD zone.
If strong reactions occur, a correction to the 4,186 – 4,152 USD zone is reasonable for market rebalancing.
The larger trend remains upward , so lower OB zones will be reasonable buy opportunities for the next wave.
👉 Reasonable Strategy:
Sell reaction at 4,281 USD when reversal signals appear.
Buy back at 4,186 – 4,152 – 4,130 USD when confirmation signals appear.

GOLD: 419x FIBO! READY FOR 426x TARGET.Gold is surging near $4,210, backed by Fed rate cut expectations and ongoing trade tensions. The long-term structure is rock-solid Bullish. Our plan is simple: WAIT and BUY the intelligent pullback!
🎯 THE BUY REACT ZONES (H1)
We are prioritizing Longs and patiently waiting for the price to hit the exact FIBO RETRACE levels.
1. PRIME BUY ENTRY (The Sweet Spot):
Zone: 4194 - 4190 (Our key Fibo Retrace Buy Zone).
Action: Look for the price to correct here. Execute a BUY (Long) upon confirmed H1/M30 candle reversal signals.
2. DEEPER STRATEGIC BUY:
Zone: 4,145.676 (Our major Order BUY zone).
Zone 2: 4124 - 4120 (Fibo Extension Buy Zone).
Action: If the first zone fails, be ready to load up at these deeper accumulation points.
3. TAKE PROFIT TARGET:
Target: 4264 - 4268 (The Fibo Extension Sell Zone).
AD Note: Sells are only for quick scalps; we wait for the major Fibo reaction at 426x.
⚠️ Immediate Focus: WAIT for the 419x retest. Discipline is key to catching this trend continuation!

Gold Pulls Back From All-Time High – Correction Looks Limited📊 Market Overview
Gold slightly corrected from its all-time high near $4,239, showing early signs of a short-term pullback, but the overall trend remains bullish.
Despite the correction, fundamental sentiment still supports Gold:
💬 US–China trade tensions and geopolitical risks continue to fuel demand for safe-haven assets.
💵 The US Dollar remains under pressure amid expectations of a Federal Reserve rate cut later this year.
⚖️ Ongoing concerns about a possible US government shutdown further enhance Gold’s attractiveness.
These factors suggest that the current dip is likely a healthy correction within a strong uptrend, not a reversal.
🧠 Technical Structure (MMFLOW Wave View)
Gold has likely completed a minor Wave (V) on the M30 chart, forming a new ATH Zone near 4,239.
Currently, price is unfolding a corrective A–B–C pattern, expected to find support at key liquidity zones before resuming the uptrend.
Our model highlights two potential BUY setups and a short-term SELL scalp opportunity for today’s trading session.
🔑 Key Levels to Watch
🔵 BUY Setup 1
Zone: 4,184 – 4,182
SL: 4,178
TP: 4,188 – 4,192 – 4,196 – 4,200 – 4,210 – 4,220 – ???
🟢 BUY Setup 2 (Deeper Retrace)
Zone: 4,148 – 4,146
SL: 4,140
TP: 4,152 – 4,156 – 4,160 – 4,170 – 4,180 – 4,190 – 4,200
🔴 SELL SCALP Opportunity
Zone: 4,230 – 4,234
SL: 4,238
TP: 4,220 – 4,215 – 4,210 – 4,200 – 4,190 – ???
⚙️ MMFLOW Trading View
📈 Price is currently respecting Wave (A) of the correction.
We expect a possible (B) retracement toward 4,220 – 4,230, followed by (C) decline completing near 4,147 – 4,150 (Fibo 0.618 / CP Buy Zone).
From there, Smart Money may re-enter long positions targeting a fresh liquidity sweep toward the 4,285 SELL ZONE.
In short:
The uptrend remains intact, only a short-term correction is unfolding.
Patience is key — best opportunities will likely appear around 4,150 – 4,180 range.
The structure aligns perfectly with both technical confluence (Elliott + Liquidity Zones) and macro sentiment.
If the market holds above 4,140, Gold could aim for new highs toward 4,285 – 4,300 in the next few sessions.
However, traders should:
✅ Always use Stop Loss — volatility is high near record highs.
✅ Avoid overtrading in narrow pullback zones.
✅ Focus on reaction at key liquidity levels before entering.
⚡️ Summary
Gold remains technically bullish with limited downside correction.
Watch for price reaction around 4,184 and 4,147 — both zones represent strong liquidity areas where Smart Money may look to buy again.
After completing this correction, a new impulsive leg up toward 4,285+ could unfold, potentially marking the next all-time high.

XAUUSD – Safe-Haven Flows Continue to Support GoldMarket Context:
Gold has attracted strong buying for the fourth consecutive session, supported by a mix of global risk factors: renewed US–China trade tensions, rising geopolitical uncertainty, and growing fears of a prolonged US government shutdown.
Meanwhile, dovish expectations from the Federal Reserve are keeping the USD under pressure — further enhancing the appeal of gold as a non-yielding safe-haven asset.
During the Asian session, XAU/USD printed a fresh all-time high, with bulls now eyeing a potential extension toward the 4,200 USD/oz region amid escalating global concerns.
Technical Outlook (M30):
Gold continues to respect its ascending channel structure, maintaining dynamic support between 4,167 – 4,154.
As long as price holds above 4,139, the broader trend remains bullish, with the next liquidity target sitting at 4,240 – 4,241.
Key Zones to Watch:
Liquidity Sell Zone: 4,240 – 4,242
ATH Zone / Short-Term Resistance: 4,190 – 4,200
OBS Buy Zone – CP Trendline Support: 4,141 – 4,139
Secondary Buy Zone: 4,114 – 4,112
Trading Plan:
🔹 BUY Zone
Entry: 4.141 – 4.139
SL: 4.134
TP: 4.145 → 4.150 → 4.155 → 4.160 → 4.170 → 4.180
🔹 BUY Zone
Entry: 4.114 – 4.112
SL: 4.106
TP: 4.120 → 4.125 → 4.130 → 4.140 → 4.150
🔹 SELL Zone (Scalp Reaction)
Entry: 4.240 – 4.242
SL: 4.248
TP: 4.235 → 4.230 → 4.225 → 4.220 → 4.210 → 4.200
Summary:
The bullish market structure remains intact as long as price holds above the 4,139 zone.
Watch for potential long opportunities from 4,141 – 4,139, where the confluence of trendline and order block support could trigger fresh demand.
Bulls remain in control, targeting the 4,240 – 4,241 liquidity area in the coming sessions.
📊 What’s your take — will gold break above 4,200 or pause for a correction first?
👉 Follow MMFLOW TRADING for daily market structure insights and institutional-style setups.
🟣 Chart: XAUUSD M30 – Smart Money Flow structure highlighting liquidity pools, CP confluence and key buy/sell zones.
