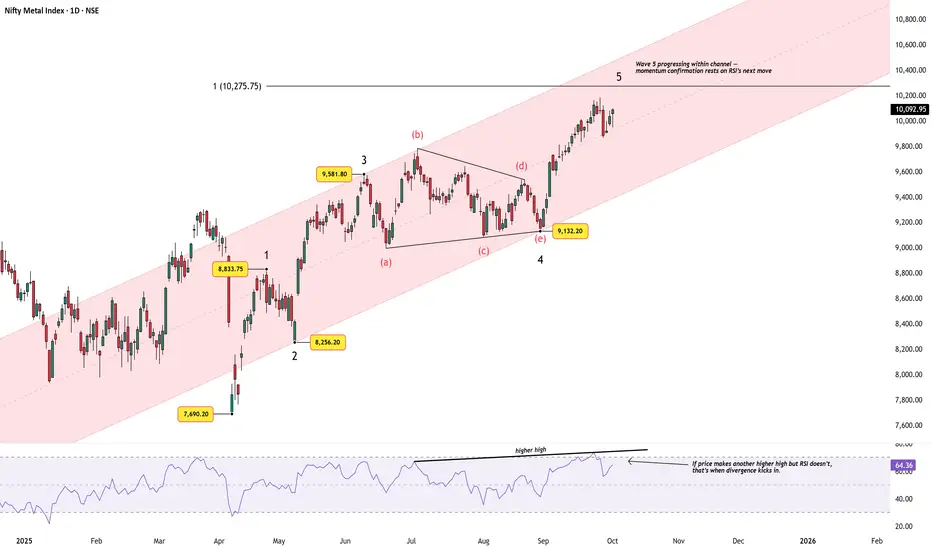
Nifty Metal Index – Fifth Wave Progression Within ChannelChart Structure:
The Nifty Metal Index continues to respect its rising channel, now advancing in Wave 5 after a clean contracting triangle in Wave 4. The impulse structure remains intact, with price steadily hugging the channel’s midline and now stretching toward the upper half.
Elliott Wave View:
Wave 1 topped near 8,833.75, after a strong rally from 7,690.20.
Wave 2 retraced into 8,256.20, holding close to the 0.382 retracement of Wave 1.
Wave 3 extended sharply to 9,581.80.
Wave 4 unfolded as a clean contracting triangle (a–b–c–d–e), ending at 9,132.20.
Wave 5 is currently progressing within the channel, with price advancing to 10,275.75, towards the 1.0x Fib extension level of Wave 1 projected from Wave 2.
Momentum Check:
RSI has confirmed the latest higher high, keeping momentum aligned with price. The key to watch now: If price makes another higher high but RSI fails to do so, that’s when bearish divergence would emerge.
Summary:
The index maintains a constructive Elliott Wave structure, but we are in late-wave territory. The channel provides a natural guide — holding the midline favors further upside, while a sustained breach of the lower channel would warn that Wave 5 has matured.
Disclaimer: This analysis is for educational purposes only and does not constitute investment advice. Please do your own research (DYOR) before making any trading decisions.
Fibonacci
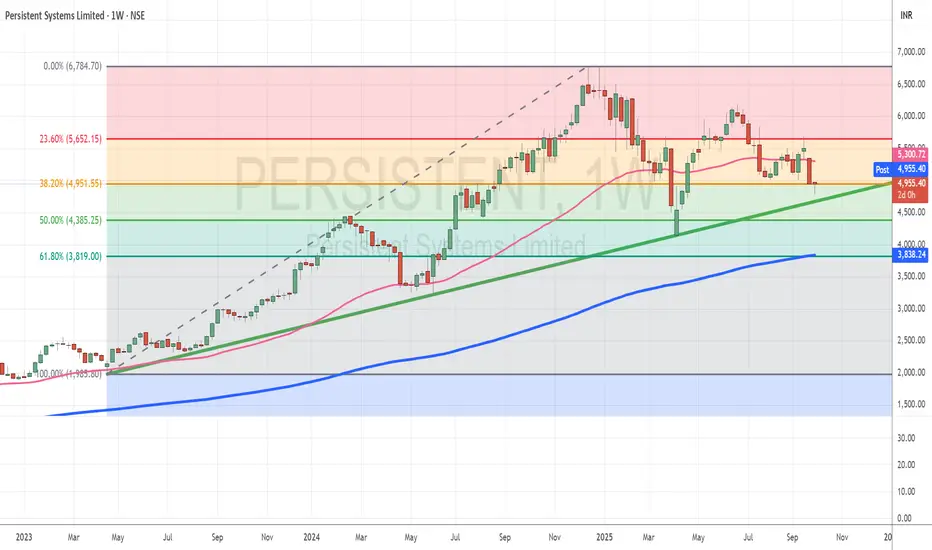
Persistent hovers near support after volatile swingsTopic Statement:
Persistent has seen a roller coaster price action this year and is now stabilizing near key technical and psychological support zones.
Key Points:
1. The stock is taking support at the 38.2% Fibonacci retracement level at 4951, a level it continues to hold
2. This support zone aligns with the barrier of 5000, reducing the likelihood of a breakdown
3. The price is also very close to a long-term trendline, adding structural strength to the current support
4. Currently trading below the 50-day EMA, the stock offers a strong investment opportunity at these levels based on past behavior
XAUUSD – Gold Smashes to New ATH: Bulls in Full Control📊 Market Overview
Gold has surged into uncharted territory, breaking through to a fresh All-Time High (ATH). The earlier dip toward 3,800 USD acted as nothing more than a springboard, allowing buyers to reload before launching this powerful breakout.
Safe-haven demand continues to fuel the rally, as concerns over a potential US government shutdown and expectations of more Fed rate cuts strengthen bullish momentum.
📍 Crucial Levels to Watch
🔴 SELL Reaction Zone
3,911 – 3,915 (Liquidity Resistance) → Potential short-term ceiling, profit-taking may appear here.
🟢 BUY Reaction Zones
3,830 – 3,820 (Fibo Support) → First pullback level for intraday buyers.
3,808 – 3,810 → Secondary support zone for a deeper correction.
3,747 – 3,752 (Liquidity BUY Zone) → Stronger base for swing buyers.
🎯 Trading Setups
1️⃣ Buy the Dip (Primary Play)
Entry: 3,830 – 3,820, confirmation needed.
Targets: 3,900 → 3,915, extend toward 3,950+ if momentum remains strong.
Stop: Below 3,808.
2️⃣ Sell the Spike (Countertrend)
Entry: 3,911 – 3,915, only on visible rejection.
Targets: 3,871 → 3,830.
Stop: Above 3,922.
3️⃣ Swing Buy Opportunity
Entry: 3,752 – 3,747 (Fibo confluence).
Targets: 3,830 → 3,900.
Stop: Below 3,735.
⚡ Pro Tips
Trend bias = Strongly Bullish, prioritize long setups.
Countertrend shorts are tactical; keep stops tight.
Headlines from the US political scene and Fed could trigger extra volatility at highs.
💬 Discussion
Will gold extend to 3,950 – 4,000 USD, or is a sharp pullback around the corner? Drop your views and charts below 👇

US Government Shutdown, Gold Benefits & FOMO BUY Continues📊 Market Context The gold market kicks off Q4/2025 with great enthusiasm as safe-haven flows continue to surge.
Not only that, the potential delay of the NFP employment report this week further fuels the market's "thirst" for directional information, positioning gold as the central asset in everyone's sights. Meanwhile, the USD is under pressure from political uncertainties and expectations that the Fed is moving closer to further rate cuts.
Combined, the current picture shows that gold is not only maintaining its strength after a breakout rally but also has the opportunity to expand and conquer new high price territories, as safe-haven capital and FOMO momentum from the BUY side continue to amplify.
🔎 Technical Analysis (H1/H4)
The price maintains the main upward trend, staying above the support structure.
Important BUY ZONE: 3833–3831 (Fibo + CP zone) – this area is likely to react strongly.
Secondary BUY ZONE: 3817–3815 (OBS zone) – stronger support, suitable for accumulating additional BUY orders.
Resistance area 3919–3923 (Liquidity Sell Zone) may be where liquidity traps appear.
✅ BUY ZONE 1: 3833–3831
SL: 3827
TP: 3838 - 3842 - 3846 - 3850 - 3855 - 3860 - 3870 - ???
✅ BUY ZONE 2: 3817–3815
SL: 3810
TP: 3822 - 3826 - 3830 - 3835 - 3840 - 3850 - 3860 - 3870 - ???
✅ Summary Gold is directly benefiting from political instability and the delay in US economic data. The main trend remains BUY with safe-haven flows, with strategic zones at 3833–3831 and 3817–3815. The expansion target aims for 3870–3880 and beyond to 3920+ if buying momentum remains strong.

XAUUSD Daily Plan – Gold’s Pullback Before the Next Leg Higher📊 Market Overview
Gold has pulled back from its fresh record highs but the move looks more like healthy accumulation than a reversal. The 3,800 zone has acted as a strong support, absorbing selling pressure and keeping the broader bullish trend intact. Immediate rebounds confirm that buyers are still in control, preparing for the next breakout.
📍 Key Levels to Watch
🔴 SELL Reaction Zone
3,871 – 3,872 → First resistance level, possible short-term rejection.
3,915 – 3,920 (Fibo Liquidity Zone) → Stronger sell wall where profit-taking may appear.
🟢 BUY Zones
3,808 – 3,810 (Fibo 0.786 Support) → Important reaction zone for intraday buy setups.
3,747 – 3,752 (Fibo Liquidity Buy Zone) → Deep correction level, strong long-term demand area.
🎯 Trading Scenarios
1️⃣ Bullish Continuation Setup
Entry: Buy near 3,808 – 3,810 on bullish candlestick confirmation.
Targets: 3,871 → 3,900+
Stop: Below 3,795
2️⃣ Deep Pullback Opportunity
Entry: 3,747 – 3,752 if price flushes lower.
Targets: 3,808 → 3,871
Stop: Below 3,735
3️⃣ Countertrend SELL Setup
Entry: 3,915 – 3,920 only with strong rejection.
Targets: 3,871 → 3,808
Stop: Above 3,928
⚡ Trading Notes
Gold remains in a strong bullish channel – selling should only be tactical and short-term.
Watch US political headlines and end-of-month flows, as they could trigger volatility.
Stick to defined Fibo zones for best risk-to-reward setups.
💬 Community Discussion
Do you think Gold will test 3,900+ this week or will we see a deeper correction first? Share your charts and ideas below 👇

XAUUSD – Gold Daily Plan | Sharp Drop, What’s Next?Gold printed a sudden 70+ point drop from 388x to 380x, leaving traders questioning:
– Was this a big player manipulation?
– Or simply institutional profit taking?
Key reaction zones will define if Gold holds above 3800 or dives deeper.
📍 Critical Levels
🔴 SELL Reaction Zone
387x → Strong resistance where sellers may step in.
🟢 BUY Zones
3780 (Retest Breakout + Trendline) → First demand zone.
375x (Fibo Support Zone) → Strong liquidity pocket, potential reversal.
🎯 Trading Scenarios
1️⃣ SELL Idea
Entry: 387x
Targets: 3800 → 3780
SL: Above 3888
2️⃣ BUY Idea
Entry: 3780 – 375x
Targets: 3838 → 387x
SL: Below 3745
⚡ Trading Notes
High volatility expected near 3800 psychological mark.
Stick to zone trading – avoid mid-range traps.
Monitor USD strength; any spike could pressure XAU further.
💬 Discussion
Do you think Gold will break below 3800 or bounce back to test 387x? Drop your views 👇

Gold 30/09 - Safe-haven flows surge | Gold sails toward new ATH 🟡 XAU/USD – 30/09 | Captain Vincent ⚓
🔎 Captain’s Log – Context & News
US Politics : Meeting between Trump and bipartisan leaders ended without agreement → growing risk of a US government shutdown by Wednesday.
Conflict : Democrats demand concessions, Republicans fiercely oppose → wide gap remains, both sides blaming each other.
Market : Investors watch JOLTS data and speeches from 3 FED members, but political risks are the strongest catalyst for Gold.
Trend : Safe-haven flows keep pouring into Gold → increasing likelihood of testing new ATH.
⏩ Captain’s Summary : US political seas are stormy, Gold becomes the fortress of safety. The voyage toward ATH is widening.
📈 Captain’s Chart – Technical Analysis (H1)
EMA : EMA 34 (yellow) > EMA 89 (red) → bullish trend clearly dominant.
Golden Harbor (Support / Buy Zone)
Big Volume Dock: 3,827
Storm Breaker (Resistance / Sell Zone)
ATH test: 3,916 – 3,917
Market Structure : Gold broke out strongly, now trading around 3,870. Main trend remains bullish, with 3,842 – 3,827 as key anchor zones.
🎯 Captain’s Map – Trade Plan
✅ Buy (main priority)
Buy Zone 2 – Big Volume
Entry: 3,827 – 3,824
SL: 3,815
TP: 3,870 – 3,899 – 3,916
⚡ Sell (short scalp – high risk)
Sell Zone – ATH test
Entry: 3,917 – 3,920
SL: 3,925
TP: 3,899 – 3,870 – 3,856
⚓ Captain’s Note
“The Golden sails are filled by safe-haven winds, pushing the ship close to ATH. Golden Harbor 🏝️ (3,842 – 3,827) is the ideal dock for sailors to position Buys. Storm Breaker 🌊 (3,916 – 3,920) may unleash violent waves, suitable only for short Quick Boarding 🚤 scalps. If the political storm from Washington breaks out, Gold’s voyage could surpass the peak and expand its horizon.”
📢 If you find the Captain’s Log useful, don’t forget to Follow for the earliest updates.
💬 What’s your view, crew? Will Gold conquer ATH around 3,917 this week?

Gold Bulls in Control: Buy Zones Lined Up for the Breakout!📊 Market Context
Gold is trading near record highs around $3,850, heading toward its best month in 14 years. With Q3 2025 and September closing, gold has surged nearly 12% this month, driven by rising safe-haven demand amid the looming U.S. government shutdown and weaker USD sentiment.
The bullish structure remains intact, and dips continue to attract aggressive buyers.
📍 Key Trading Levels
🟢 BUY Zones
3846 – 3843 → Intraday BUY scalp zone
SL: 3836
TP: 1R → 2R → 3R → 4R (hold longer if above 389x)
3818 – 3816 → Deeper reaction BUY zone
SL: 3810
TP: 1R → 2R → 3R → 4R (limit orders can be set for extended swing positions)
🔴 SELL Reaction Zone
Around 387x → Expect heavy profit-taking and short-term pullbacks.
🎯 Trade Plan
Prioritize BUY setups only; gold remains in strong bullish momentum.
Use the 384x zone for scalps and 381x zone for deeper limit buys.
Trail stops once price breaks 389x, opening room for 3920+ targets.
⚡ Trading Notes
Volatility may spike with U.S. political risks – manage positions carefully.
Avoid chasing highs; wait for structured retracements to BUY zones.
Stick to R/R discipline; market rewards patience in strong trends.
💬 Community Insight
Do you think gold will smash through 3920+ this week, or will we get another retracement first? Drop your setups and let’s compare strategies 👇

H1 bullish momentum intact | Buy 3,792–3,765, target 3,821🟡 XAU/USD – 29/09/2025 | Captain Vincent ⚓
🔎 Captain’s Log – Structure & Trend
H1 continues to print consecutive BoS → bullish trend sustained.
Price broke the long-term downtrend line and surged to new highs.
EMA 34 & EMA 89 both pointing up and below price → confirming short-to-mid-term bullish momentum.
📈 Captain’s Chart – Key Zones
Storm Breaker (Sell Zone / ATH test) : 3,818 – 3,821
Golden Harbor (FVG – Buy Zone) : 3,792 – 3,779
OB Harbor 1 : 3,772 – 3,765
OB Harbor 2 (deeper) : 3,731 – 3,724
Core Idea: 3,792 – 3,765 is the main support “cushion” for trend-follow Buys; 3,818 – 3,821 is the wave edge where profit-taking may occur.
🎯 Captain’s Map – Trade Plan
✅ Golden Harbor (BUY – main priority)
Buy Zone 1 – FVG (3,792 – 3,779)
Entry: 3,792 – 3,779
SL: 3,765
TP: 3,805 – 3,818 – 3,821+
Buy Zone 2 – OB1 (3,772 – 3,765)
Entry: 3,772 – 3,765
SL: 3,758 (below 3,765)
TP: 3,792 – 3,805 – 3,818 – 3,821
Buy Zone 3 – OB2 deep (3,731 – 3,724)
Entry: 3,731 – 3,724
SL: 3,714
TP: 3,745 – 3,765 – 3,792 – 3,805
⚡ Quick Boarding (SELL – scalp only)
Sell Zone – Storm Breaker (3,818 – 3,821)
Entry: 3,818 – 3,821
SL: 3,828
TP: 3,805 – 3,796 – 3,792
Breakdown Short (conditional)
Only consider Short if H1 closes below 3,724
SL: 3,735
TP: 3,710 – 3,700 – 3,690
⚓ Captain’s Note
“The Golden sails remain filled after consecutive BoS . Golden Harbor 🏝️ (3,792 → 3,765) is the anchor dock to board in trend’s direction. Storm Breaker 🌊 (3,818 – 3,821) may trigger profit-taking waves – only go Quick Boarding 🚤 if clear signals appear. If the tide drags below 3,724, let the ship retreat to OB2 to gather strength before resuming the northbound voyage.”

XAUUSD – Gold Bulls Eye New Highs | Francis FiboMatrix Plan📊 Market Outlook
Gold keeps climbing with momentum, now approaching the 3,800$ zone. The market is fuelled by expectations of more Fed rate cuts and rising demand for safe-haven assets as global uncertainties stay elevated.
Silver is also breaking higher, heading toward its historic $50 target, confirming the broader strength in precious metals.
📍 Trading Levels
✅ BUY Zone: 3782 – 3780
🛑 Stop Loss: 3772
🎯 Take Profits:
TP1 → 3800
TP2 → 3829
TP3 → 3848
TP4 → 3885+ (long-term hold if 377x holds support)
⚡ Trading Plan
Only look for BUY setups on dips – no shorting in this phase.
Keep position sizing balanced; trail stops once price moves past 3829.
Bias remains bullish as long as gold holds above 377x support.
💡 Francis Note
This is not just a trade – it’s part of the bigger wave. Play the retracements smart, respect risk, and let the trend do the heavy lifting.
💬 Your View?
Is gold ready to break beyond 3,885 → 3,900, or will we get a quick pullback first? Drop your charts and setups below 👇

New ATH Above 3800 & FOMO Buying Still Driving the Market📊 Market Context
Gold has once again set a new all-time high above 3800 USD/oz, showing no signs of losing bullish momentum. The surge is fueled by strong FOMO buying flows, as traders continue to pile into safe-haven assets.
Concerns about a possible US government shutdown and renewed discussions around tariff policies have weighed on the dollar, while expectations of upcoming Fed rate cuts keep gold supported. Meanwhile, Fed speeches and incoming US data remain key drivers that could inject short-term volatility, but the broader bullish narrative remains intact.
🔎 Technical Analysis (H1/H4)
Price is firmly holding above the 3800 psychological level, confirming the breakout.
Buy zones remain intact at 3790–3792 and 3784–3782, with solid demand expected on any dip.
Sell liquidity sits around 3823–3825, where short-term profit-taking or traps may emerge before the next leg higher.
🔑 Key Levels
Resistance / Sell Zone: 3823–3825
Support / Buy Zones: 3790–3792, 3784–3782
📈 Scenarios & Trading Plan
BUY ZONE 1: 3790–3792
SL: 3786
TP: 3795 - 3800 - 3810 - 3820 - 3830 - ???
BUY ZONE 2: 3784–3782
SL: 3778
TP: 3790 - 3795 - 3800 - 3810 - 3820 - 3830 - 3840 - ???
SELL ZONE (Liquidity Trap Zone): 3823–3825
SL: 3830
TP: 3818 - 3814 - 3810 - 3805 - 3800 - ???
⚠️ Risk Notes
Beware of liquidity sweeps near 3823–3825 before continuation higher.
Fed comments and macro data may cause sudden spikes — adjust risk accordingly.
Stick to confirmation entries around zones to avoid being trapped by false moves.
✅ Summary
Gold is riding strong FOMO-driven bullish momentum, printing new highs above 3800. Main bias: buy on dips at 3790–3782, while monitoring short-term sell liquidity at 3823–3825 for potential pullbacks. The broader trend remains bullish, so patience and disciplined entries will be key.

Gold awaits PCE | EMA squeeze, big waves ahead🟡 XAU/USD – 26/09 | Captain Vincent ⚓
🔎 Captain’s Log – Context & News
Trump : Announced a 100% tariff on branded drugs if not produced in the US → escalating trade tensions.
PCE tonight : The FED’s most important inflation gauge, key to shaping October rate cut expectations (current probability 91.09%).
The market is in “hold breath” mode, awaiting the PCE spark to decide the next direction.
⏩ Captain’s Summary : Gold is squeezed between two winds – short-term EMA pressure and major expectations from PCE.
📈 Captain’s Chart – Technical Analysis
EMA : EMA 34 (yellow) remains below EMA 89 (red) → short-term bearish pressure persists, but narrowing gap signals big volatility ahead.
Golden Harbor (Support / Buy Zone)
3,738 – 3,730
3,718
3,687
3,651
Storm Breaker (Resistance / Sell Zone)
3,755 – 3,773
🎯 Captain’s Map – Trade Plan
⚡ Sell (scalp at resistance)
Entry: 3,773 – 3,776
SL: 3,783
TP: 3,755 – 3,745 – 3,734
✅ Buy (trend-follow priority)
Buy Zone 1 (Scalping)
Entry: 3,72x – 3,718
SL: 3,710
TP: 3,750 – 3,769 – 3,776
Buy Zone 2 (Deeper OB)
Entry: 3,685 – 3,683
SL: 3,675
TP: 3,690 – 3,695 – 3,700 – 3,705 – 3,7xx
⚓ Captain’s Note
“The Golden sails are being squeezed between EMA 34 & 89. Golden Harbor 🏝️ (3,734 – 3,683) remains the safe dock for sailors to await the big wave. Storm Breaker 🌊 (3,773 – 3,776) is raising fierce waves, only suitable for short Quick Boarding 🚤 scalps. Tonight’s PCE will be the decisive wind – either pushing the ship beyond 3,78x or forcing it back to retest 3,72x.”
📢 If you find Captain’s Log useful, don’t forget to Follow for the latest updates.
💬 What do you think? Will Gold break through 3,78x or retest 3,72x first?

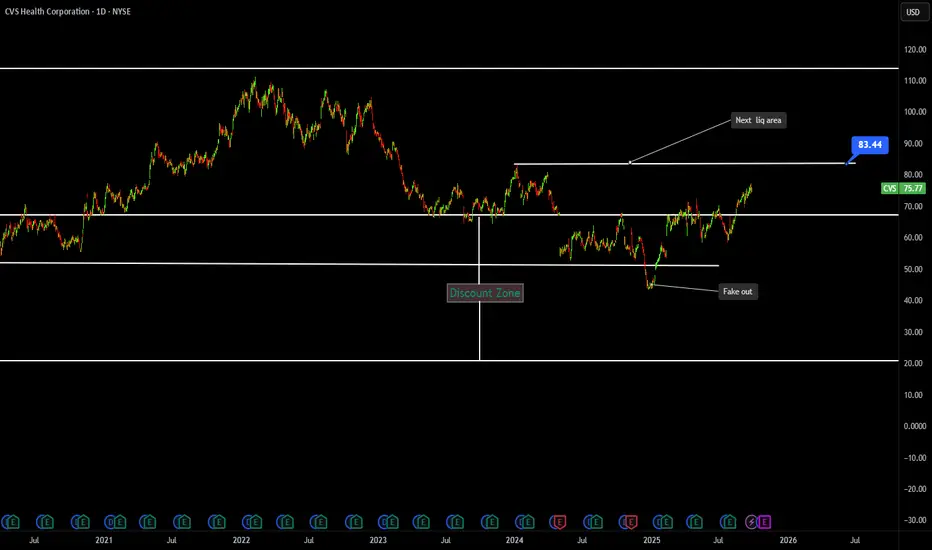
CVS HEALTH TECHNICAL ANALYSISPrice recently bounced from the discount zone around $50 after a fakeout breakdown, showing demand absorption.
The stock has reclaimed the $70 support area and is now trading at $75.77, confirming strength.
The next major resistance and liquidity area is around $83.44, which could act as the next upside target.
If price sustains above $70, the trend bias remains bullish toward the $83–85 zone.
A breakdown below $70 would weaken the structure, possibly retesting $60–62.
Cipla stays sideways as global policy risks loomTopic Statement:
Cipla has remained stuck in a sideways range for months, with potential downside pressure emerging from shifting global policies.
Key Points:
1. The stock has been hovering around the 23.6% Fibonacci retracement level at 1502, influenced by both national and global economic factors
2. Price is currently sitting on the 50-day EMA, offering short-term directional ambiguity
3. The stock may follow the drawn trend line, which could guide its next movement depending on policy and market developments

SBI BANK |Neowave AnalysisNamaskaram Everyone
I trade using Neowave and on that I have created an trading setup, which is kind of automatic entry and exit with Neowave.
Neowave is kind of a method in which you synchronize all the price action across all the time frames. It hides all the noise and tells you market is bullish or bearish.
About Stock
This is not a trading idea, it would have been if updated few weeks back. Just a neowave counts update for some one who is already holding the stock.
Stock already started its rally in correction, if you get some retracement than buy it.
For coding style read the below post
If you have the stock than hold it and trail it as the counts proceed in future.
Like and share is appreciated.
Thank You
To understand how our coding works read the below post-
NSE:SBIN

Asian Paints struggles to recover, trades near oversold zoneTopic Statement:
Asian Paints has shown a weak recovery from its recent correction and suffered further downside in Friday’s market drop, now hovering in deeply oversold territory.
Key Points:
1. The stock continues to receive strong support at the 61.8% Fibonacci retracement level
2. Price is currently trading below both the 50 and 200-day EMAs, signaling an oversold condition and a strong long-term buying opportunity
3. It is moving within a short-term mildly bullish channel, though the momentum remains subdued compared to broader market trends

XAUUSD – FIBO MATRIX Trading Plan | Key Levels for TodayMarket Snapshot
Gold is attracting steady buying interest as dovish Fed expectations keep the USD capped near 3-week highs.
At the same time, geopolitical tensions and tariff concerns add to safe-haven demand.
Focus now shifts to US PCE inflation data, which could trigger the next big move.
📍 Important Price Zones (M30)
🔴 SELL Reaction Zones
3767 – 377x → Major rejection area (Fibo 0.786).
3810 – 3817 → Strong SELL zone (Fibo 1.5 – 1.618).
🟢 BUY Support Zones
3725 → First support zone.
3690 – 3695 → Deep pullback support (Fibo confluence).
🎯 Trading Ideas
1️⃣ SELL Setup
Entry: 3767 – 377x (if rejection signal shows).
Targets: 3750 → 3725.
SL: Above 3778.
2️⃣ BUY Setup
Entry: 3725 with bullish confirmation.
Targets: 3760 → 377x.
SL: Below 3715.
3️⃣ Deep BUY Opportunity
Entry: 3690 – 3695 zone.
Targets: 3725 → 3760.
SL: Below 3685.
⚡ Trading Insights
Respect the Fibo reaction levels for clean entries.
Risk range: 6–8 USD to avoid stop hunts.
Book profits in steps: 1R → 2R → 3R for strong RR balance.
💬 Community Talk
Do you see gold breaking above 3770 first, or dropping to 3725/3695 before bouncing back? Share your chart view 👇

XAUUSD – Trading Plan: Gold Awaits PCE Catalyst📊 Market Context
Gold remains in consolidation mode after a sharp run earlier this week, holding steady below 3750. The market is now laser-focused on the US Core PCE Index, which could provide fresh direction for both the dollar and precious metals. With US yields stabilising and risk sentiment shifting, gold’s safe-haven appeal remains intact — but traders are weighing whether the recent pullback is a healthy correction or the start of a deeper retracement.
Meanwhile, the geopolitical backdrop continues to offer underlying support, while positioning in ETFs and futures suggests investors are cautious, awaiting clearer signals from the Fed. The upcoming data will likely decide whether gold breaks higher towards fresh highs or retests deeper liquidity zones.
🔎 Technical Analysis (H1/H4)
Price capped near short-term resistance at 3770–3772.
Immediate supports are 3741 and 3722, with deeper demand zones at 3690–3688 and 3670–3668.
The structure indicates possible liquidity sweeps before a decisive move.
🔑 Key Levels
Resistance / Sell Zone: 3770–3772
Support / Buy Zones: 3690–3688, 3670–3668
📈 Scenarios & Trading Plan
BUY ZONE 1: 3690–3688
SL: 3684
TP: 3695 - 3700 - 3710 - 3720 - 3730 - ???
BUY ZONE 2: 3670–3668
SL: 3664
TP: 3675 - 3680 - 3690 - 3700 - 3710 - ???
SELL ZONE: 3770–3772
SL: 3777
TP: 3765 - 3760 - 3750 - 3740 - ???
⚠️ Risk Notes
Watch for false breakouts at 3770–3772 before reversal.
PCE release may inject volatility across gold and USD pairs.
Position sizing and risk control are crucial into data.
✅ Summary
Gold is at a crossroads — safe-haven demand is still supportive, but technical resistance near 3770 remains a hurdle. Core strategy: buy dips into 3690–3670 zones, while staying cautious of short-term sell setups at 3770–3772. Manage exposure, wait for confirmation, and be prepared for volatility once PCE data hits.
📢 Follow MMFLOW TRADING for real-time updates and next-level trade setups.

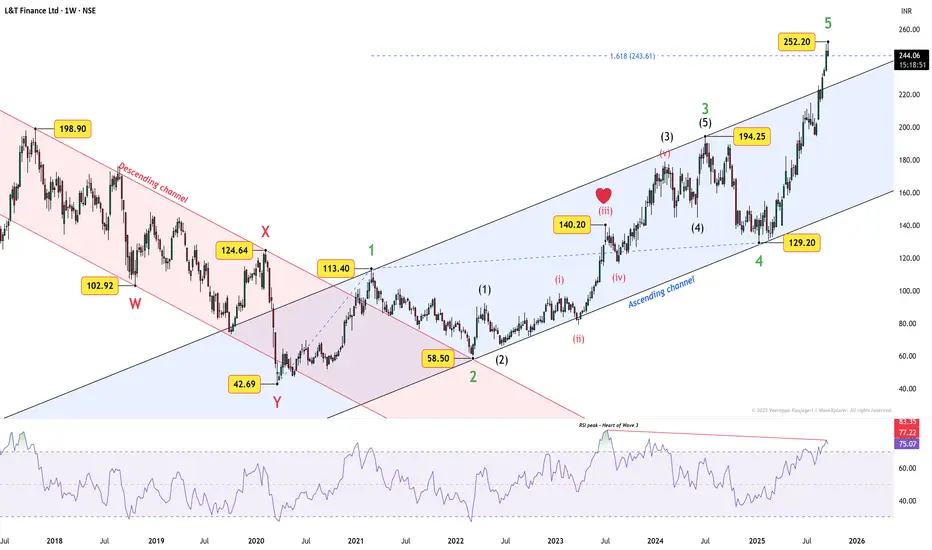
L&T Finance – Story of Two Channels and the Heart of Wave 3The chart of L&T Finance tells a neat Elliott Wave story through channels and Fibonacci.
First, notice the two channels. The old descending channel captured the corrective W-X-Y down to ₹42.69. From there, price shifted into an ascending channel .
Look how cleanly price respected this structure:
Green Wave 1 kissed the upper line of the ascending channel.
Green Wave 2 bottomed at ₹58.50 — right at the intersection of both channels.
Green Wave 3 again touched the channel’s upper line, marking its high with precision.
Green Wave 4 rested at the lower line of the channel.
Within Wave 3, the strongest push came at ₹140.20 — the famous heart of Wave 3 (what traders call the 3-of-3-of-3). RSI also peaked there, confirming it as the most powerful thrust of the sequence.
Now, price has surged into Green Wave 5 , reaching ₹252.20 , which is already above the 1.618 Fibonacci extension. It could extend higher, but RSI is diverging — momentum is not confirming the new highs.
That makes me cautious. While my view is leaning bearish, I don’t want to chase the upside here. Confirmation will come only if price falls back inside the ascending channel . Once that happens, I’ll update bearish targets based on fresh price action.
For now, the chart has delivered a textbook lesson: two channels, a Fibonacci story, and the heart of Wave 3 flashing exactly where it should.
Disclaimer: This analysis is for educational purposes only and does not constitute investment advice. Please do your own research (DYOR) before making any trading decisions.
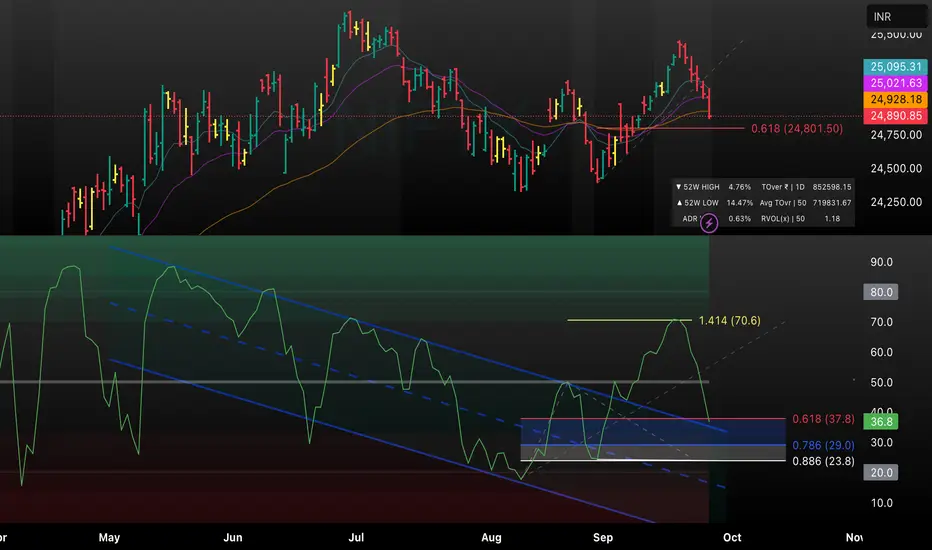
Will Fibonacci Levels Hold? Key Areas to WatchThis chart combines price action with key Fibonacci retracement and extension levels to anticipate potential support or reversal zones. Price is currently testing the crucial 0.618 retracement (24,801.50) after a notable downward move. RSI is also reacting near its own significant levels, aligning with both 0.618 on the downside (37.8) and the 1.414 extension (70.6) on the upside. Watch for reactions at these levels for clues on whether price will bounce or continue to the next fib zone, especially with momentum indicators confirming support/resistance confluence.
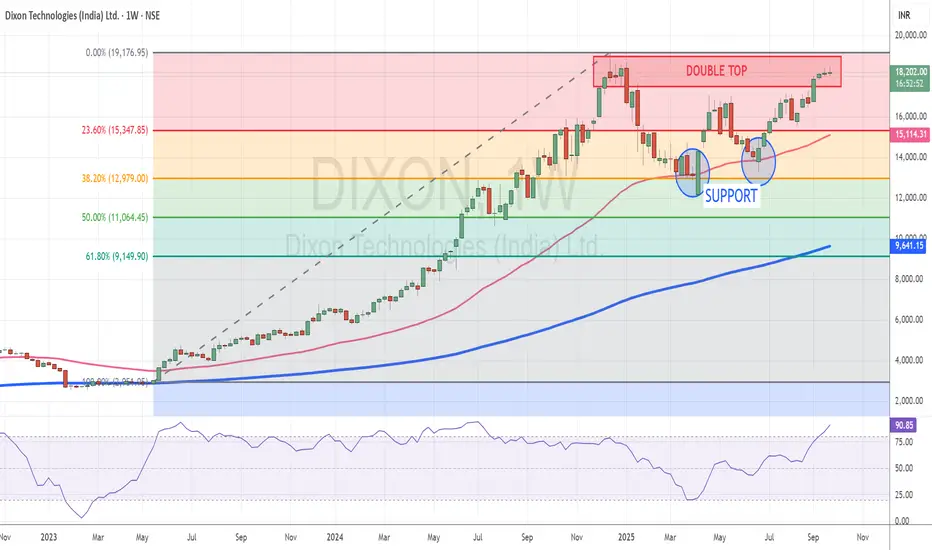
Dixon nears lifetime high after sharp recoveryTopic Statement:
Dixon has rebounded strongly in line with the broader market rally but now approaches critical resistance levels that may cap further upside.
Key Points:
1. The stock retraced to the 38.2% Fibonacci level where it found strong support and resumed its upward move
2. The 50-day EMA acted as a deflection point, offering additional support during the recovery
3. Price is now at its lifetime high near the 18,000 mark, where a double top candlestick pattern is forming
4. The double top indicates significant resistance, making it a potential shorting opportunity unless a breakout confirms further bullishness
Hindustan Copper – Breakout or Double Top?After completing an impulse up to 287.65 (Wave 1) and correcting down to 226.70 (Wave 2), Hindustan Copper is now powering higher in what looks like Wave (iii) of 3.
Wave count : Wave 2 bottomed at 226.70, setting the stage for Wave 3.
Current move : Sub-waves (i) and (ii) are done, and price is pressing into resistance at 287.
Breakout zone : A decisive move above 287 could confirm the Wave 3 extension. Failure here risks a pause or even a double top.
Retracement supports : 272.75 (0.236) and 263.95 (0.382) are likely pullback zones if Wave (iv) comes into play.
Momentum check : Volume has spiked aggressively, adding weight to the bullish case, while RSI is overbought — suggesting short-term cooling is natural.
Summary : 287 is the key make-or-break zone. Break it cleanly, and Wave 3 marches forward. Fail, and we may see a corrective detour first.
Disclaimer: This analysis is for educational purposes only and does not constitute investment advice. Please do your own research (DYOR) before making any trading decisions.

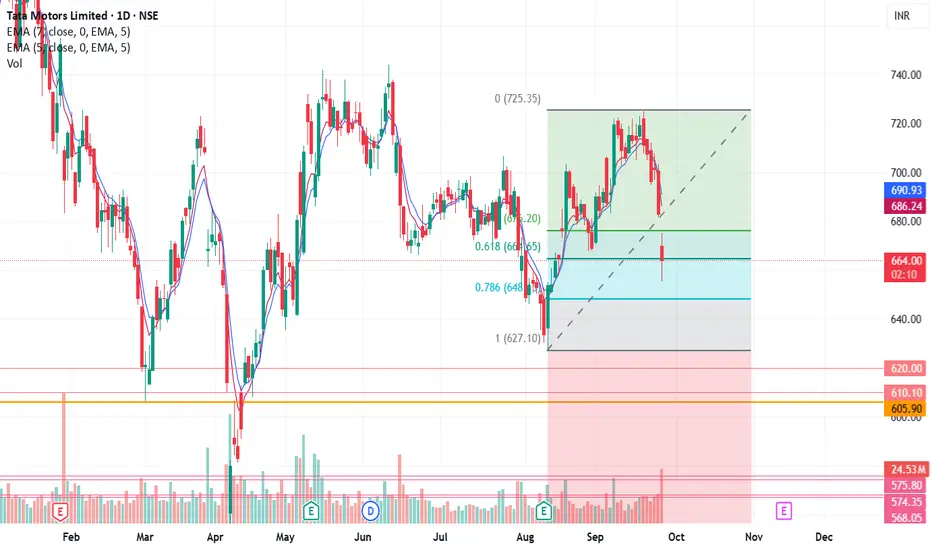
On Golden level of Fibonacci RetracementWith recent bullish momentum in the Auto industry, this looks like a good time to catch Tatamotors as it is on the Fibonacci Retracement golden level. I am bullish on this. Pinbar candle on the bottom on a daily basis gives me more confidence.