Home First FinanceThe stock is showing signs of a potential upward reversal on the weekly timeframe, supported by Fibonacci retracement levels and weekly support. On 11 August 2025, Morgan Stanley, Citigroup, and Bandhan MF bought shares via a block deal at ₹1,190.50 per share. This aligns with bulk buying by FIIs and mutual funds, suggesting a higher probability of upward movement.
Fibonacci

Gold Plan 15/08 – Captain VincentBackground
Yesterday, Gold revisited the BUY Scalp – Quick Boarding 🚤 (3332 – 3334) zone and bounced 140 pips.
This is the second consecutive day the zone has shown strong reaction, but today its support strength may weaken.
The main H1 trend is leaning bearish , so the priority is to look for sell setups at major resistance zones.
Zone 1 – Storm Gate 🚪 (Main Sell Zone – SMC Supply)
Entry: 3,355 – 3,357
SL: 3,361
TP: 3,351 → 3,347 → 3,342 → 33xx
Note: SMC Supply zone confluenced with Fibo 0.5 – 0.618. Wait for strong price reaction before entry.
Zone 2 – BUY Scalp – Quick Boarding 🚤
Entry : 3,332 – 3,334
SL: 3,327
TP: 3,336 → 3,339 → 3,342 → 33xx
Note: This zone has reacted twice in a row. Today, only use for quick scalps, avoid holding for long.
Zone 3 – Deep Harbor 🏝️ (Main Buy Zone – SMC Demand)
Entry: 3,290 – 3,292
SL : 3,284
TP: 3,296 → 3,300 → 3,304 → 33xx
Note: Deepest support of the day. Buy only if price drops sharply and clear reversal signals appear.
Today’s Scenarios
If price tests Storm Gate → Look for short-term sells in line with the downtrend.
If price breaks below BUY Scalp → Wait for a retest to sell further, as there’s a high chance of filling the previous Fair Value Gap.
If price reaches Deep Harbor → Attempt a bottom buy, but keep profit expectations short since the overall trend is bearish.
Captain’s Note:
"Today, the golden sea has strong waves and heavy winds. The captain will set sails at Storm Gate to catch the downwind move. Deep Harbor stays open, but will only anchor if the skies are clear. BUY Scalp is like a speedboat – fast, sharp, decisive." 🏴☠️📉
Captain’s Friday Warning ⚠️
"It’s Friday – the wildest day of the week. Trade carefully, manage capital tightly, and protect your treasure chest. The weekend is long; don’t let one impulsive move sink the ship." ⛵💰

Gold Plan 14/08 – Captain VincentGold Plan 14/08 – Captain Vincent ⚓
Background
Yesterday, Gold touched the Sell Scalp zone and cruised smoothly for 220 pips 🎯.
However, it failed to break the previous Buy Zone and is now maintaining a bullish structure on the H1 chart, with higher lows forming.
Today, the market may move slower as traders await the US PPI data , so each entry point must be taken with caution.
Zone 1 – Golden Harbor 🏝️ (Main Buy Zone – SMC Demand)
Entry: 3,334 – 3,332
SL: 3,327
TP: 3,338 → 3,342 → 3,346 → 33xx
Note: This is the main buy zone, aligned with the SMC Demand Zone. Enter only if there’s a clear reversal signal (Pin Bar / Engulfing) on M15/H1.
Zone 2 – Storm Breaker 🌊 (Sell Zone – SMC Supply)
Entry: 3,398 – 3,400
SL: 3,407
TP: 3,394 → 3,390 → 3,386 → 33xx
Note: Strong sell zone. Watch price reaction before entry. Prefer partial profit-taking along the way.
Today’s Scenarios
If price tests Golden Harbor → Wait for pin bar or engulfing, then Buy in line with the uptrend.
If price approaches Storm Breaker → Look for short-term sell setups on reversal signals.
If price stays in the mid-range → Stay on the shore, save energy for the golden moment.
Captain’s Note:
"Today, the golden sea still rides the bullish tide, but the PPI winds may shift without warning. Keep the helm steady, and anchor only at safe harbors." 🏴☠️📈

NSDLPrice is coming back to fill a small gap @ 1125.
From recent high to low, fib levels indicates a pullback at 0.5level - 1150,
Buy in the range of 1125-1150 for targets of 1400 & 1800

Gold Plan 13/08 – Captain VincentGold Plan 13/08 – Captain Vincent ⚓
News Background
📊 Gold is holding steady near $3,350/oz after the US July CPI release.
Headline CPI : 2.7% (below forecast of 2.8%) 📉
Core CPI: 3.1% (up from 2.9%) 📈
➡ This cools down inflation fears from tariffs and increases the probability of a 25 bps Fed rate cut in September , which is bullish for Gold.
Key factors to watch:
💼 Market awaiting more data: PPI, jobless claims, retail sales.
🔍 Tariff drama: Trump says no tariffs, but US Customs just listed 1kg & 100oz gold bars under taxable imports.
🌐 US extends the trade truce with China for another 90 days.
🕊 US–Russia talks on Ukraine scheduled for 15 Aug in Alaska.
News conclusion:
Lower-than-expected CPI + higher Fed cut chances = Gold remains positive.
But tariff and geopolitical risks must be tracked closely.
Yesterday’s Action (12/08)
Gold tapped the Buy Scalp – Quick Boarding 🚤 zone and bounced ~290 pips .
However, it failed to break decisively above the zone and moved sideways around support.
Technical Plan – 13/08
1. Sell Scalp – Quick Boarding Reverse ⚓
Entry: 3,374 – 3,376
SL: 3,382
TP: 3,368 → 3,362 → 3,355 → 3,3xx
Reason: Short-term resistance, suitable for quick sell scalps when price retests higher.
2. Sell Zone – Storm Breaker 🌊
Entry: 3,405 – 3,406
SL: 3,411
TP: 3,395 → 3,385 → 3,375 → 3,365
Reason: Major resistance zone aligned with previous highs and trend channel.
Scenarios:
Price likely to rise from current sideways range to test either Sell Scalp or Storm Breaker.
Priority: Sell if reversal signals (pin bar, engulfing) appear on M15/H1 at these zones.
If price breaks above Storm Breaker and holds above 3,411 → cancel sell plan, wait for new structure.
Captain’s Note:
"The CPI wave has anchored the Gold ship near 3,350. Today, the crew is ready to set sail towards Sell Scalp and Storm Breaker, waiting for the winds to shift for a profitable turn." ⚓🌊

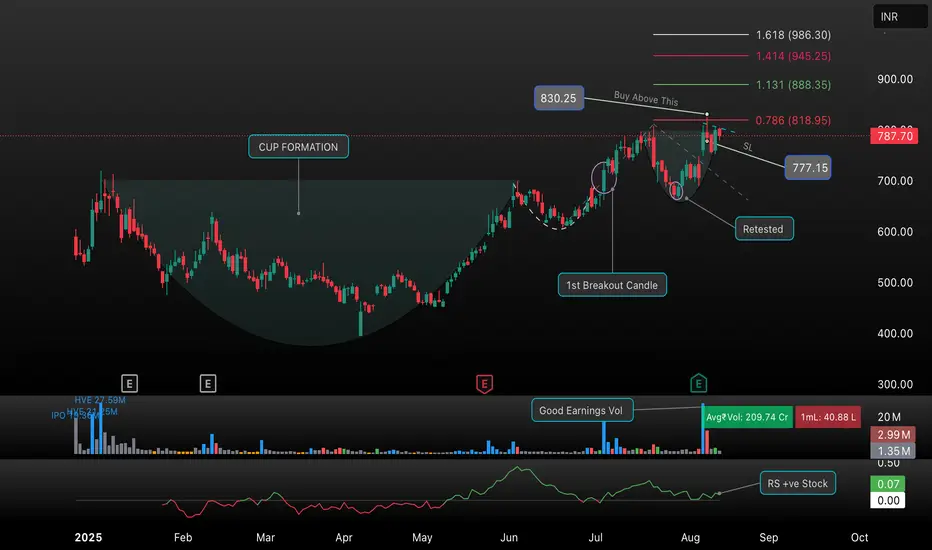
TransRail: Cup & Handle Breakout Setup | Key Levels & TargetsTransRail has recently formed a textbook cup and handle pattern, signaling a potential bullish breakout. The stock showed strong momentum after retesting the breakout zone and is currently consolidating near key resistance.
Key Points:
• Cup Formation: Evident over the past months, indicating accumulation.
• Breakout Levels: First breakout candle confirmed; price now approaching resistance at ₹830.25.
• Buy Trigger: Entry above ₹830.25 for bullish confirmation.
• Fibonacci Targets: Next potential targets at ₹888.35 (1.13 Fib), ₹945.25 (1.41 Fib), and ₹986.30 (1.618 Fib).
• Stop Loss: Maintain SL at ₹777.15 to manage risk.
• Volume: Strong earnings volume supports the setup.
Watch for sustained volume and a decisive move above resistance for confirmation. Add TransRail to your watchlist for a potential swing trade opportunity!
Paradip Phosphates Ltd (NSE: PARADEEP)Paradip Phosphates Ltd has delivered a massive 180% return in recent months, rallying sharply from its previous lows. The price has now reached the critical 0.618 Fibonacci extension level at ₹218, where some profit booking may occur.
Key levels to watch:
• Resistance: 0.786 at ₹234.90, 0.886 at ₹244.93
• Support: 0.382 at ₹176.31, 0.5 at ₹158.53, 0.618 at ₹140.74
• The price may retrace towards the 20 EMA as momentum cools off.
• Strong recent earnings momentum (+464% EPS YoY), but caution is advised in the short term after such a steep rally.
Disclaimer: This post is for learning possible,Not an investment advice. Do your own research before making any trading decisions.

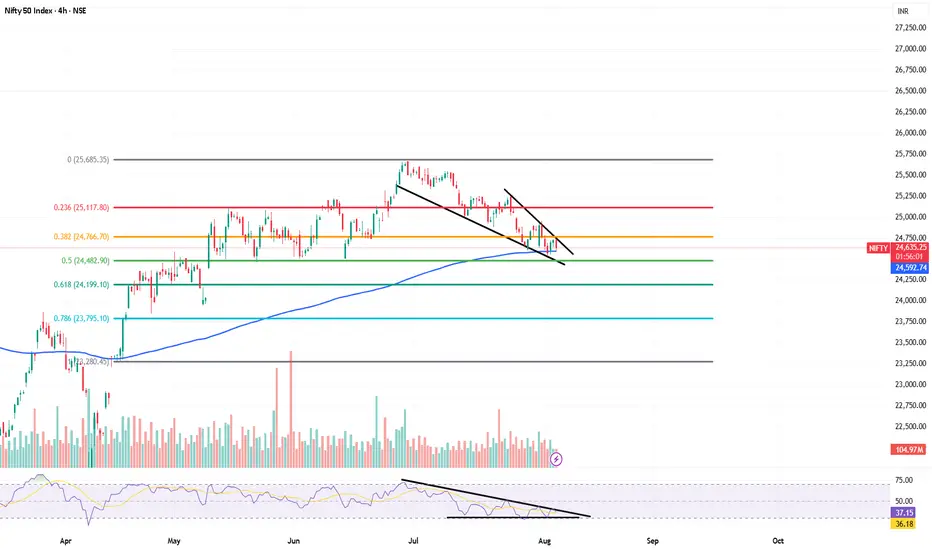
Nifty swing Pullback Failure 15mins Hello,
Nifty again bounce from previous low/support levels of 24350 to high of 24700 and pullback is failed and falled again CMP 24510 ......50SMA support and RSI adjusted from overbought also more than 50% retracement near by 61% reatrce making it good Pullback Reversal Set up for swing+postional

BTC Head & Shoulders Alert – Possible Breakdown!🚨 BTC Head & Shoulders Alert – Possible Breakdown! 🚨
Bitcoin is showing a clear Head & Shoulders pattern on the 15m chart.
Price is hovering near the $118,500 neckline, with sellers trying to push lower.
🔹 Key Levels:
Pattern: Head & Shoulders – bearish reversal setup
Breakdown Zone: Around $118,500
Immediate Support: $117,637
Major Target: $116,605 (measured move from pattern)
Invalidation: A close above $118,913 could flip bias bullish
📌 Plan:
Watch if BTC sustains below $118,500. If confirmed, bears could aim for $117,600 and then $116,600. Bulls need to reclaim $118,913 to negate the setup.
#Bitcoin #BTC #CryptoTrading #HeadAndShoulders #BTCAnalysis #PriceAction #CryptoSignals #BitcoinPrice #TradingSetup #CryptoCommunity #DayTrading #TechnicalAnalysis #CryptoMarkets

SJVNThe stock appears to be reversing from the Fibonacci retracement levels, in the aligning with the 200 EMA and 200 DMA on the weekly timeframe.

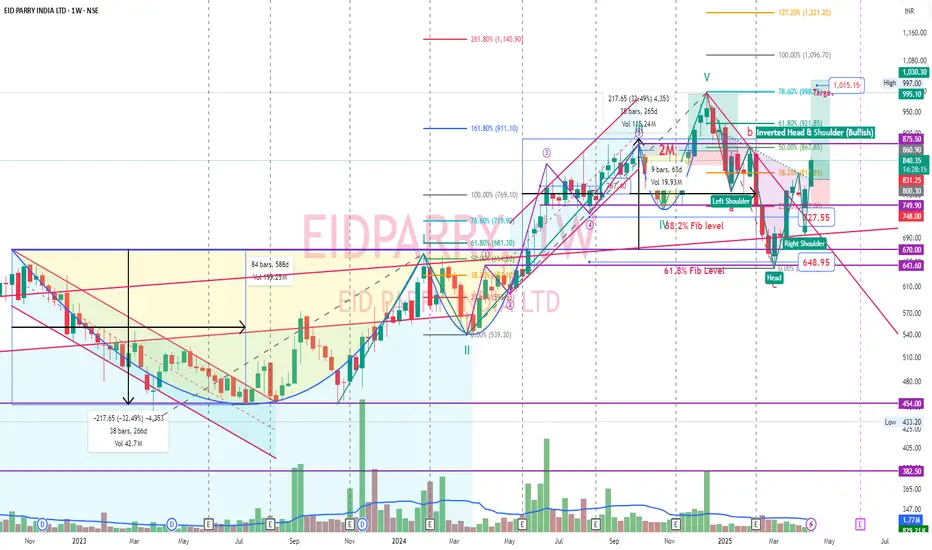
EID Parry - Inverted Head and Shoulder - BullishEID Parry is one of the top fundamental company in sugar industry. And EID parry is among the Murugappa group of companies. One should watch Murugappa group of companies. They are all very good.
Seeking to curb carbon emissions, India aims to increase the share of ethanol in gasoline to 20 percent by 2025-26, from 13 percent -14 percent now. Indian sugar mills such as E.I.D.-Parry Balrampur Chini Mills Shree Renuka Bajaj Hindusthan and Dwarikesh Sugar have increased their ethanol production capacity in the last few years.
After reaching Cup & handle target, stock just completed correction cycle and now made inverted head and shoulder bullish pattern. Head height of 230 points is the target after breakout which comes around 1015 where Pivot R3 also there in daily timeframe.
Weekly RSI has made double bottom and is looking good. MaCD is on the rise. Volume was good on breakout on Apr 15 making inverted head and shoulder bullish pattern in daily timeframe.
Custom Index - Sugar - Inverted H&SMade custom index with sugar after hitting previous targets now inverted head and shoulder in progress. Holding EID parry. Ethanol blending story plays well.
India hits 20% ethanol blending milestone in early 2025—six years ahead of the original target of 2030

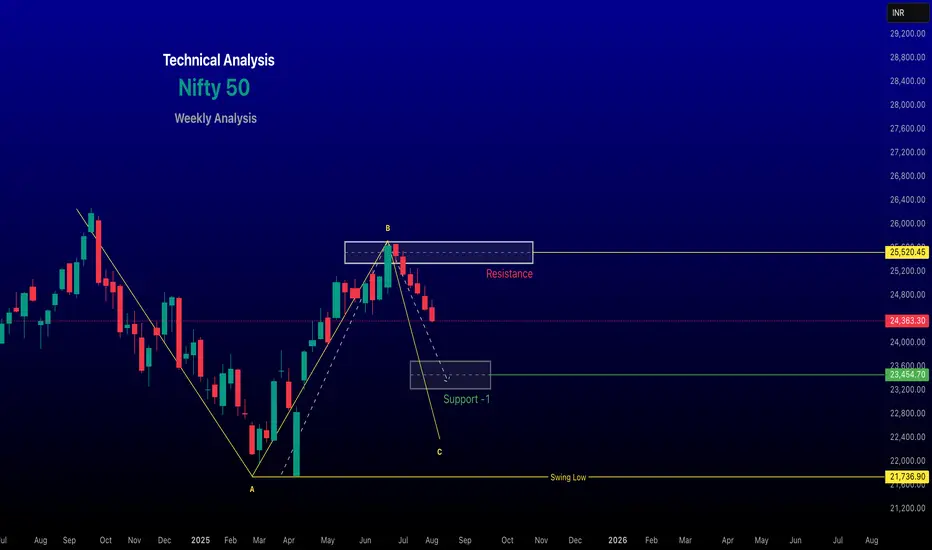
renderwithme | NIFTY-50 for the week of August 11–15, 2025The Nifty 50 index, a benchmark for the Indian stock market, is expected to exhibit cautious and potentially bearish behaviour for the week of August 11–15, 2025, based on recent market trends, technical analysis, and macroeconomic factors. Below is a detailed analysis for the upcoming week
# Current Market Context
Recent Performance: As of August 8, 2025, the Nifty 50 closed at 24,363.30, down 232.85 points (-0.95%), reflecting a bearish sentiment driven by foreign fund outflows and US-India tariff tensions. The index has been trading within a descending channel, characterised by lower highs and lower lows, indicating short-term weakness.
Technical Indicators:
Weekly Chart: A candle formed on the weekly chart, signalling market Bearish. Confirmation of this pattern could indicate further consolidation or a directional move.
Moving Averages: The Nifty is below its 21-day EMA, suggesting bearish momentum. The 5-day SMA and EMA are around 24,843.75 and 24,865.11, respectively, acting as resistance.
RSI and MACD: RSI is in the 35–40 range, indicating oversold conditions, which could signal a potential short-term bounce. MACD remains bearish, reflecting sustained selling pressure.
Pivot Levels: Key resistance is at 25,600–25,925, with immediate support at 23,250–23,400. A break below 23,200 could push the index toward its 200-day DMA (~23,900).
Market Sentiment: Sentiment is cautious due to:FII Outflows: Foreign Institutional Investors (FIIs) sold equities worth ₹4,997.19 crore on August 7, 2025, exerting downward pressure. Domestic Institutional Investors (DIIs) countered with ₹10,864.04 crore in buys, providing some support.
Global Cues: Mixed global market performance (e.g., NASDAQ down 2.24%, Dow Jones up 0.29% on August 4) and US tariff hikes on Indian imports are weighing on sentiment.
RBI Policy: The upcoming RBI policy decision could influence market direction, particularly if it addresses interest rates or liquidity measures.
Nifty 50 Forecast for Next Week (August 11–15, 2025)Based on available data, here’s the forecast for the week:Key Levels to WatchSupport Levels: 23,200, 23,500, (200-DMA). If A weekly candle break and close below 22,000 could accelerate selling toward 22,500.
Resistance Levels: 25,545–25,955. A sustained move above 25,900 could signal a potential reversal, with 26,000 as a critical psychological level.
Trend: Bearish with support at 24,200 critical. A positive global cue (e.g., GIFT Nifty up 0.36% on August 4) could support a modest recovery.
#Technical Outlook
- Bearish Scenario: If the Nifty fails to hold 23,200, it could slide toward 22,900 or lower, aligning with the 200-DMA. The inverse head-and-shoulders pattern on the weekly chart suggests a potential base at 22,900, but confirmation is pending.
- Bullish Scenario: A break above 24,600 could trigger a short-term rally toward 24,925–25,045. Sustaining above 25,000 may push the index toward 25,250, potentially signaling a trend reversal.
Indicators: Oversold RSI (35–40) suggests a possible bounce, but bearish MACD and selling volume indicate caution. Traders should monitor for a bullish crossover in MACD or RSI moving above 50 for confirmation of upward momentum.
Key Factors to WatchGlobal Markets: Movements in major indices like NASDAQ, Dow Jones, and FTSE will influence Nifty’s direction. Positive cues from GIFT Nifty (24,685 on August 4) could support a recovery.
FII/DII Activity: Continued FII selling could pressure the index, while DII buying may limit downside.
RBI Policy: Any dovish signals or liquidity measures could boost sentiment.
Sector Performance: Banking, IT, and energy sectors are critical. Stocks like SBI, Bharti Airtel, and Tata Motors may drive index movements.
Geopolitical and Tariff Issues: US-India trade tensions could cap upside potential.
Monitor volume and global cues for intraday trades.
Long-Term Investors:Current valuations near 23,200–23,400 are attractive for quality stocks. Accumulate fundamentally strong Nifty constituents (e.g., HDFC Bank, Reliance) on dips.
Use oversold conditions as an entry point for long-term portfolios, but diversify to mitigate volatility risks.
Critical PerspectiveWhile the sources provide detailed technical levels and predictions, they rely heavily on historical patterns and short-term indicators, which may not account for sudden macroeconomic shifts or black-swan events. The bearish bias is driven by FII outflows and tariff concerns, but DII support and potential RBI interventions could stabilize the market. Predictions like those from (e.g., Min: 22,200, Max: 26,240) show wide ranges, reflecting uncertainty and volatility. Investors should question overly precise forecasts and focus on broader trends, such as the index’s proximity to the 200-DMA and global market correlations.
ConclusionThe Nifty 50 is likely to remain range-bound between 23,900 and 24,925 next week, with a bearish bias unless it breaks above 24,600. Key supports at 24,200–24,000 and resistance at 24,600–25,045 will dictate short-term movements. Traders should stay cautious, monitor global cues, and prioritise risk management, while long-term investors may find opportunities in oversold conditions. Always verify critical information and consult a financial advisor before making decisions.
Chart for your Reference Only
~~ Disclaimer ~~
This analysis is based on recent technical data and market sentiment from web sources. It is for informational \ educational purposes only and not financial advice. Trading involves high risks, and past performance does not guarantee future results. Always conduct your own research or consult a SEBI-registered advisor before trading.
# Boost and comment will be highly appreciated.
CoforgeThe stock appears to be reversing from the Fibonacci retracement levels, in the aligning with the 200 EMA and 200 DMA on the weekly timeframe.

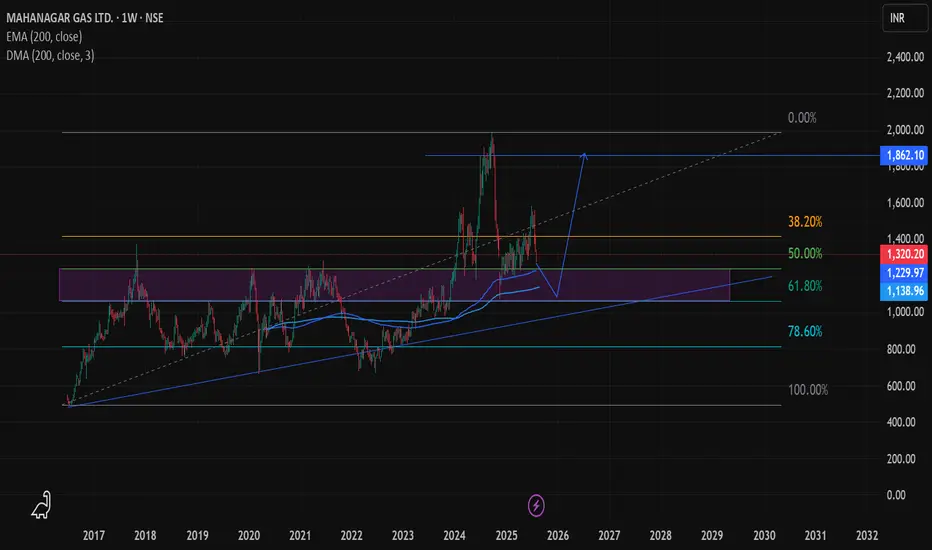
MGLThe stock appears to be reversing from the Fibonacci retracement levels, in the aligning with the 200 EMA and 200 DMA on the weekly timeframe.
Tata MotorsWeekly charts have been more reliable.
Tata motors is now following a cup and handle pattern and taking retracement at a support 480
big buy deal with reversal at 480

Buy on Dips | 4H timeframeBitcoin seems to have completed the formation of triangle and entered into an upward move.
The SL for this study would be price entering the price range of 111,700.
Profit could be booked on the marked Fibonacci levels (darker the color, more important the resistance level)

ZUARI AGRO CHEMICALS LTD – Breakout Above Multi-Year Resistance ZUARI AGRO CHEMICALS LTD (NSE: ZUARI) has broken above a strong multi-year resistance level around ₹370 on the weekly chart, signaling a major bullish breakout. The price is currently trading at ₹363, with strong momentum and increased volume.
Key technical highlights:
• Fibonacci Retracement Levels: The chart references the key retracement levels from the previous high to low:
• 0.382 (₹293.70) – Surpassed, now acting as support.
• 0.5 (₹370.25) – Significant resistance zone, currently being tested.
• 0.618 (₹446.75)
• 0.786 (₹555.70)
• 0.886 (₹620.50)
• Volume Surge: A sharp increase in trading volume supports the bullish move.
• Channel Breakout: Price action has decisively broken above the rising channel, indicating strong bullish sentiment and the potential start of a new uptrend.
• Next Targets: On sustained move above ₹370, next Fibonacci resistance levels are ₹447 (0.618), ₹555 (0.786), and ₹621 (0.886).
Trade Bias:
Bullish momentum breakout above multi-year resistance, supported by volume and Fibonacci confluence. Next major upside targets: ₹447, ₹555, and ₹621. Keep an eye on ₹370 as make-or-break support.

Escorts Maintains Bullish Trajectory with Strong Long-Term SuppoTopic Statement:
Escorts is on a bullish path, supported by a strong long-term trendline and reliable accumulation zones near key technical levels.
Key Points:
1. The stock consistently receives strong support at its long-term uptrend line
2. It is rarely seen below the 200-day EMA, making it a reliable accumulation opportunity as price nears the average
3. A recent correction to the 38.2% retracement level at 2933, near the 3000 barrier, provided firm support and renewed upward momentum

ETH rise foreverMy advanced fibo technical analysis says that It has 6100 easy target in sometime. Then It can take bit of a break and then rise other levels. My ultimate target for Etherium is unbelievably 10k in coming time. It's currently undervalues. If BTC touch 100k mark this can easily double triple in no time.
Follow the targets given in the chart.

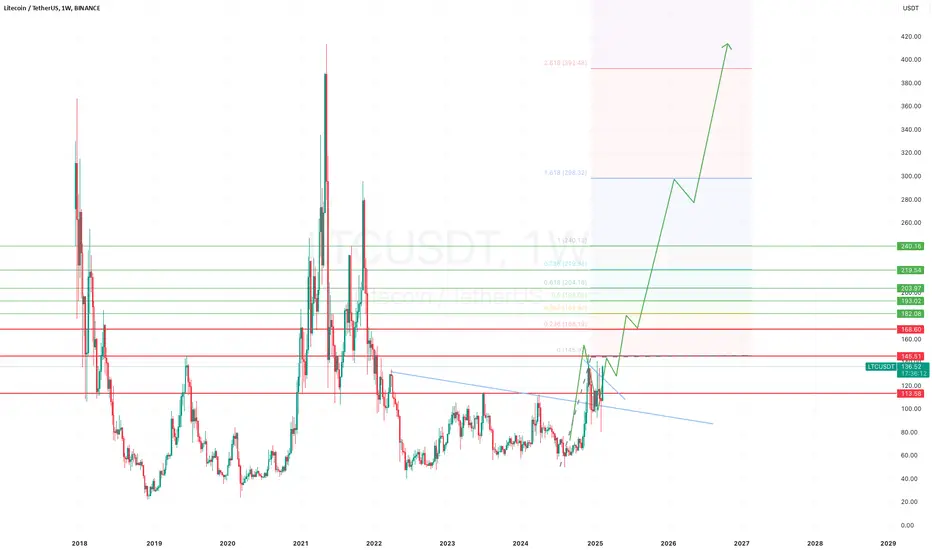
LTC coin is Litecoin has good consolidationg and already brokenout from the flat pattern. First target is 168-200. Then further according to trend based fib extension ha easy 400 ATH target. And i know people wont believe but this coin has lot of potential. We can even see 800 1000 1200 up to 4000 target. Ones ALT bull run start just keep this in radar this will be best wealth multiplier. Stay tuned, i will keep posting small small trades here in this post further.
Nifty Bullish Confluence Set up ( Swing+ positional)Hello,
Nifty spot 24610 from low of 21780 made high around 25650 april to june in 2 months now Its retrace to 24600 i.e almost more than 50% retracement another is RSI squezze with bullish divergence in lowertimeframe with EMA 200 support and making pattern of falling wedge .
expecting bullish reversal set up for new lifetime high possibilties in next 2 months
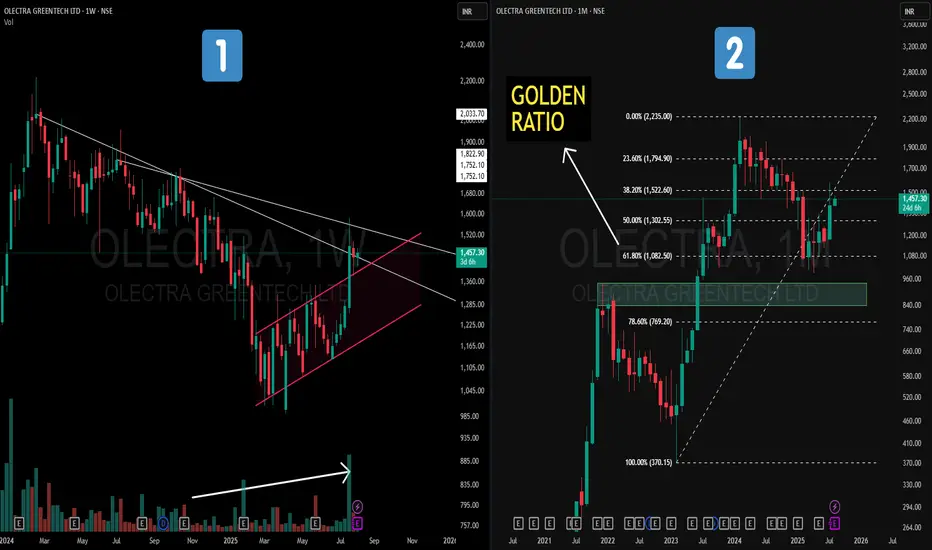
Olectra Greentech – Golden Ratio on MTF + Hidden channel on WTF📝 Description
📌On the Weekly Chart (Left) – Price action has formed a strong counter-trend (CT) breakout from a prolonged downtrend. Hidden within the structure is a parallel channel (highlighted in pink), with volume gradually increasing in the recent rally — a positive sign of accumulation.
📌On the Monthly Chart (Right) – A Fibonacci retracement drawn from the Feb 2023 low to the Feb 2024 high (a one-year strong uptrend) shows price taking support exactly at the 61.8% Golden Ratio. This reaction from a key retracement zone is aligned with historical technical behavior.
This is not a forecast, but rather a technical observation of structure, retracement behavior, and volume dynamics.