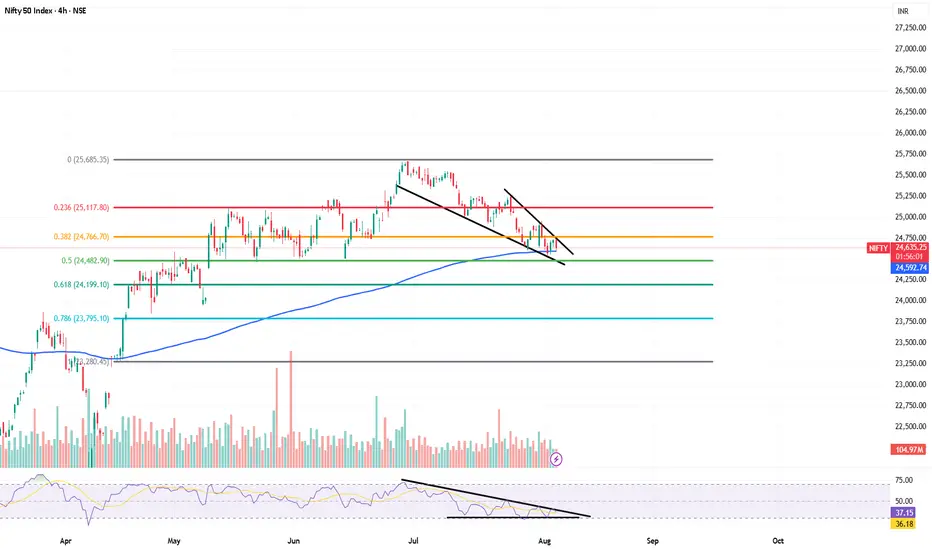
Nifty Bullish Confluence Set up ( Swing+ positional)Hello,
Nifty spot 24610 from low of 21780 made high around 25650 april to june in 2 months now Its retrace to 24600 i.e almost more than 50% retracement another is RSI squezze with bullish divergence in lowertimeframe with EMA 200 support and making pattern of falling wedge .
expecting bullish reversal set up for new lifetime high possibilties in next 2 months
Fibonacci
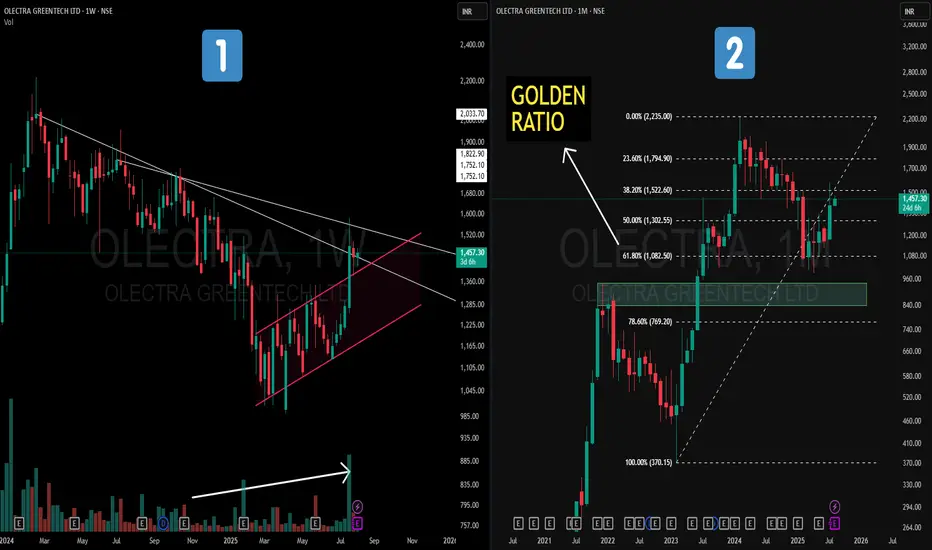
Olectra Greentech – Golden Ratio on MTF + Hidden channel on WTF📝 Description
📌On the Weekly Chart (Left) – Price action has formed a strong counter-trend (CT) breakout from a prolonged downtrend. Hidden within the structure is a parallel channel (highlighted in pink), with volume gradually increasing in the recent rally — a positive sign of accumulation.
📌On the Monthly Chart (Right) – A Fibonacci retracement drawn from the Feb 2023 low to the Feb 2024 high (a one-year strong uptrend) shows price taking support exactly at the 61.8% Golden Ratio. This reaction from a key retracement zone is aligned with historical technical behavior.
This is not a forecast, but rather a technical observation of structure, retracement behavior, and volume dynamics.
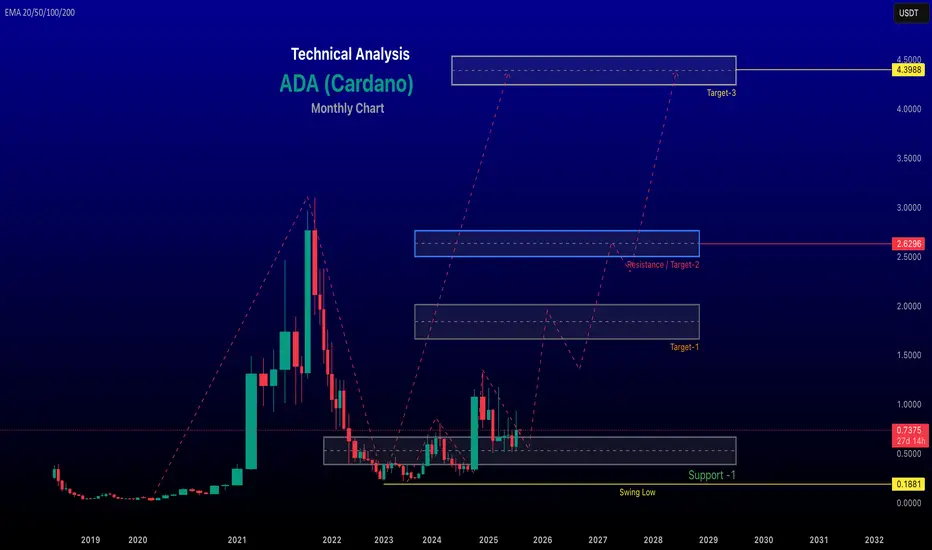
renderwithme | ADA Technical Analysis Monthly Chart"Riding the Cardano wave! #ADAUSDT poised for a breakout—targeting $0.81 and beyond! #CryptoTrading"
~ Disclaimer ~~
This analysis is based on recent technical data and market sentiment from web sources. It is for informational \ educational purposes only and not financial advice. Trading involves high risks, and past performance does not guarantee future results. Always conduct your own research or consult a SEBI-registered advisor before trading.
# Boost and comment will be highly appreciated.
LICI Shows Minimal Gains Since IPO, Moves Weakly Within Broad ChTopic Statement:
Nearly three years after its IPO at 870, LICI trades only slightly higher, reflecting the limited post-listing returns even for a market giant.
Key Points:
1. The stock is moving in a weak uptrending bullish channel, offering modest directional cues
2. It retraced to the 61.8% Fibonacci level where it received support and has since rebounded
3. Price now faces resistance at the 38.2% retracement level near 955, creating a ceiling for upward movement
4. Accumulating the stock below the 50-day EMA presents a more favorable risk-reward entry point

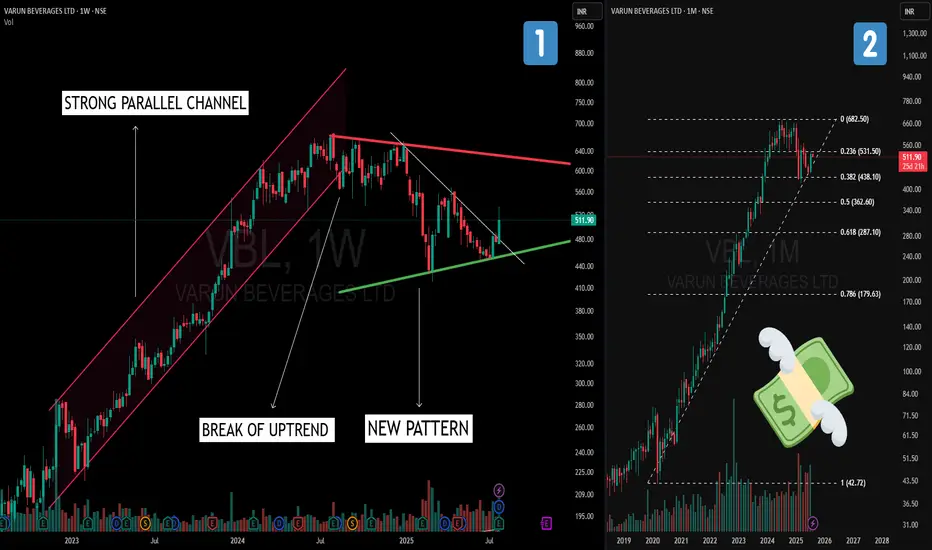
Varun Beverages: From Parallel Channel to Symmetrical TriangleOn the monthly timeframe (right chart), Varun Beverages shows a classic Fibonacci retracement pullback to the 38.2% level after an extended rally.
>Shifting to the weekly timeframe (left chart), we observe:
-Parallel Channel during the earlier uptrend phase, reflecting a strong trending structure.
-A break of the uptrend that transitioned into a sideways phase.
-Formation of a Symmetrical Triangle – characterized by a sequence of lower highs and higher lows, creating a contraction pattern.
This multi‑timeframe view highlights how trends evolve from strong rallies, to corrections, and into consolidation structures.
⚠️ Disclaimer:
This post is for educational purposes only and is not financial advice.
Coal india Looking like stock is going to reversal
From this Fibonacci retracment levels with the 200 Ema and 200 dma in a weekly timeframe.

ONGC Looking like stock is going to reversal from this zone with 200 ema and 200 dma with Fibonacci retracment levels

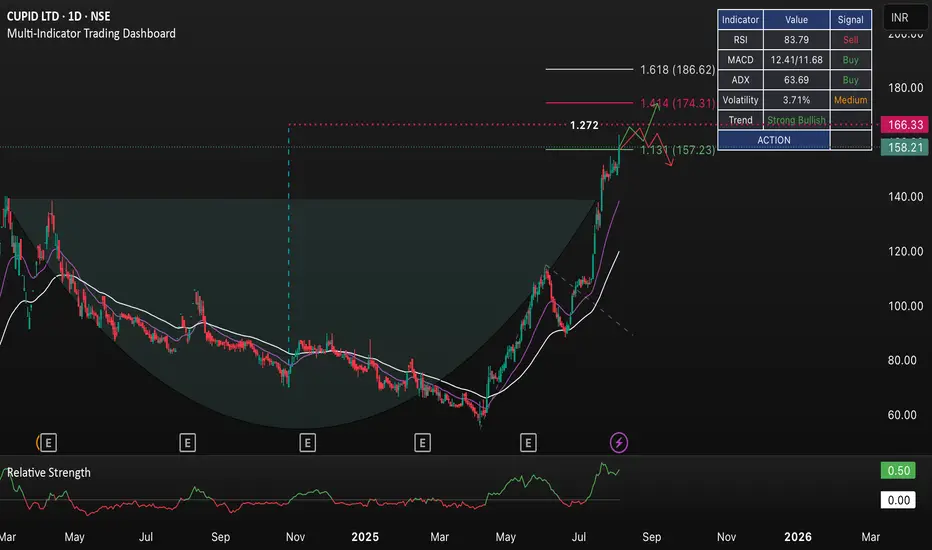
CUPID LTD | Strong Bullish Momentum with Key Resistance Levels CUPID LTD (NSE) is displaying a strong bullish trend, as reflected in the Multi-Indicator Trading Dashboard. The stock recently broke out of a long consolidation, and technical indicators show:
• RSI: 83.79 (Overbought zone, signal: Sell)
• MACD & ADX: Both indicate continued buying strength
• Volatility: 3.71% (Medium)
• Trend: Strong Bullish
Price action has exceeded the 1.13 and 1.272 Fibonacci extension levels, currently testing resistance near ₹158. Short-term targets are ₹166.33 and ₹174.31, with a major resistance at ₹186.62. However, overbought RSI suggests caution and potential for some profit booking or retracement.
Key levels to watch:
• Support: ₹157.23
• Resistance: ₹166.33, ₹174.31, ₹186.62
Traders may consider booking partial profits or trailing stops, while momentum traders can look for further breakout opportunities above resistance levels.
Please do your own analysis before any trade. This is not investment advice.
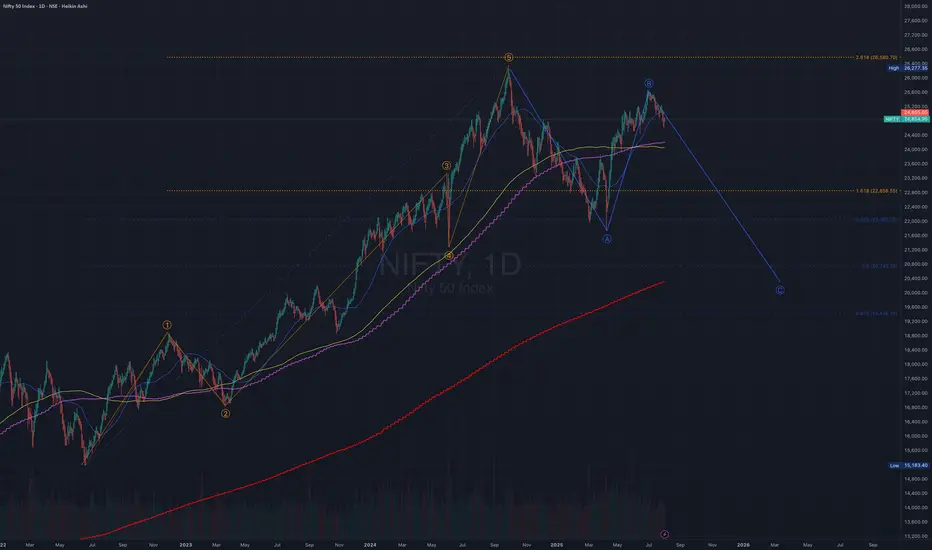
Tough Times ahead for Nifty. 26277 Top for some years?Nifty has been in Bull run for some Years now.
2008 to 2020 - Wave 1 Impulse
2020 Crash - Wave 2 Correction
2020 to 2025 - Wave 3 Impulse
2025 to 2026 - Wave 4 Correction
2026 2027 Onwards - Wave 5 Impulse
Let's Break Wave 4
It may take place in Double or Triple wave Combo.
The Corrective Wave ends in 3 or more Legs.
Wave A - 26k to 22k.
Wave B - 22k to 25.5k
Wave C - 25.5k to 21k
Next Set of Legs - to Follow in New idea.
This would be the 1st of the Corrective Combo that is expected to end around 19k By 2026 2027.
Now could be the Time for Wave C with rejection from 0.854 of Fib retracement of Wave A.
It looks like Wave C is about to begin.. Let's meet at 21k 🫣
RSI - Circled - to be noted.
All The Best🥲
Short Trade Activates below 24750.

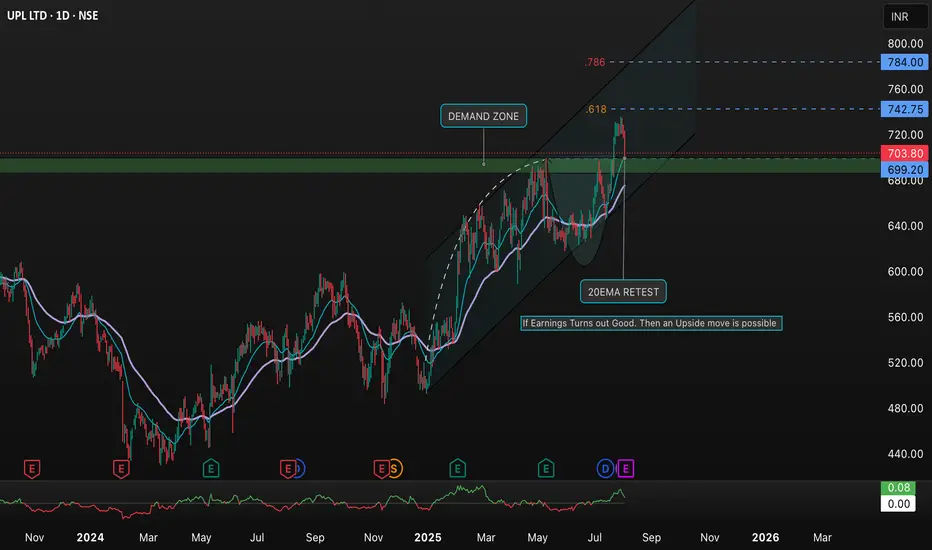
UPL LTD - Daily Chart Analysis with Demand Zone & Key ResistanceDescription:
This chart analyzes UPL LTD (NSE:UPL) on the daily timeframe. Key highlights include:
• Demand Zone: The chart marks a demand zone where buying interest is expected to be strong.
• Fibonacci Levels: Major resistance at the 0.618 and 0.786 Fibonacci retracement zones (around 720 and 784).
• Current Price Action: Stock is trading near 703.80, showing a recent pullback after testing higher levels.
• 20EMA Retest: The price recently retested the 20 EMA, a critical support.
• Upside Potential: Watch for an upside move if upcoming earnings turn out positive. Key upside targets: 742, 760, and 784.
• Strategy Note: Monitor the demand zone for support and watch for breakouts above resistance for potential bullish confirmation.
Ideal for traders looking to capitalize on support/resistance and trend-following strategies.
Positional or Long-term Opportunity in CampusGo Long @ 291.55 for Targets of 367.9, 418.8, and 469.7 with SL 266.1
Reasons to go Long :
1. On weekly timeframe stock gave Trendline breakout (marked with red color).
2. If we draw Fibonacci retracement from the recent swing low (A) to the swing high (B) then the stock took support from the 0.382 Fibonacci level.
3. In addition to this, the stock formed a Bullish Engulfing Pattern (marked with a orange color) around 0.382 Fibonacci level.

Nifty will fall to its 200 WMA at 20,308Nifty's Impulse Wave started in June 2022 at 15,123 and completed Wave 5 in September 2024 at 26,269 (Orange lines and levels on chart). The chart is perfect with Wave 3 hitting 1.618 fib and Wave 5 hitting 2.618 fib. Note that Wave 4 was exceptionally quick.
It then started an ABC correction wave (Blue on chart). Wave A completed in April at 21,712 (038 fib) and Wave B in June 2025 at 24,854. What's next? Wave C, of course! Wave Cs typically trace back to 0.5 fib to 0.68 fib and the 200 WMA is conveniently sitting right between them at 20,308 (red line) - and that's a solid support for the ABC correction to end.
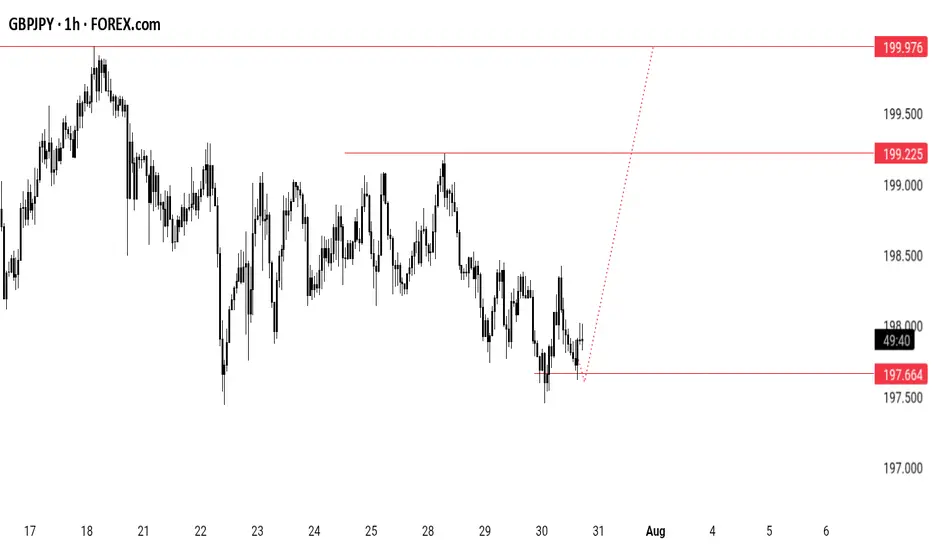
GBPJPY POTENTIAL LONGLooking at GBPJPY ,CURRENTLY taking long positions on the retest of the recently created daily demand zone which also confluences with the retest of the recently created 4h and 1h demand zone .
Varun Beverages (VBL) Approaching Key Fibonacci Resistance |Varun Beverages Ltd. (NSE: VBL) is exhibiting a strong upward move after rebounding from the major support zone near ₹450 (0.786 Fibonacci level). The price has surged past crucial levels and is headed towards a key resistance zone between ₹539 (0.618 Fibonacci retracement) and ₹564 (0.786 Fibonacci retracement) after a sustained period of consolidation.
Key Observations:
• Significant support was respected in the ₹449–₹475 range, leading to a breakout.
• The next resistance zone lies at the ₹539–₹564 range (highlighted by the Fibonacci retracement levels).
• If the momentum sustains and bulls take control, a move towards ₹595 and ₹615 (Fibonacci extension target) is possible.
• Major volumes have accompanied this move, indicating strong buying interest.
• Traders should watch for price action and potential reversal signs

Corrective DownBitcoin seems to be completing Wave F of a diametric formation.
Generally, Wave B and Wave F are related to each other and till now, Wave F is almost equal to Wave B, so a potential area of resistance
After this a corrective downside in form of Wave G could start.

Gold update for the first days of next weekGold is in a downtrend, we will wait for a bounce at 3369.5 and I will wait for a buy point below and hold it there then sell off.

ZYDUS LIFE-- BULLISH VIEW (EDUCATIONAL PURPOSE)ZYDUS LIFESCIENCE -- BULLISH VIEW (EDUCATIONAL PURPOSE)
Correction noticed after making high 1324.30 in Aug-2024, Currently stock is in consolidation zone, testing the previous swing high near 1010-1020 zone, trying to form higher high -- higher low structure and expected to move in upward direction with trendline support drawn by joining the lows
(Dotted line).
There is possibility of formation of Inverse Head and shoulder pattern as marked, however it is not the the surety. If inv. Head and shoulder is formed it will add more strength. Also the pattern may confirm higher high -- higher low formation which indicates uptrend
Buying position can be initiated at current level-976 or can even wait for slight correction till 950-940 considering the possible reversal of the trend
Target : Fibo extension suggest target of 1807 (85%) after clearing resistance zone near 1300
Stop loss : weekly closing below 795 (-19%)
Risk reward Ratio : 1:4.6
Time target : 48 months.
Pure investment view, not for short term trading

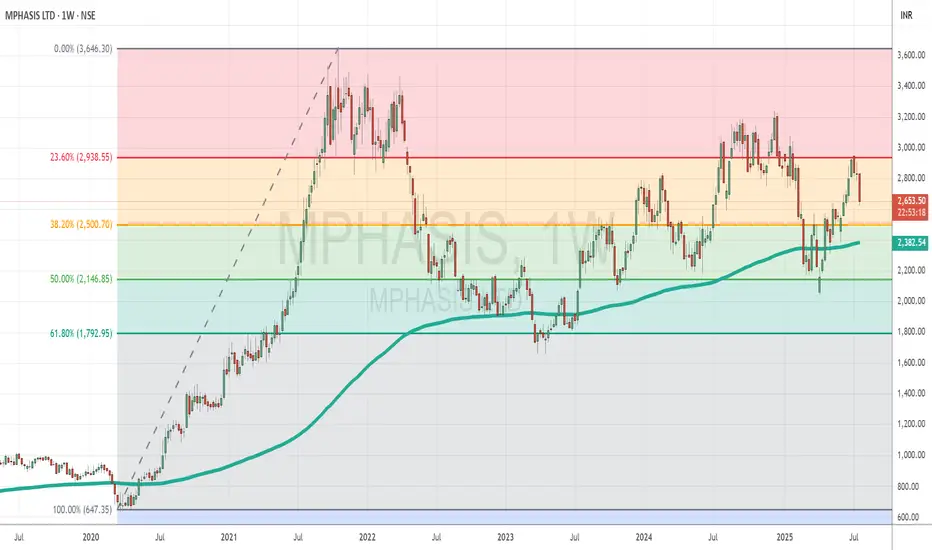
Mphasis Holds Strong Amid Weak IT Sentiment, Trading Between KeyTopic Statement:
Mphasis has shown resilience despite the broader weakness in the Indian IT sector, oscillating between strong support and resistance levels.
Key Points:
* The stock faces stiff resistance near 3000, with the 23.6% Fibonacci retracement level at 2938
* It receives strong buying support around 2000, with the 50% retracement level at 2146 acting as a critical floor
* The price rarely dips below the 200-day EMA, and such instances have historically presented attractive investment opportunities
EURAD POTENTIAL LONGLooking at EURAD on the 1h timeframe,currently looking to take a long position upon the retest of the recently formed 4h and 1h demand zone.A break below the recently formed swing low will invalidate the long.

Coforge Makes V-Shaped Recovery Post Crash, Eyes Resistance at DTopic Statement:
Coforge staged a sharp V-shaped recovery from the early 2025 market crash, rebounding off key support and approaching major resistance.
Key Points:
* The stock retraced to the 38.2% Fibonacci level at 1292 during the crash, where it found strong support
* A swift V-shaped recovery followed, with the price now facing stiff resistance at 2000, forming a double top
* Coforge generally trades above the 200-day EMA, making it a strong accumulation candidate when nearing that level

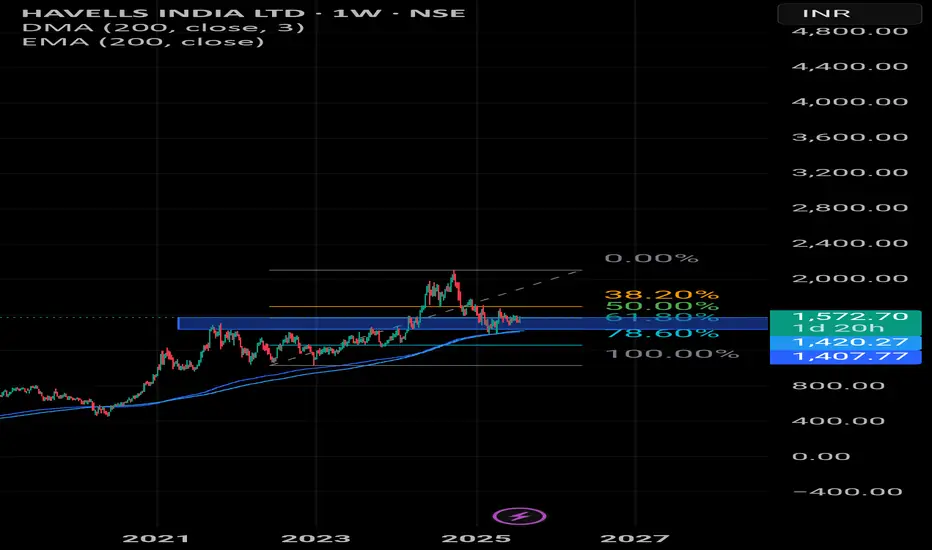
HAVELLS INDIA This stock is looking looking for reversal on weekly timeframe with Fibonacci retracment levels with Ema and dma of 200.
Update gold 23/7My gold trading plan, target is 3498 But before reaching that point, I will sell and wait to collect at lower price.

Angel One Struggles to Recover After Weak Earnings, Stuck in DowTopic Statement:
AngelOne remains under pressure after a sharp profit decline, trading within a downtrending channel as it struggles to regain bullish momentum.
Key Points:
* The stock is moving in a clearly marked downtrending channel, allowing for structured channel-based trading
* It received strong support at the 50% Fibonacci retracement level around 2000, helping limit further downside
* Price generally faces resistance above the 100-day EMA, which continues to cap any rebound attempts
* A breakout above the channel could signal a trend reversal, but the poor quarterly results may delay any significant upside move
