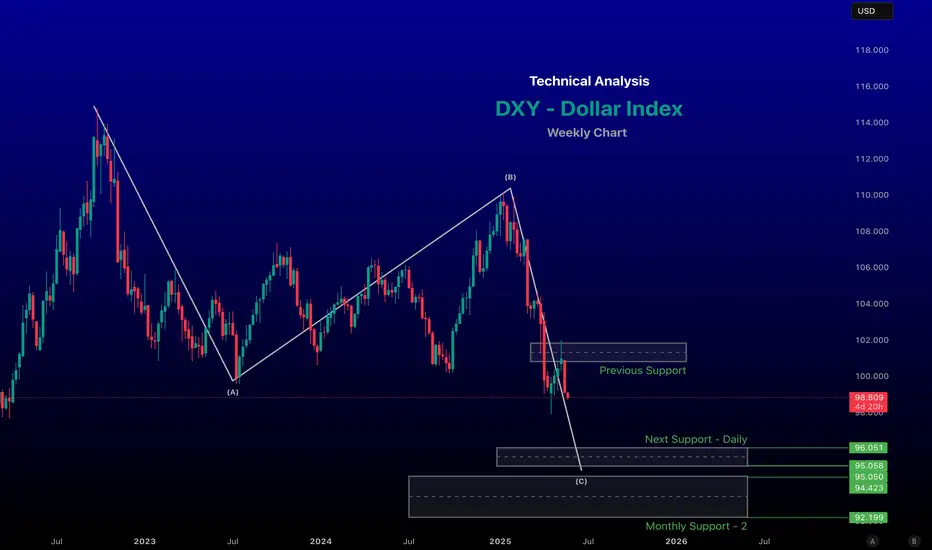
Technical Analysis of DXY (US Dollar Index) for the Week of May # Current Price Action and Market Context
Recent Price Movement: As of May 23, 2025, the DXY closed at approximately 99.11, down 0.85% from the previous session's close of 99.96. The index has been trending downward, testing two-week lows near 99.14 after failing to reclaim the 100.50 level.
Bearish Momentum: The break below 97.50 on the monthly chart signals a bearish structure with lower highs and lower lows, suggesting continued selling pressure. The next major downside target is around 96.00, with a potential longer-term target near 92.00.
Key Fundamental Drivers: Recent weakness in the DXY is attributed to President Trump’s proposed 50% tariffs on European imports, which have undermined bullish momentum in the dollar. Additionally, anticipation of Federal Reserve interest rate decisions, upcoming US inflation data, and employment reports (e.g., Non-Farm Payrolls) will play a significant role in the DXY’s direction.
-- Chart for your reference --
-- Disclaimer --
This analysis is based on recent technical data and market sentiment from web sources and X posts. It is for informational purposes only and not financial advice. Trading involves high risks, and past performance does not guarantee future results. Always conduct your own research or consult a SEBI-registered advisor before trading.
Fibonacci
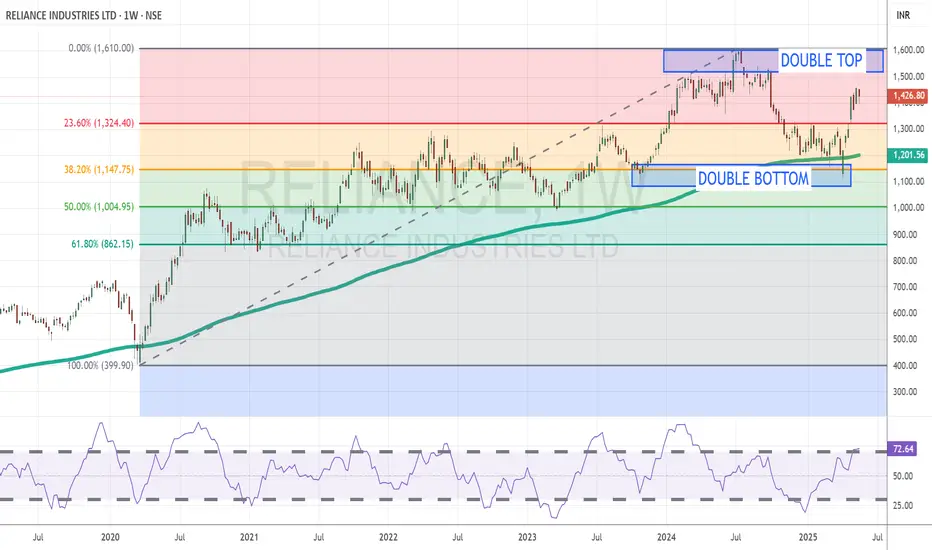
Reliance Nears Lifetime High After Rebounding Strongly from TechTopic Statement:
Reliance is in a strong bullish phase, continuing its recovery momentum after a solid technical reversal.
Key Points:
The stock reversed sharply from a double bottom pattern at the 38.2% Fibonacci retracement level, offering strong support.
It received an additional bullish push at the 23.6% level, reinforcing upward momentum.
The price is approaching its lifetime high of 1161, where a double top formation is likely and could act as a profit-booking zone due to expected resistance.
Now trading above the 180-day EMA, the stock is technically overbought, suggesting a potential pause or pullback near the peak.
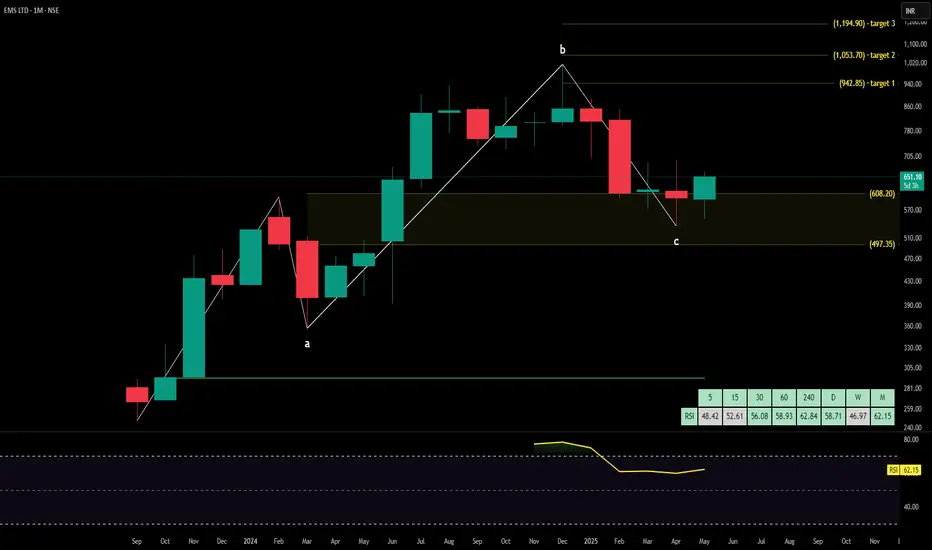
EMS technical analysisEMS Ltd. (NSE: EMS) is currently trading at INR 651.10. The company operates in the engineering and infrastructure sector, specializing in water and wastewater management solutions, catering to industrial and municipal needs.
Key Levels
Support Level: INR 497.35
Swing Level: INR 718.75
Possible Upside Levels: INR 942.85, INR 1,053.70, INR 1,194.90
Technical Indicators
RSI: The Relative Strength Index (RSI) is at 62.15 (monthly timeframe), reflecting strong momentum yet staying below the overbought threshold, suggesting continued strength with potential upside movement.
Volume: Trading volume is 4.06M, showing steady investor interest. Increased volume near breakout levels may confirm potential price movement toward higher levels.
Sector and Market Context
EMS Ltd. operates in a high-demand sector, benefiting from India’s push for sustainable water management and smart city projects. Government spending in water infrastructure continues to grow, supporting long-term revenue stability for firms in this industry. However, sector volatility due to raw material costs, contract execution challenges, and policy shifts remains a consideration. Broad market indicators suggest favorable conditions, with investors closely watching companies aligned with infrastructure modernization.
Latest News and Developments
Market Trends: Institutional investors show growing interest in infrastructure stocks amid increased government contracts for urban water management.
Analyst Ratings: Positive outlook backed by strong order execution and expanding pipeline of municipal projects.
Quarterly Results: Recent financial disclosures indicate steady revenue growth, aided by higher project completions and increased government tenders.
Dividend Update: No recent dividend declarations, signaling continued reinvestment into scaling operations and project fulfillment.
Analysis Summary
EMS Ltd. shows bullish technical trends, supported by strong momentum and sector tailwinds. The RSI reflects continued price strength, while volume indicates steady investor engagement. Sector dynamics remain favorable, driven by policy support and expanding market opportunities. Investors should monitor price action near swing levels, volume trends, and broader economic developments before making informed decisions.
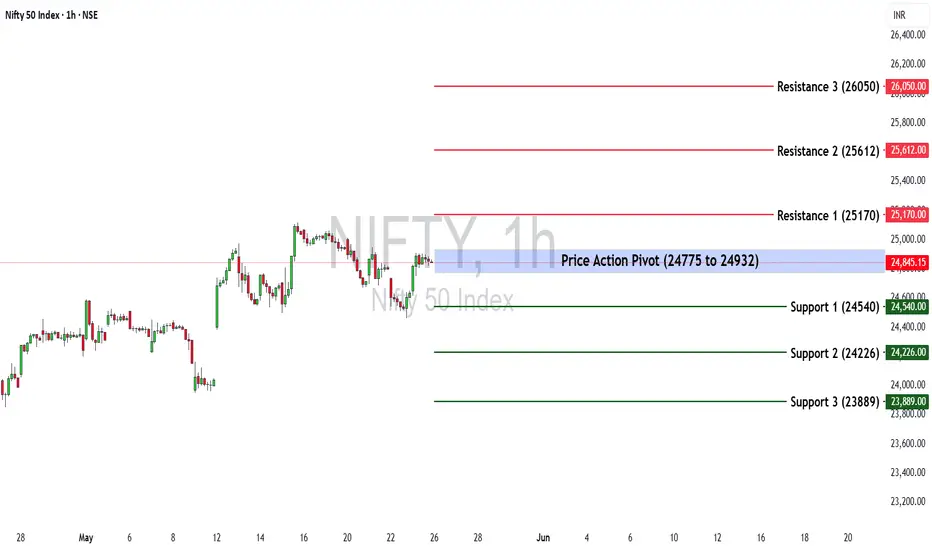
Nifty 50 at a Turning Point? Key Levels & Market Outlook AheadThe Nifty 50 ended the week at 24,853.15 with a loss of (-0.67%)
If Nifty sustains below 24,771, selling pressure may increase. However, a move above 24,932, could restore bullish momentum.
Key Levels for the Upcoming Week
🔹 Price Action Pivot Zone:
The crucial range to watch for potential trend reversals or continuation is 24,775 -24,932.
🔹 Support & Resistance Levels:
Support:
S1: 24,540
S2: 24,226
S3: 23,889
Resistance:
R1: 25,170
R2: 25,612
R3: 26,050
Market Outlook
✅ Bullish Scenario: A sustained breakout above 24,932 could attract buying momentum, driving Nifty towards R1 (25,170) and beyond.
❌ Bearish Scenario: A drop below 24,775 may trigger selling pressure, pushing Nifty towards S1 (24,540) or lower.
Disclaimer: lnkd.in
INTU seems to have completed Correction and heading towards ~700INTU seem to have completed complex ABC correction,.
Its last corrective leg had XYZ correction (provided we see break out from current segment)
It seem to be heading towards ~700 in coming weeks/months
Can the pattern change ?
Yes we may have a Z wave hitting channel bottom, or one more larger ABC may play out for next few months (this is low probability)
If any one needs larger time frame wave structure do comment so that I can share the road map that I see with INTU.,

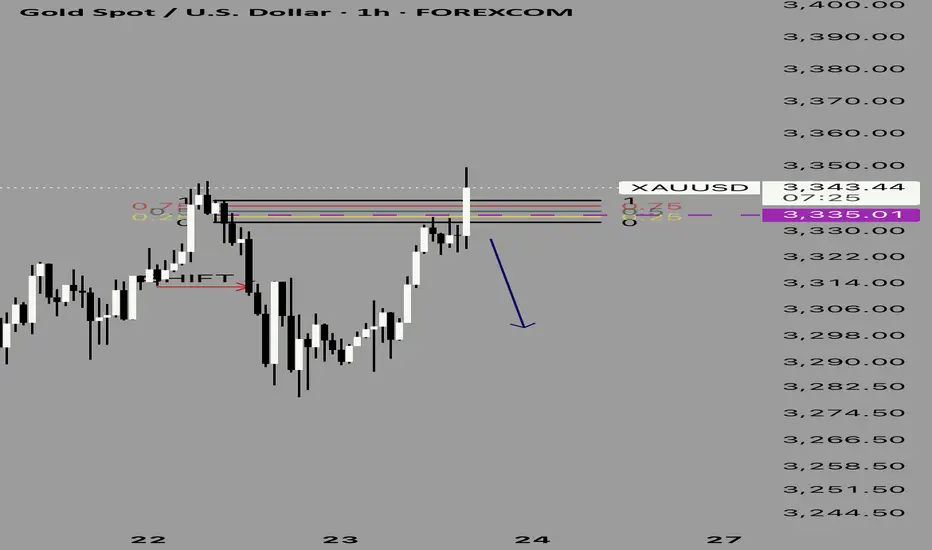
Gold is getting readyExpecting gold to go bearish! It is on very strong resistance so most probably gold is going to go and show some bearish moves!
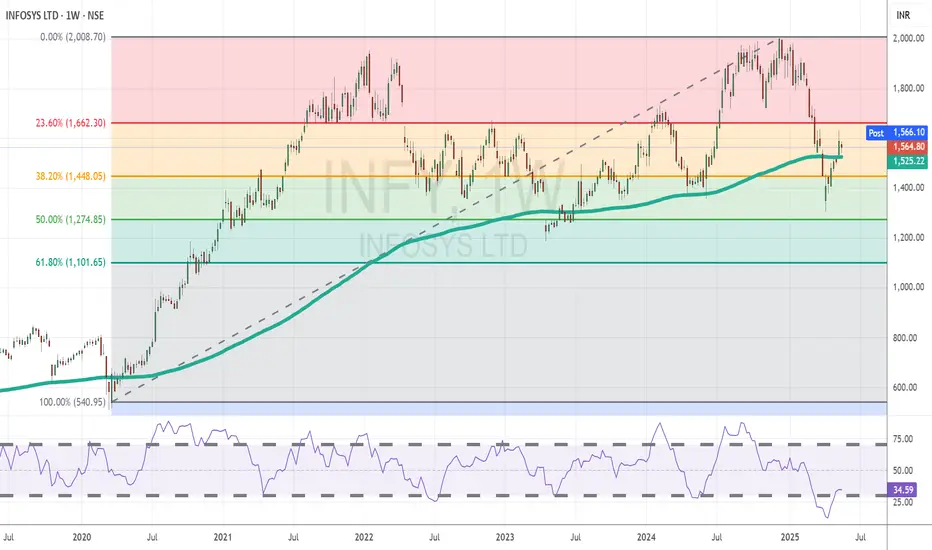
Infy Attempts Breakout After Rebounding from Key Fibonacci SuppoTopic Statement:
Infosys is showing signs of a steady recovery after a deep correction, though key resistance levels still challenge the upward momentum.
Key Points:
The stock found strong support at the 50% Fibonacci retracement during the recent correction, indicating solid buying interest at lower levels.
As the price recovers, the 23.6% Fibonacci level is acting as resistance, slowing the upward move.
Trading just above the 180-day EMA, Infosys remains technically oversold, hinting at continued recovery potential if resistance is breached.
CDSL [Follow up] – Wave (5) Ending or Extending?The earlier hypothesis of a bullish impulse in CDSL saw Wave (5) completing near the 1.0 extension from Wave (4), right at the upper channel boundary — a strong confluence zone.
On closer inspection, the internal structure of Wave (5) looks more like an A-B-C rather than a clean 1-2-3-4-5, hinting at possible exhaustion.
This raises the likelihood that Wave (A)/(1) may already be in, and a Wave (B)/(2) correction could be in progress.
Still keeping an eye on the 1.618 projection as a stretch target if the trendline breaks. Until then — structure confirmation is key.
Tools: Elliott Wave, Fibonacci Projections
Timeframe: 30min / 1H for intrawave clarity

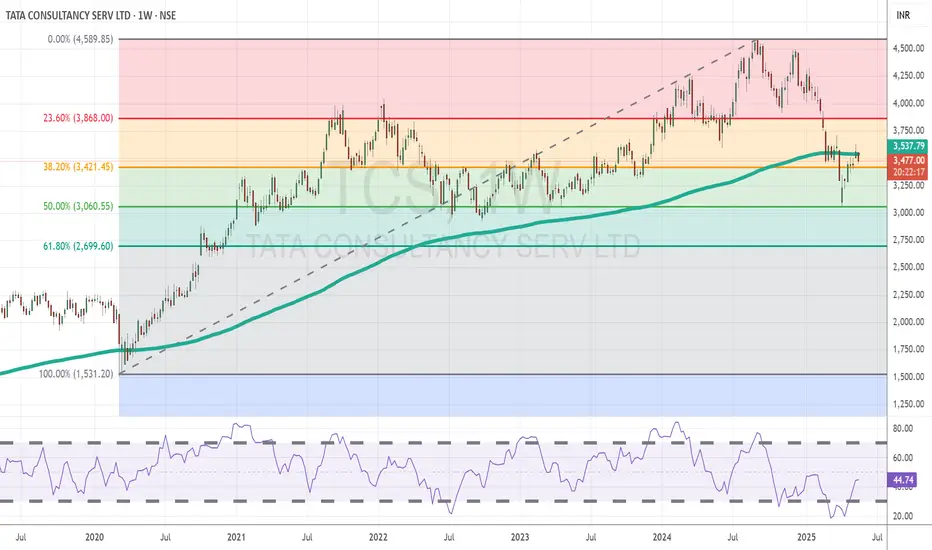
TCS Eyes Recovery After Holding Strong at Key Support LevelsTopic Statement:
TCS has shown signs of recovery after a recent correction, with strong technical support levels reinforcing bullish potential.
Key Points:
The price previously found strong and consistent support near the ₹3000 mark, reaffirmed during the recent market correction.
A full retracement to the 50% Fibonacci level** at ₹3060 attracted significant buying interest, highlighting renewed strength.
Currently, the stock trades just below the 200-day EMA, indicating it remains in oversold territory, but with potential for reversal if momentum continues.
WALCHANDNAGAR technical analysisWalchandnagar Industries Ltd. (NSE: WALCHANDNAGAR) is currently trading at INR 209.92. The company operates in the heavy engineering and manufacturing sector, specializing in defense, aerospace, nuclear, and industrial machinery solutions.
Key Levels
Support Level: INR 111.57
Swing Level: INR 255.85
Possible Upside Levels: INR 400.00, INR 469.90, INR 559.00
Technical Indicators
RSI: The Relative Strength Index (RSI) is currently at 51.52, reflecting neutral momentum, indicating that the stock is neither overbought nor oversold.
Volume: Trading volume has been stable, suggesting consistent investor interest. A surge in volume near key levels may validate price movements.
Sector and Market Context
Walchandnagar Industries operates in the capital goods and defense engineering sector, benefiting from government-backed infrastructure projects, defense modernization, and aerospace advancements. The sector has seen steady growth, supported by India's increasing defense manufacturing initiatives and private sector participation in high-tech engineering. However, market volatility, fluctuations in raw material costs, and order execution challenges may impact stock performance.
Latest News and Developments
Market Trends: Increased institutional interest in defense and engineering stocks due to India’s push toward self-reliance in strategic sectors.
Analyst Ratings: Analysts have noted improved order flow in aerospace and industrial machinery, which could bolster future revenue.
Quarterly Results: Recent financial reports indicate stable revenue growth with higher execution timelines, affecting short-term liquidity.
Dividend Update: No recent dividend declarations, signaling a focus on reinvestment for capacity expansion and technology upgrades.
Analysis Summary
Walchandnagar Industries Ltd. has maintained strong sector positioning, with steady technical indicators reflecting stable price momentum. The RSI suggests neutral movement, while volume trends confirm continued investor engagement. Sector dynamics indicate long-term potential, driven by India’s engineering and defense growth strategies, though macroeconomic risks should be monitored. Investors should watch price action at key levels, volume trends, and sector developments before making informed decisions.

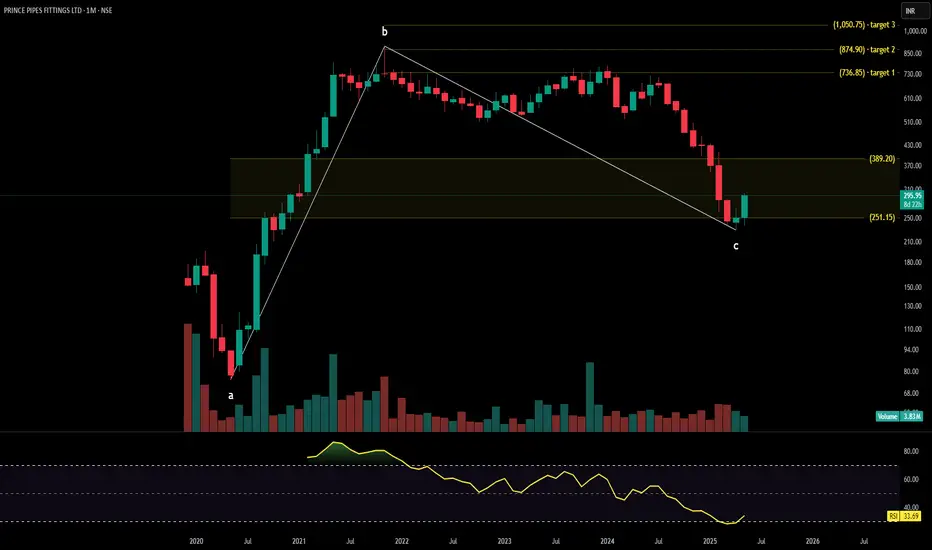
PRINCE PIPES technical analysisPrince Pipes & Fittings Ltd. (NSE: PRINCEPIPE) is currently trading at INR 295.95, reflecting a 17.81% increase. The company is a leading manufacturer of polymer piping solutions, supplying products for plumbing, irrigation, and infrastructure needs across India.
Key Levels
Support Level: INR 251
Swing Level: INR 380 - 484
Possible Upside Levels: INR 736.85, INR 874.90, INR 1,050.75
Technical Indicators
RSI: The Relative Strength Index (RSI) is at 33.69, indicating that the stock is in a low momentum phase, approaching oversold levels, which could suggest potential for recovery.
Volume: Trading volume has seen a surge, confirming heightened investor interest, especially around key price zones. Strong volume during price increases could validate bullish sentiment.
Sector and Market Context
Prince Pipes & Fittings Ltd. operates in the industrial and construction materials sector, which has seen steady demand growth due to infrastructure expansion, real estate development, and government-backed housing initiatives. The sector benefits from cost-efficient polymer solutions replacing traditional materials, contributing to market resilience. However, fluctuations in raw material prices (PVC resin), regulatory policies, and consumer demand cycles could impact performance. The broader market context shows recovery signs, with investors actively looking at fundamental stocks offering long-term stability.
Latest News and Developments
Quarterly Results: The company reported revenue growth driven by higher sales volumes, though margins remained under pressure due to rising input costs.
Analyst Ratings: Some analysts have maintained a neutral-to-positive stance, citing strong market presence but cautious outlook on pricing pressures.
Industry Trends: Increased demand for sustainable and high-performance polymer piping solutions supports long-term prospects.
Dividend Update: No recent dividend declarations, indicating a strategy focused on reinvestment for expansion.
Analysis Summary
Prince Pipes & Fittings Ltd. is currently in a consolidation phase, with RSI suggesting potential for recovery. The stock benefits from sector tailwinds, supported by infrastructure growth and evolving consumer preferences. Investors should watch price action near key levels, volume trends, and sector developments before making informed decisions. A balanced approach is recommended, considering both the opportunities and risks inherent in the market.
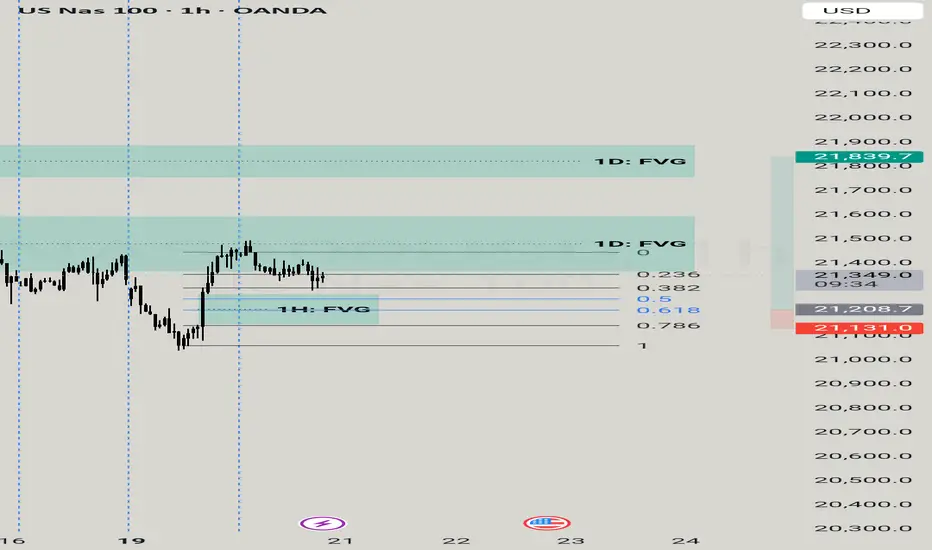
Nasdaq buy side Here we have analysis of nasdaq chart
1. Last night price took the 1 day FVG at the top and with a strong impulse movement.
2. There is a 1 hour fvg pending at 21200 level
3. If prices takes the fvg at 1hr in the down side with the liquidity & Fib movement strong pd arrays at 21200
4. The the next poi will be on 1 day at the upper side of 21800 level with a strong liquidity.
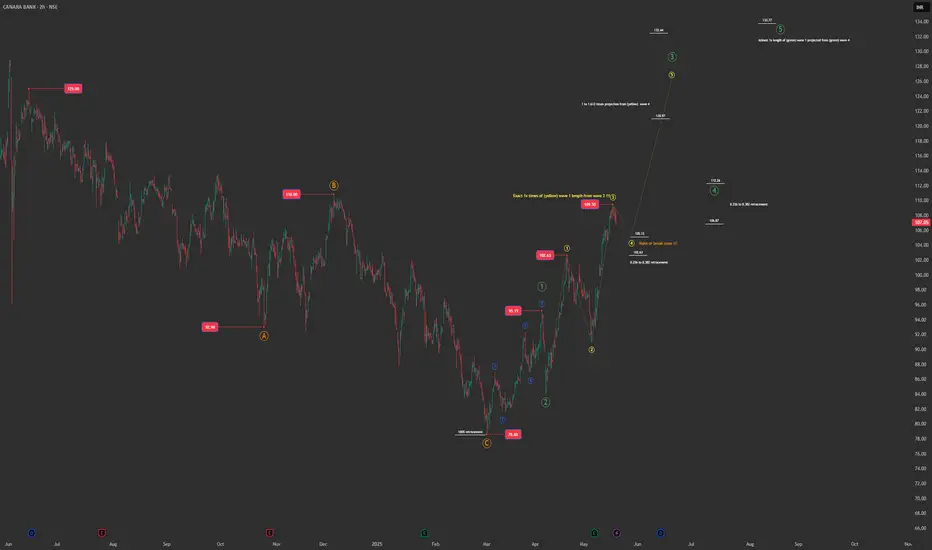
Canara Bank – Impulse Wave in Play After ABC Correction?From the mid-June 2024 high, Canara Bank completed a textbook ABC correction, with Wave C terminating precisely at the 100% retracement of Wave A from B. This setup marked the end of the downtrend and the potential beginning of a new impulsive uptrend.
The current structure shows a higher-degree impulsive move (marked in green), within which Wave 3 appears to be subdividing into its own smaller impulse (yellow count). Notably, Wave 3 (yellow) has completed exactly 100% of Wave 1 from Wave 2 at 109.50, which aligns well with common Fibonacci projections.
A healthy retracement (Wave 4 of yellow) is now underway, typically expected to fall within the 0.236–0.382 retracement zone. This region is a critical make-or-break zone — sustaining above 102.63 keeps the bullish structure intact and sets the stage for Wave 5 (yellow), which could complete the larger Wave 3 (green).
Once Wave 3 (green) tops out, a correction in Wave 4 (green) could unfold, again within the 0.236–0.382 retracement zone. Monitoring RSI divergence will be essential to identify exhaustion at the top of Wave 3.
If the pattern continues to hold, Wave 5 (green) could push price to 130+ levels , assuming a minimum 1x projection of Wave 1 from the Wave 4 base.
The structure remains valid only as long as 105.12 and 102.63 are respected . A deeper breakdown would suggest the count is invalid and we may instead be dealing with a complex W-X-Y-X-Z correction , with Z potentially unfolding below 78.60.
Given that earnings and revenue reports in both Jan and May have been strong, the bullish case is fundamentally supported too. Still, alternate bearish counts must be kept in mind.
This is a technical analysis for educational purposes only and not a buy/sell recommendation.
Timeframe: 2hr
Tools Used: Elliott Wave, Fibonacci Retracements, RSI
BUTTERFLY GANDHI technical analysisButterfly Gandhimathi Appliances Ltd. (BSE: 517421) is currently trading at INR 1,051.45. The company operates in the home appliances sector, specializing in kitchen solutions including cookware, mixers, and grinders. This a subsidary of Crompton.
Key Levels
Support Level: INR 859.80
Swing Level: INR 1,051.45
Possible Upside Levels: INR 1,648.90, INR 1,947.60, INR 2,328.10
Technical Indicators
RSI: The Relative Strength Index (RSI) is currently at 44.16, indicating neutral momentum. The stock is neither in the overbought nor oversold zone, suggesting moderate price movement potential.
Volume: The trading volume has shown fluctuations, with some recent periods indicating increased investor participation. A rise in volume near key levels may confirm price movements.
Sector and Market Context
Butterfly Gandhimathi Appliances Ltd. operates in the home and kitchen appliances sector, which has experienced steady growth due to increasing urbanization, rising disposable incomes, and evolving consumer preferences for premium kitchen solutions. The broader market outlook remains positive, supported by a growing demand for kitchen automation and eco-friendly appliances. However, factors like fluctuating raw material costs, competition from international brands, and consumer spending trends could impact stock performance.
Latest News and Development
Butterfly Gandhimathi Appliances Ltd. reported a standalone net profit of ₹9.03 crore for Q4 FY25, marking a turnaround from a ₹19.76 crore loss in the same quarter last year. The company’s total income for the quarter rose to ₹189.23 crore, reflecting a 12% increase from ₹167.46 crore in Q4 FY24.
For the full fiscal year ending March 31, 2025, Butterfly Gandhimathi posted a net profit of ₹32.53 crore, significantly up from ₹7.38 crore in the previous year, despite a 7% decline in annual revenue to ₹864.5 crore. The profit recovery was driven by cost optimization and improved operational efficiency.
The company has also announced upcoming product launches and stronger channel partnerships, aiming to expand its market presence. Additionally, a board meeting was held on May 13, 2025, where key financial decisions, including dividend considerations, were discussed.
Analysis Summary
Butterfly Gandhimathi Appliances Ltd. presents a balanced technical outlook, with key levels identified for potential price movements. The RSI indicates neutral momentum, while sector trends support long-term growth. Investors should monitor industry-wide developments, macroeconomic conditions, and company-specific announcements before making investment decisions.

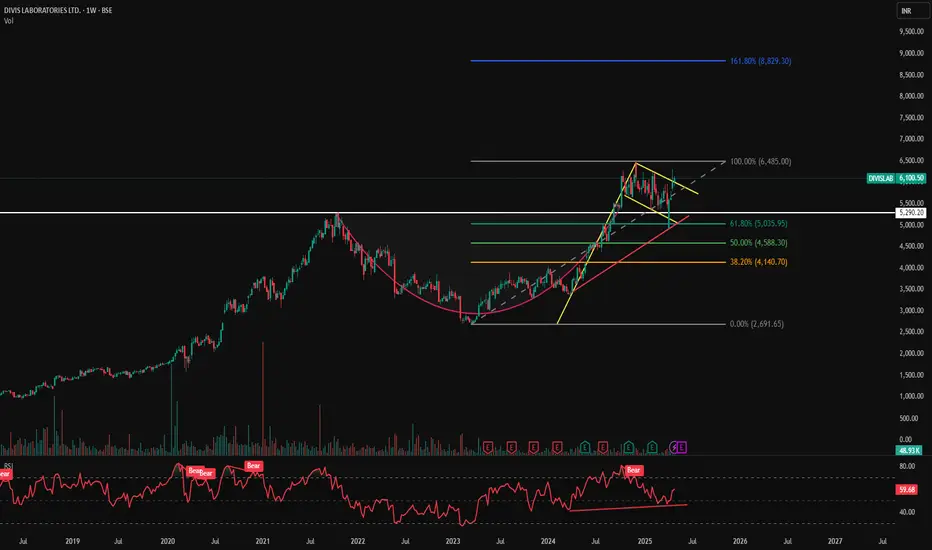
DIVISLAB - Cup Pattern Breakout with Bullish Flag Consolidation📊 DIVISLAB – Cup Pattern Breakout with Bullish Flag Consolidation
🕰️ Timeframe: 1W | 🔍 Pattern: Cup Formation + Bullish Flag | 🚀 Long-Term Breakout Potential
📈 Technical Breakdown:
DIVISLAB has formed a massive Cup pattern on the weekly timeframe and is currently consolidating inside a Bullish Flag after hitting the neckline breakout. This is a classic continuation setup following a long accumulation.
Post breakout, the price tested the upper region and is now preparing for a potential next leg toward Fibonacci extension levels.
🔑 Key Support & Resistance Levels:
🔵 Resistance / Upside Targets:
₹6,485.00 (Cup breakout top)
₹8,829.30 (Fib extension 161.8%) 🟦
🔴 Support Zones:
₹5,290.20 – Local horizontal support
₹5,035.95 – Fib 61.8% retracement (strong support)
₹4,588.30 – Fib 50%
₹4,140.70 – Fib 38.2%
₹2,691.65 – Long-term base (0% Fib)
🧭 Strategic View:
🟢 Bias: Bullish
🔁 Retest Zone: ₹5,290–₹5,035 can be re-entry zones
🎯 Target Zones: ₹6,485 followed by ₹8,829 for positional long
🛑 Invalidation: Below ₹5,000 zone
⚠️ Disclaimer: This is an educational chart setup and not trading advice. Please conduct your own research and risk management.
📣 Follow @PriceAction_Pulse for more such clean breakouts and chart pattern analysis!
🔁 Drop a comment if DIVISLAB is on your radar for the next breakout rally 📈
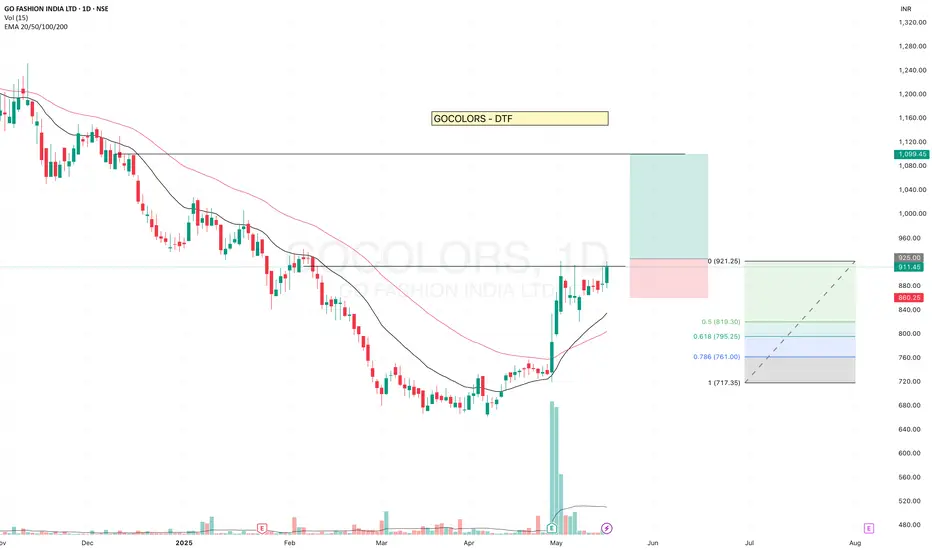
GOCOLORS - Getting ReadyGOCOLORS is getting ready and has been testing the resistance level.
- It is consistently trading above the 20 EMA. Recent high-volume candles suggest clear institutional participation. Although volume is currently drying up, the price is sustaining — a positive sign.
- The stock reversed after touching the 0.5 Fibonacci retracement level, indicating strength.
✅ If you like my analysis, please follow me as a token of appreciation :)
in.tradingview.com/u/SatpalS/
📌 For learning and educational purposes only, not a recommendation. Please consult your financial advisor before investing.
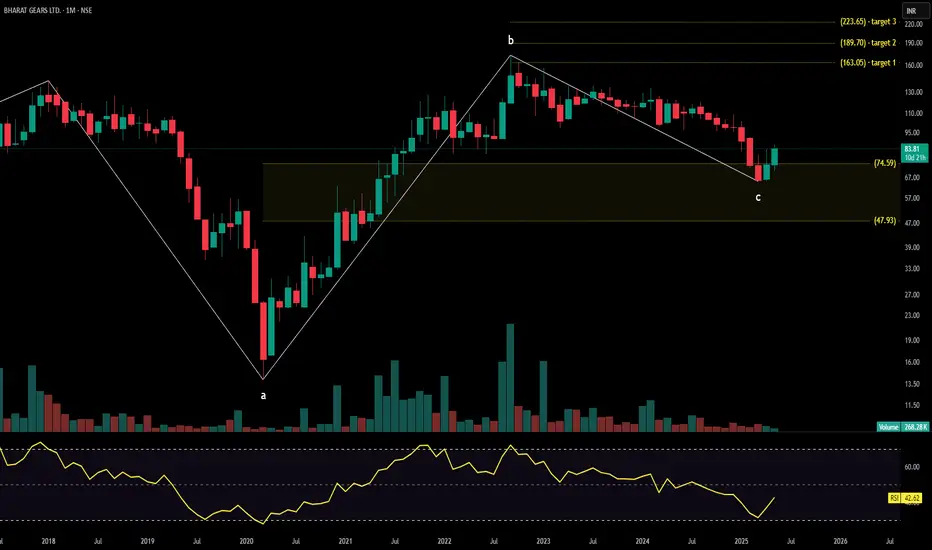
BHARAT GEARS technical analysisBHARAT GEARS LTD. (NSE: 83.81 INR) is a leading manufacturer of automotive gears and components, catering to both domestic and international markets.
Key Levels
- Support Levels: 47.93, 74.59
- Swing Level: 90.40
- Possible Upside Levels: 106.12, 163.05, 188.70, 223.65
Technical Indicators
- RSI: The Relative Strength Index (RSI) is currently at 42.62, indicating that the stock is neither overbought nor oversold, suggesting a neutral momentum.
- Volume: The trading volume is 268.28K, which shows a moderate level of trading activity, indicating a balanced interest among traders.
Sector and Market Context
BHARAT GEARS LTD. operates within the automotive sector, which has been experiencing a mixed performance due to fluctuating demand and supply chain disruptions. The overall market trends show a recovery phase post-pandemic, with increased focus on electric vehicles and sustainable automotive solutions. The company's performance is closely tied to the sector's cyclical nature and broader economic conditions. The automotive sector is expected to benefit from government initiatives promoting manufacturing and exports, which could positively impact BHARAT GEARS LTD.'s growth prospects.
Latest News and Development
- Recent market news indicates that BHARAT GEARS LTD. has been focusing on expanding its product portfolio and enhancing its manufacturing capabilities.
- Analysts have provided a mixed rating, with some optimistic about the company's strategic initiatives and others cautious due to market volatility.
- The latest quarterly results showed a steady revenue growth, with improved margins due to cost optimization measures.
- The company has announced a dividend payout, reflecting its commitment to returning value to shareholders.
Analysis Summary
BHARAT GEARS LTD. presents a balanced outlook with potential for growth driven by sector recovery and strategic initiatives. The key levels identified provide a framework for understanding potential price movements. The RSI and Volume indicators suggest a neutral momentum, indicating that the stock is currently in a consolidation phase. Investors should consider the broader market trends and sector performance when evaluating this stock. While the company shows promise, it is essential to stay updated with market developments and analyst ratings to make informed decisions.
Let me know if you'd like any further refinements!
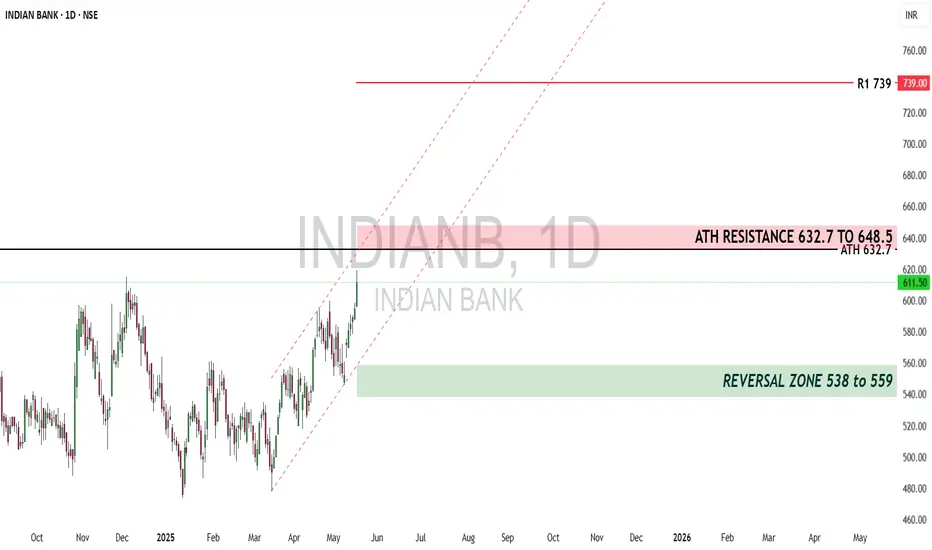
Is Indian Bank About to Explode? Big Breakout Ahead!Indian Bank is a fundamentally strong PSU bank stock trading near its All-Time High (ATH) of 632.7. With a bullish technical structure and improving financials, this stock presents an excellent opportunity for both traders and long-term investors. Below, we analyze its fundamentals and technical breakout potential.
Fundamentals
✅ Strong Profit Growth – Net profit up 37% YoY (₹2,119 Cr in FY24).
✅ Improving Asset Quality – Gross NPA ↓ to 3.95% (from 5.95%).
✅ Undervalued – P/B 0.9x, Dividend Yield 2.5%.
✅ Govt-Backed – PSU stability + credit growth tailwinds.
Technical Analysis (Breakout & Momentum Setup)
Current Price Action (as of May 19, 2025 Close: 611.5)
Trading near ATH (632.7) within a parallel bullish channel.
Breakout Zone: 632.7 – 648.5 (ATH resistance band).
A confirmed daily close above 648.5 before June 2, 2025, could trigger a strong bullish momentum.
Potential Targets if Breakout Sustains
R1: 738.9 (↑13.96% from ATH)
R2: 816 (↑23.83% from ATH)
R3: 948 (↑46.18% from ATH – Extended bullish case)
Reversal Scenario (If Breakout Fails )
Rejection Zone: If price fails to hold above 648.5, watch for a pullback to 538 – 559 (Key support & averaging zone).
Break below 538 could indicate a deeper correction.
Trade Strategy
For Traders (Breakout Play)
Entry: Wait for daily close above 648.5 (confirms breakout).
Targets: 738.9 → 816 → 948 (Trail SL accordingly).
Stop Loss: Below 620 (if breakout fails).
For Investors (Long-Term Accumulation)
Buy on Dips: Accumulate near 559-538 if correction occurs.
Hold for LT Targets: 950+.
Conclusion
Indian Bank is a high-probability breakout candidate with strong fundamentals. A confirmed breakout above 648.5 could lead to a 13-46% rally, while a rejection may offer a buying opportunity near 538-559.
Key Triggers to Watch:
Banking sector momentum (PSU banks in focus).
Q1 FY25 results (Due in July 2025).
Broader market trend (Nifty Bank support).
🚀 Trade Setup:
🔹 Breakout above 648.5 → Momentum to 738+
🔹 Rejection → Buy near 538-559 for long-term
Disclaimer : lnkd.in
Jio Financial Services – Wave 5 Exhaustion? Retracement AheadJio Financial Services has completed a clean 1-2-3-4-5 Elliott Wave sequence, with each leg respecting Fibonacci levels well. From the Wave 4 low, price rallied and reached the 100% Fibonacci extension of Wave 1, marking ₹279.35 as a potential Wave 5 termination point.
Key Technical Signals:
Complete 5-wave impulse structure
Wave 5 = 100% of Wave 1
Bearish RSI divergence at the top
Volume shows signs of exhaustion
These signals suggest that Wave 5 may have ended and a corrective phase could begin.
Retracement Levels to Watch:
A retracement from the top is expected toward:
0.236 level: ₹270.55
0.382 level: ₹265.10
Price action in this zone will help determine if this is just a correction or the start of a larger reversal.
Indicators Used:
Elliott Wave count
Fibonacci levels
RSI
Volume
Timeframe: 2H

CONCOR – Triangle Breakout with Fib Targets in SightCONCOR After weeks of coiling inside a symmetrical triangle, CONCOR has finally broken out above key resistance near ₹705 — backed by strong volume and price action.
Current Price: ₹730.50
Highlights:
Triangle Breakout Zone: ₹702.15 (Fib 38.2%)
Next Key Levels: ₹764.70 & ₹809.25 (61.8% & 78.6%)
Strong Support Zone: ₹663–₹645 (Fib 23.6% & horizontal base)
Also reclaiming the 200 EMA powerful trend confirmation.
Structure + Breakout + Fib Confluence = High Probability Setup
A close above ₹735+ may ignite momentum toward ₹767+ & ₹858+ zones.
Keep it on your radar.
#CONCOR #ContainerCorp #BreakoutAlert #TrianglePattern #FibLevels #NSEStocks #MomentumTrade #BullishBreakout #SwingTrading #IndianStocks #TradingSetup #ChartAnalysis #TechnicalBreakout #PriceAction

SKM EGG PRODUCTS technical analysisSKM Egg Products Export (India) Ltd. (NSE: SKMEGGPROD) is currently trading at INR 199.71. The company specializes in the production and export of processed egg products, catering to both domestic and international markets.
Key Levels
Support Level: INR 135.65
Swing Level: INR 226.43
Possible Upside Levels: INR 487.95, INR 578.75, INR 694.40
Technical Indicators
RSI: The Relative Strength Index (RSI) is currently at 46.54, suggesting neutral momentum. RSI indicates whether a stock is overbought or oversold, with values above 70 signaling overbought conditions and below 30 indicating oversold levels.
Volume: The trading volume is moderate, showing stable investor participation. Increased volume near key levels may confirm potential price action in either direction.
Sector and Market Context
SKM Egg Products operates within the food processing and export sector, which benefits from rising global demand for protein-based nutrition and processed food products. The industry is influenced by exchange rate fluctuations, commodity pricing, and regulatory changes in export policies. Additionally, increased consumer awareness of health-focused diets has contributed to sector growth, benefiting companies offering specialized products like SKM Egg. However, broader market trends, including inflation, global trade agreements, and supply chain efficiency, may affect stock performance.
Latest News and Development
Recent reports indicate SKM Egg has maintained steady export volumes, with increasing demand from European and Asian markets.
Analysts highlight potential expansion into newer geographic regions, which could drive revenue growth in the upcoming quarters.
The latest quarterly results show stable margins, though raw material costs have increased slightly, impacting operational efficiency.
SKM Egg Products has not declared a dividend in the recent quarter, reflecting a reinvestment strategy for expansion and production capacity enhancement.
Analysis Summary
SKM Egg Products exhibits balanced technical momentum, with key levels identified to gauge future price movements. While RSI suggests neutral sentiment, sector dynamics and export trends remain favorable for long-term growth. The company’s strategic expansion and steady demand support its outlook, though macroeconomic factors and industry-specific risks should be monitored.

ONWARD TECHNOLOGIES LTD📊 ONWARD TECHNOLOGIES LTD (1D) – CMP ₹313.00
📅 Published on: May 17, 2025
📈 Exchange: NSE
📌 Ticker: ONWARDTEC
🔍 Technical Chart Analysis
✅ Trendline Breakout:
A clean downtrend line breakout is visible on the daily chart, marking the end of a prolonged bearish phase. Price has decisively broken above the falling resistance trendline with a sharp bullish candle and strong volume confirmation.
✅ Volume Surge:
Breakout occurred with a 17.76% gain and significantly higher volume (1.23M), hinting at strong buying interest and possible institutional accumulation.
✅ Fibonacci Retracement Zones (from swing high ₹731.00 to low ₹207.30):
38.2% – ₹407.40
50.0% – ₹469.20
61.8% – ₹531.00
78.6% – ₹618.95
100% – ₹731.00
✅ Support Confirmation:
The price held the multi-year support zone around ₹207.97, which aligns with the 0.00% Fibo level, forming a strong base for reversal.
🧱 Key Support & Resistance Levels
🟩 Support Zones:
₹207.97 (Major long-term support)
₹265–270 (Breakout retest zone if pullback happens)
🟥 Resistance Zones (Fibonacci-based):
₹407.40 (38.2% FIB)
₹469.20 (50.0% FIB)
₹531.00 (61.8% FIB - Golden Ratio)
₹618.95
₹731.00 (Previous ATH)
📉 Timeframe: Daily (1D)
📈 Sentiment: Turning Bullish
💡 Conclusion:
After a long correction, ONWARDTEC has shown a breakout with strong volume from a downtrend line. Holding above ₹300 levels can open room for targets near ₹407–₹469 and beyond. A good setup for swing traders looking for reversal entries.
📌 Disclaimer:
This analysis is for educational and informational purposes only. Not financial advice. Please consult your advisor before making investment decisions.

INOX WIND LTD – Trend Reversal in Play?After 9 months of sideways consolidation, INOX just broke out of its base near ₹140–180 with strong momentum — signaling the start of a new bullish cycle.
Key Levels:
🔹 Breakout Zone: ₹180.80
🔹 Impulse Target 1 (Hit): ₹261.90
🔹 Next Fibonacci Target (161.8%): ₹343.90
🔹 Support on Dip: ₹211–₹196 (50–61.8% retracement zone)
Pattern in Progress:
🔹 Impulse Wave
🔹 Projected ABC Correction
🔹 Continuation Rally Ahead?
If the correction holds above ₹196 and consolidates, we could see a trend continuation toward ₹340+ in coming months.
Clean structure. Aligned Fibonacci. Momentum is real.
#INOXWIND #TrendReversal #FibLevels #BreakoutStocks #NSEStocks #MomentumTrading #ABCPattern #FibonacciTrading #WindEnergy #IndiaStocks #TechnicalAnalysis #SwingTrade #ChartSetup #BullishTrend #VolumeBreakout #PriceAction
