NIFTY daily Retrace 61% from bottomHello everyone,
Nifty spot 24340 consolidating since 2 weeks within range of 24000 to 24500 rsi negative divergnve is there on daily time aong with fibbonacci 61% retrace from bottom volume is not supporting bullish breakout away from 200 ema can expect bearish move till 23500 trendline support.
Fibonacci

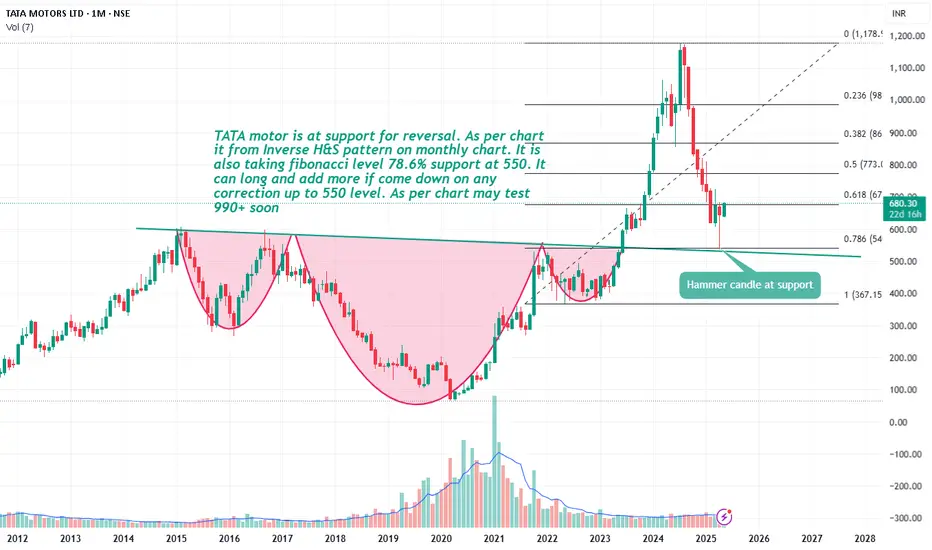
Tata motor long on any correction.TATA motor is at support for reversal. As per chart it from Inverse H&S pattern on monthly chart. It is also taking fibbonacci level 78.6% support at 550. It can long and add more if come down on any correction up to 550 level. As per chart may test 990+ soon.
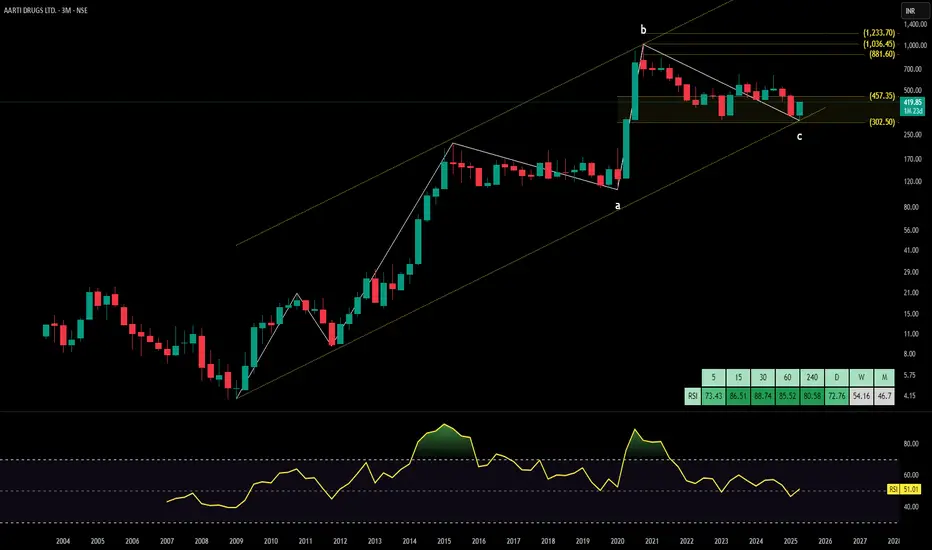
AARTI DRUGS technical analysisAarti Drugs Ltd. (NSE: AARTIDRUGS) is currently priced at INR 419.85. The company operates in the pharmaceutical sector, specializing in the manufacturing of bulk drugs, active pharmaceutical ingredients (APIs), and formulations.
Key Levels
Support Level: INR 302.50
Swing Level: INR 437.35
Possible Upside Levels: INR 586.30, INR 881.60, INR 1,036.45, INR 1,233.70
Technical Indicators
RSI: The Relative Strength Index (RSI) is currently at 51.01, indicating neutral momentum. RSI values between 30 and 70 typically suggest that the stock is neither overbought nor oversold.
Volume: The trading volume stands at 12.36M, reflecting moderate activity. Higher volume during price increases signals strong buying interest, while lower volume during declines suggests weak selling pressure.
Sector and Market Context
Aarti Drugs Ltd. operates within the pharmaceutical sector, which has demonstrated resilience and growth potential, particularly in the wake of increased healthcare demand. The broader market trends indicate cautious optimism, with investors seeking stable and growth-oriented stocks. The pharmaceutical sector is expected to benefit from ongoing healthcare advancements, regulatory support, and increasing demand for APIs and formulations. However, global economic conditions and sector-specific challenges may influence stock performance.
Risk Considerations
Regulatory Changes: Any modifications in pharmaceutical regulations or policies could impact the company’s operations and profitability.
Market Competition: The pharmaceutical space is highly competitive, with new entrants and existing players posing challenges.
Economic Factors: Macroeconomic conditions, such as inflation and currency fluctuations, can influence the stock’s performance.
Company-Specific Risks: Operational challenges, product recalls, or negative clinical trial results can adversely affect the stock price.
Analysis Summary
Aarti Drugs Ltd. exhibits growth potential within the pharmaceutical sector, supported by its strong presence in API manufacturing. The stock is currently in a neutral momentum phase, with key levels indicating possible upside opportunities. Investors should weigh the risks associated with market volatility, regulatory changes, competitive pressure, and economic factors. A balanced approach, considering both growth prospects and associated risks, is advisable for making informed investment decisions.
Polycab - Descending Broadening WedgeCables have good demand. Polycab making bullish breakout from descending broadening wedge pattern and the subsequent targets are 5528.50, 5929.85, 6403.60 and the weekly pivot is at 6494.00. Around this level is 61.8% fib level 6427.55 so there is more supply (selling) in this point.

XAUUSD Bullish Breakout with Retest & Rally Setup (1H Chart) Pair: XAUUSD (Gold vs US Dollar)
Timeframe: 1 Hour (1H)
Market Bias: Bullish
Strategy Type: Trendline Breakout + Order Block Retest + Liquidity Sweep + Momentum Continuation
📊 Technical Analysis:
🔹 1. Trendline Breakout:
A major descending trendline (bearish structure) was cleanly broken with strong bullish momentum.
This is a market structure shift and indicates potential trend reversal or at least a short-term bullish rally.
🔹 2. Break of Structure & Demand Zones:
Price broke above a key resistance zone (previous supply) around 3360, turning it into support/demand.
A new bullish order block (OB) is visible just below current price (~3340–3350), now acting as an entry zone.
A lower OB zone (~3300–3320) has been left unmitigated, which could act as a second deeper entry point if price retraces further.
🔹 3. Imbalance/Fair Value Gap (FVG):
There is a clean imbalance left between the current price and the lower OB. Price may wick into this zone before rallying.
This imbalance is acting like a magnet and could invite a retracement into the 3340–3320 zone.
🔹 4. Liquidity Engineering:
Buy-side liquidity was likely swept above the trendline break and recent highs.
Sellers trapped above the trendline may give fuel for a deeper push toward the next supply zone.
🔹 5. Target Supply Zone:
A clean and unmitigated supply zone lies between 3480–3500, the ultimate target for bulls if momentum sustains.
📍 Key Levels:
Type Price Range (Approx)
Current Price 3360.90
Entry Zone 1 (OB 1H) 3340 – 3350
Entry Zone 2 (OB 1H) 3300 – 3320
Target Supply Zone 3480 – 3500
Invalidation Below 3300
🎯 Trade Idea:
Entry: On bullish confirmation at 3340–3350 or deeper at 3300–3320
Stop Loss: Below 3300 (structure break + OB invalidation)
Target: 3480–3500 (clean supply zone above)
Risk-to-Reward (R:R): ~1:3 to 1:5 depending on entry zone
✅ Confluences Supporting This Setup:
✅ Trendline break + retest setup
✅ Price flipped previous resistance into support
✅ Strong bullish impulse breaking structure
✅ Bullish Order Block + Fair Value Gap (FVG) below price
✅ Clean upside liquidity pool in untested supply zone
✅ Momentum breakout candle confirms buyer strength
⚠️ Invalidation Criteria:
Breakdown and 1H close below 3300 invalidates the OB and bullish structure.
Be cautious around NFP or Fed-related news, which may spike volatility.
🔁 Potential Scenarios:
📈 Bullish Continuation:
Price retests OB (3340–3350), finds support, and rallies directly to 3480–3500.
🔁 Deeper Retracement:
Price may wick into the lower OB at 3300–3320 to grab liquidity, then rally.
❌ Invalidation:
Breakdown below 3300 = bearish reversal or deeper correction incoming.
📘 Summary Table:
Parameter Value
Bias Bullish
Entry Zone(s) 3340–3350 (primary), 3300–3320
Stop Loss Below 3300
Take Profit 3480–3500
Strategy Trendline Break + OB Retest + Imbalance
Confluences Break of Structure, Demand Zones, FVG, Trendline Break

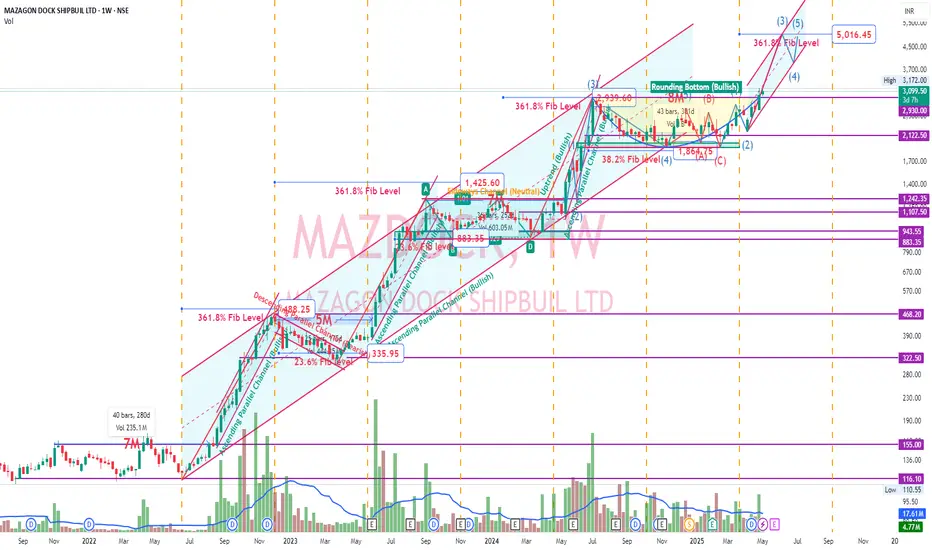
Mazdock - Undocked after 8M Rounding BottomMazdock renowned shipbuilding company has constructed 801 vessels since 1960, including warships, submarines, cargo/passenger ships, and offshore platforms.
Order Book
As of Q2 FY25, the company’s total order book was Rs. 39,872 Cr, which includes 37 vessels scheduled for delivery.
Order Book Mix:
Shipbuilding: 70%
Submarine and Heavy Engineering: 30%
Fundamentals
Company has excellent fundamentals with ROE and ROCE above 20% and increasing. Negative working capital, Debt free, increasing sales and profit with dividend payout of around 29%. Stellar Operating profit margin and rising along with increase in stakes of both DII and FII in recent quarter.
Technicals
On observing the chart, We could witness stock roaring 100% atleast after every consolidation of around 5-8 months. History tend to repeat itself. Fundamentals are good. Overall aerospace and defense sector are in good position. Check that custom index chart which was published. Mazdock has the potential to reach 5K which is 361.8% Fib level. In past, it has always reached that fib level. Pivot R3 is also around 5278.45. We can also see that breakout of rounding bottom pattern has occurred.
Disclaimer: Learning Purpose
HINDUSTAN MOTORS technical analysisHindustan Motors Ltd. (NSE: HINDMOTORS) is currently priced at INR 24.83. The company is an Indian automotive manufacturer known for producing the iconic Ambassador car. It is engaged in the manufacturing and sale of vehicles, spare parts, and accessories.
Key Levels
Support Level: INR 20.07
Swing Level: INR 26.17
Possible Upside Levels: INR 32.82 INR 42.98 INR 49.08 INR 56.85
Technical Indicators
RSI (Relative Strength Index): The RSI is currently at 53.05, indicating a neutral position. RSI measures the speed and change of price movements and helps identify overbought or oversold conditions.
Volume: The volume is at 2.03M, reflecting the number of shares traded. High volume often signals strong investor interest and potential price movements.
Sector and Market Context
The automotive industry is evolving with advancements in technology and shifting consumer preferences. The growing focus on electric vehicles (EVs) and sustainability is reshaping market dynamics, with government incentives like the FAME program driving adoption in India. Hindustan Motors operates in a competitive environment where fuel price fluctuations, inflation, and interest rates can impact demand. While legacy automakers must adapt to these trends, strong brand recognition gives Hindustan Motors an opportunity to pivot toward modern innovations and remain relevant in a transforming sector.
Risk Considerations
Market Volatility: The stock market is inherently volatile, and sudden changes in market conditions can impact the stock’s price.
Economic Factors: Interest rate fluctuations, inflation, and economic growth trends can influence the company’s financial performance.
Industry Competition: The automotive industry is highly competitive, requiring continuous innovation and adaptation to market trends.
Regulatory Changes: Government policies and regulations related to the automotive sector can affect the company’s operations and profitability.
Analysis Summary
Hindustan Motors Ltd. presents a neutral RSI, suggesting that the stock is neither overbought nor oversold. The volume indicates moderate investor interest. The identified key levels provide potential support and resistance points that may guide future price movements. The company’s performance is closely tied to sector trends and overall market conditions. Investors should consider the potential risks and broader market context before making any investment decisions.
HLong

Gold (XAU/USD) 1-Hour Chart: Potential Bullish Reversal SetupOverview:
The market has recently shown a change of character (ChoCh), indicating a shift from a bearish to a potential bullish trend. After reaching key support levels, gold has started to consolidate, and we could be seeing the start of an upward movement.
Key Levels to Watch:
Support Zone: The price has bounced off the support at 3,222.38, which aligns with the 50% Fibonacci retracement.
Resistance Zone: The key resistance is at 3,294.87, which may act as a strong level for profit-taking if the price continues its upward move.
Potential Entry:
Buy Entry: Look for an entry around the current price of 3,240.40, after the price breaks through minor resistance or retraces slightly for confirmation.
Stop Loss: Set your stop loss at 3,222.38 (the recent swing low) for a controlled risk.
Take Profit: Aiming for the next resistance zone at 3,290.00 or 3,300.00.
Risk-to-Reward:
With a stop loss set at 3,222.38 and a take-profit target of 3,290.00, the trade offers a favorable risk-to-reward ratio of 1:2.
Market Sentiment:
The recent change of character suggests that the market may be reversing, so a bullish trend continuation is expected.
Keep an eye on volume and price action to confirm the breakout and ensure the setup is valid.
Trade Management:
Watch for any signs of a breakout at 3,294.87, as it would confirm the uptrend. Adjust your stops if the price moves in your favor.

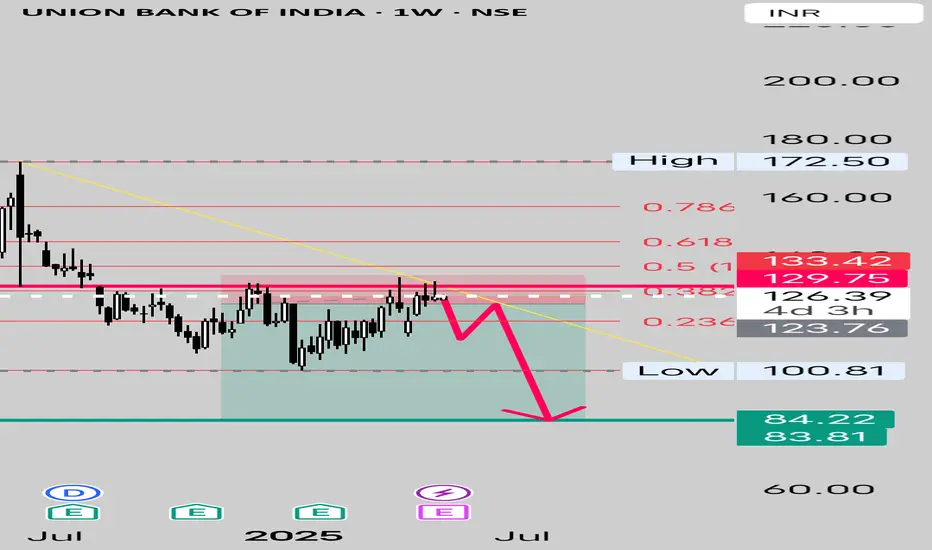
Union Bank under Pressure as Credit Costs expected to RiseUnion Bank is Technically Facing Selling Pressure around 130 Zone
In days to come Some more correction towards 80~90 (Demand Zone) is likely in Union Bank if it continues to Trade Under the Supply Zone at 130.
Watch The Trendline to Manage Your Positions.
All The Best 👍
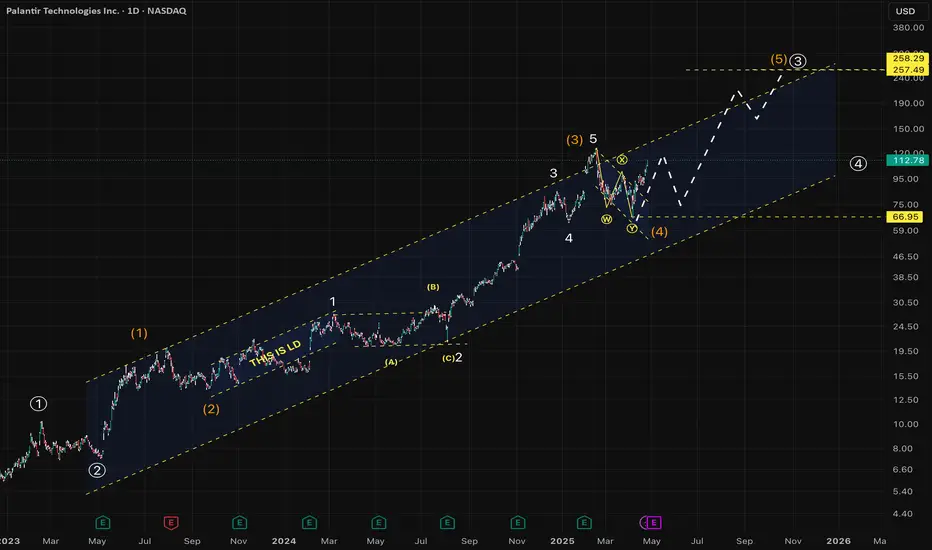
Can PLTR reach 250 in ~1.5Yrs ?PLTR seems to have completed complex correction and moving in a impulse structure towards a larger goal of 250 in 1 to 1.5yrs to complete its larger degree Wave-3.
Invalidation level:
Daily close below ~66.95 and below...
BIRLANU technical analysisBirlaNu Ltd is listed on the NSE with a current price of INR 2,067.80. The company operates as a diversified conglomerate with interests spanning textiles, cement, financial services, and telecommunications.
Key Levels
Support Level: INR 1853
Swing Level: INR 3494
Possible Upside Levels: INR 5461, INR 6509, INR 7844
Technical Indicators:
RSI (Relative Strength Index): Currently at 39.84, indicating that the stock is approaching oversold territory, which could suggest a potential buying opportunity if the trend reverses.
Volume: The trading volume stands at 120.15K, reflecting significant investor activity. Higher volume often signals stronger market interest and can precede price movements.
Sector and Market Context:
BirlaNu Ltd operates across multiple sectors, including financial services, telecommunications, cement, and textiles, leveraging its diversified presence to mitigate sector-specific risks. The financial services division benefits from India's growing digital adoption, though regulatory changes and interest rate fluctuations remain key considerations. In telecommunications, competitive pricing and 5G expansion drive growth, but high capital expenditure and policy shifts could impact profitability. Meanwhile, cement and textiles are supported by infrastructure demand and strong exports, though global economic conditions and raw material costs influence margins. The broader Indian market has shown resilience despite global volatility, with domestic consumption and policy support acting as stabilizing factors. Given BirlaNu’s exposure across industries, its stock performance is shaped by sector-specific developments, macroeconomic trends, and investor sentiment.
Risk Considerations:
Market Volatility: Fluctuations in the broader market can influence the stock’s price.
Sector-Specific Risks: Regulatory changes, economic downturns, or adverse events in any of the company’s operating sectors may affect performance.
Company-Specific Risks: Operational challenges, management decisions, or financial health concerns within BirlaNu Ltd could impact stock valuation.
Analysis Summary:
BirlaNu Ltd presents potential growth opportunities due to its diversified business model and current technical indicators. The RSI suggests the stock is nearing oversold conditions, which might indicate a reversal. The volume reflects strong investor interest, a positive sign for future price movements. However, investors should remain cautious of market volatility and sector-specific risks. Monitoring key levels and broader market trends will be essential for making informed decisions.

AUDUSD Bullish Breakout and Retest Setup (2H Timeframe)🧾 Pair: AUDUSD
Timeframe: 2-Hour
Bias: Bullish
Strategy Type: Breakout + Retest + Imbalance Fill + Supply Targeting
📊 Market Structure Analysis:
AUDUSD was consolidating in a range for several days between approximately 0.6380 and 0.6435.
A clean bullish breakout has now occurred, breaking above the resistance zone around 0.6435–0.6440.
Price is retesting the broken resistance, which aligns with a fresh demand zone (newly formed OB).
A minor imbalance below price is being tested as price retraces, creating a healthy structure for a potential continuation move.
The target zone is a higher timeframe supply zone (~0.6525–0.6535), which has not been tested recently and offers clean RR.
📍 Key Levels:
Demand Zone (Entry Area): 0.6440 – 0.6428
Imbalance Fill Support: 0.6428
Target Supply Zone: 0.6525 – 0.6535
Current Price: 0.6445 (hovering around entry zone)
🎯 Trade Plan:
Entry: 0.6440 (after confirmation of bullish rejection from demand zone)
Stop Loss: 0.6420 (below imbalance + invalidation of bullish order block)
Take Profit: 0.6527 (prior supply zone)
Risk-to-Reward (R:R): ~1:4
✅ Confluences Supporting the Setup:
✅ Breakout of Consolidation Range (classic breakout structure).
✅ Retest of previous resistance as support, confirming the breakout.
✅ Newly formed bullish OB in the retest zone.
✅ Imbalance zone below adds magnetism and builds confluence.
✅ Clear upside target at clean supply (unmitigated).
✅ Momentum candle breakout suggests strong bullish intent.
⚠️ Invalidation Criteria:
If price breaks and closes below 0.6420, the bullish structure is broken.
Be cautious around high-impact USD news (NFP, FOMC, CPI), which could cause liquidity spikes.
💡 Pro Tip:
If unsure about direct entry, look for 15M–1H bullish CHoCH (change of character) or bullish engulfing candle confirmation in the OB zone for a lower-risk entry.
📘 Summary:
Direction: Long
Zone of Interest: 0.6440 – 0.6428 (demand + OB)
Target: 0.6525 – 0.6535 (clean HTF supply)
Risk-Reward: Excellent (1:4+)

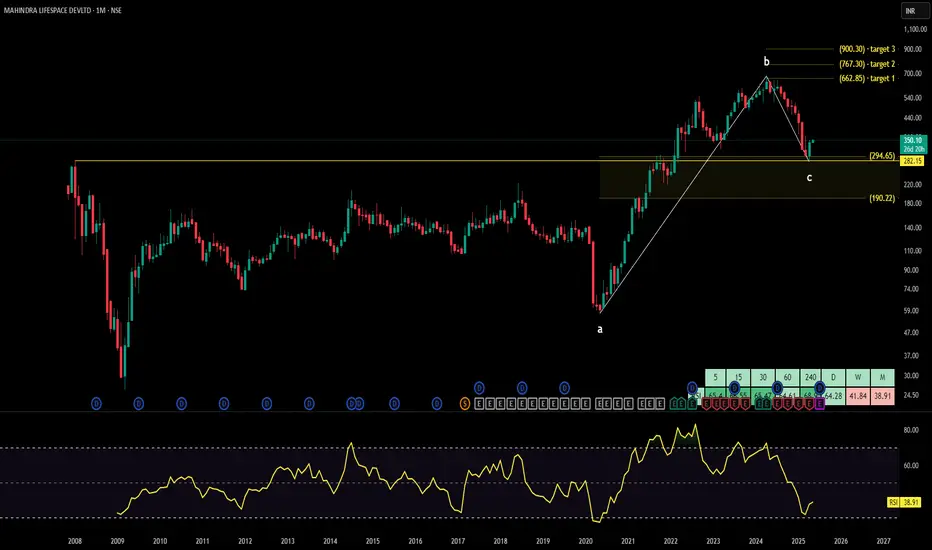
MAHINDRA LIFESPACE technical analysisMahindra Lifespace Developers Limited (NSE: MAHINDRA LIFESPACE DEVLTD), current price: INR 350.10. The company is a real estate and infrastructure development firm under the Mahindra Group, specializing in residential and commercial projects, integrated cities, and industrial clusters.
Key Levels
Support Level: INR 294.65
Swing Level: INR 373.10
Possible Upside Levels: INR 662.85, INR 767.30, INR 900.30
Technical Indicators
RSI: The Relative Strength Index (RSI) is currently at 38.91, indicating that the stock is approaching oversold territory, which may suggest a potential buying opportunity if the trend reverses.
Volume: The trading volume is 498.52K, showing a significant increase in activity, which could indicate heightened investor interest and potential volatility.
Sector and Market Context
Mahindra Lifespace Developers Limited operates within the real estate sector, which has shown mixed performance due to varying market conditions, regulatory changes, and economic factors. The overall market trends indicate cautious optimism with gradual recovery post-pandemic, but the sector remains sensitive to interest rate changes, government policies, and economic growth indicators. The stock’s performance should be monitored in relation to these broader market trends and sector-specific developments.
Risk Considerations
Economic Downturn: A slowdown in economic growth could negatively impact the real estate sector, affecting demand for residential and commercial properties.
Regulatory Changes: Government policies, such as taxation or real estate regulations, could influence the company’s operations and profitability.
Interest Rate Fluctuations: Rising interest rates could increase borrowing costs for both the company and potential buyers, potentially dampening demand.
Market Sentiment: Investor sentiment and market volatility could lead to unpredictable stock movements, influenced by broader market trends and news events.
Analysis Summary
Mahindra Lifespace Developers Limited shows potential for recovery with key support and swing levels identified. The RSI indicates the stock is nearing oversold territory, which may present a buying opportunity if the trend reverses. Increased trading volume suggests heightened investor interest, but caution is advised due to potential risks such as economic downturns, regulatory changes, and interest rate fluctuations. Investors should monitor sector and market trends closely and consider risk factors before making investment decisions.
Tata motor sign of correction.As per chart analysis stock is trading in LL & LH pattern. It is facing resistance at 78.6%.
Candle pattern showing evening star pattern which is sign correction. It may test 580 soon.

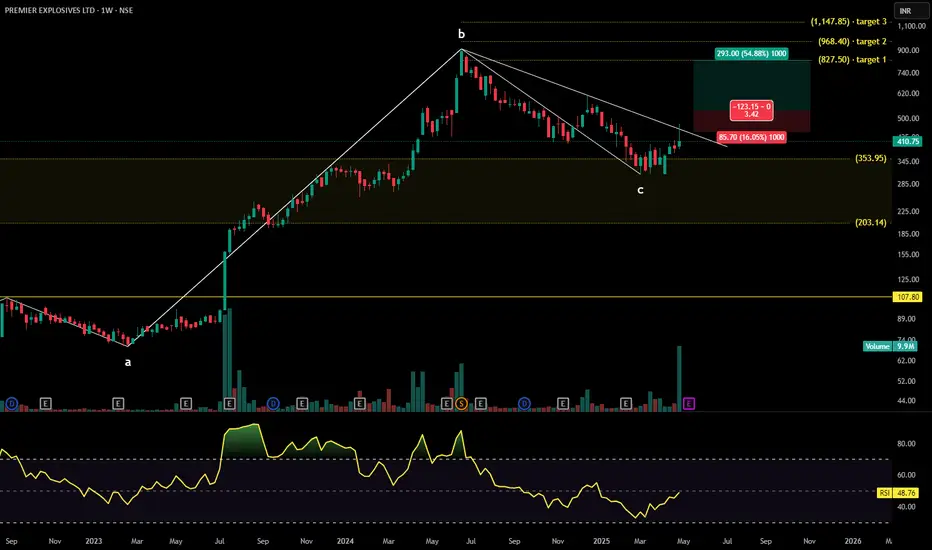
PREMIER EXPLOSIVES technical analysisPremier Explosives Ltd, NSE, current price: INR 410.75. The company specializes in the manufacturing of high-energy materials, including industrial and defense-grade explosives, and is a key supplier to India's defense and aerospace sectors.
Key Levels:
Support Level: INR 107.80
Swing Levels: INR 353.95, INR 450.65, INR 538.20
Possible Upside Levels: INR 827.50, INR 968.40, INR 1,147.85
Technical Indicators:
Relative Strength Index (RSI): Currently at 48.76, indicating neutral momentum. The RSI measures the speed and change of price movements, helping identify overbought or oversold conditions.
Volume: Trading volume is at 9.9 million, showing a significant increase in activity, which suggests growing investor interest and potential accumulation.
Sector and Market Context:
Premier Explosives Ltd operates within the defense and industrial explosives sector, which has gained traction due to heightened government spending and increasing demand from defense and infrastructure projects. The broader market has exhibited bullish tendencies, particularly among stocks linked to national security and industrial expansion. The sector's momentum is supported by geopolitical factors and policy initiatives aimed at boosting domestic defense manufacturing. However, market-wide corrections and regulatory shifts can influence its trajectory.
Risk Considerations:
Market Volatility: Broader economic cycles and market corrections can lead to price fluctuations.
Geopolitical Factors: Changes in defense policies and international trade agreements could impact demand.
Regulatory Adjustments: Compliance and policy shifts may alter operational costs or market positioning.
Competitive Pressures: Emerging players and technological advancements could affect pricing and market share.
Analysis Summary:
Premier Explosives Ltd has demonstrated strong momentum, reinforced by sectoral growth and increasing trading activity. Key technical indicators suggest neutral momentum with rising investor participation. While the stock has significant upside potential based on historical price action, investors should remain cautious due to external risk factors such as geopolitical changes and broader market volatility. Balancing these considerations, the stock presents an intriguing opportunity within the defense and industrial chemicals space, provided investors maintain a strategic and risk-aware approach.
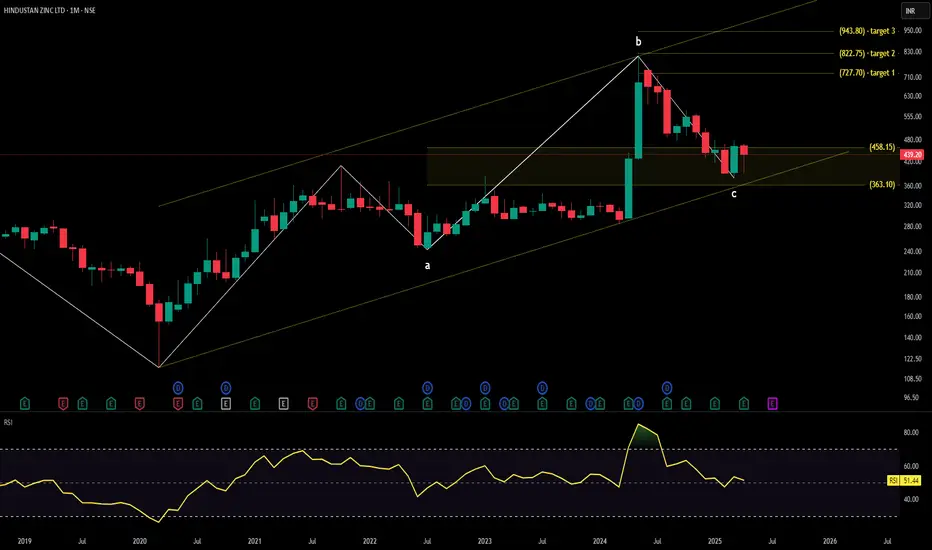
HINDUSTAN ZINC technical analysisHindustan Zinc Ltd. (NSE: HINDZINC) is currently trading at INR 439.20. The company is a leading producer of zinc, lead, and silver in India and operates as a subsidiary of Vedanta Limited.
Key Levels:
Support Level: INR 368 - 458
Swing Level: INR 542
Possible Upside Levels: INR 727.70, INR 822.75, INR 943.80
Technical Indicators:
RSI (Relative Strength Index): The RSI is currently at 51.44, indicating a neutral position. RSI is a momentum oscillator that measures the speed and change of price movements.
Volume: The volume for the current period is 38.99 million. Volume represents the number of shares traded in a given period. High volume can indicate strong investor interest and potential price movement, while low volume can suggest a lack of interest and possible price stagnation.
Sector and Market Context:
Hindustan Zinc Ltd. operates in the metals and mining sector, which has been experiencing volatility due to fluctuating commodity prices and global economic conditions. The overall market trend has been influenced by factors such as inflation, interest rate changes, and geopolitical events. Within its sector, Hindustan Zinc Ltd. has demonstrated resilience due to its strong market position and diversified product portfolio.
Risk Considerations:
Commodity Price Fluctuations: The prices of zinc, lead, and silver can be highly volatile, impacting the company's revenue and profitability.
Regulatory Changes: Environmental regulations and mining policies can affect the company's operations and costs.
Global Economic Conditions: Economic slowdowns or recessions can reduce demand for industrial metals, negatively impacting the company's performance.
Currency Exchange Rates: As an exporter, the company is exposed to currency exchange rate fluctuations, which can affect its earnings.
Analysis Summary:
Hindustan Zinc Ltd. has shown stable performance. The RSI indicates a neutral position, suggesting that the stock is neither overbought nor oversold. The volume suggests moderate investor interest. While the company is well-positioned in the metals and mining sector, potential risks such as commodity price fluctuations and regulatory changes should be considered. Investors should monitor these factors closely and evaluate the overall market context before making investment decisions.
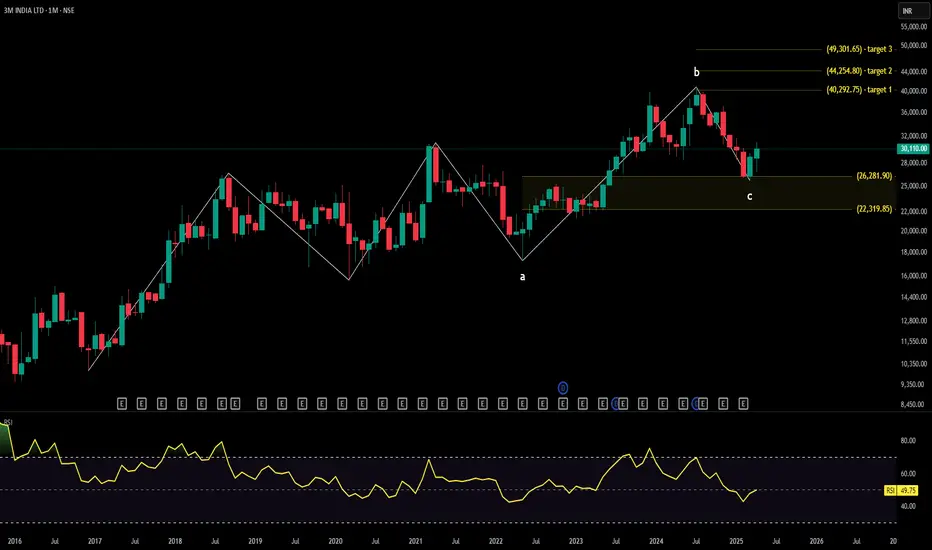
3M technical analysisStock Overview
3M India Ltd. (NSE: 3MINDIA) is currently priced at INR 30,110.00. The company operates in the industrial sector, providing diversified technology and science solutions across various industries, including healthcare, consumer goods, and safety products.
Key Levels
Support: 26,281.90, 22,319.85
Upside Swing Zone: 31,501.00, 29,290.80
Possible Upside Levels: 40,292.75, 44,254.80, 49,301.65
Technical Indicators
RSI: The Relative Strength Index (RSI) is currently at 49.75, indicating a neutral position. RSI is a momentum oscillator that measures the speed and change of price movements, typically used to identify overbought or oversold conditions.
Volume: The volume is 83.04K, which shows the number of shares traded. Volume is a critical indicator of market activity and liquidity, helping to confirm price movements and trends.
Sector and Market Context
3M India Ltd. operates within the industrial sector, which has shown resilience and growth potential in recent years. The overall market trends indicate a mixed performance, with some sectors experiencing growth while others face challenges due to economic conditions. The industrial sector, in particular, has benefited from increased demand for technology and science-based solutions, positioning 3M India Ltd. favorably within its market.
Risk Considerations
Market Conditions: Economic downturns or unfavorable market conditions could negatively impact the stock's performance.
Sector-Specific Risks: Changes in regulations, technological advancements, or shifts in consumer demand within the industrial sector could influence the stock's movement.
Company-Specific Risks: Operational challenges, supply chain disruptions, or financial performance issues could pose risks to the stock's future performance.
Analysis Summary
3M India Ltd. shows a balanced technical outlook with key support and upside levels identified. The RSI indicates a neutral position, suggesting neither overbought nor oversold conditions. The volume reflects healthy market activity. While the industrial sector presents growth opportunities, potential risks from market conditions and sector-specific factors should be considered. Investors should monitor these key levels and indicators to make informed decisions, keeping in mind the broader market and sector context. This analysis provides a comprehensive view of the stock's technical position without making direct buy or sell recommendations.
PERSISTENT SYSTEMS technical analysisStock Overview:
Persistent Systems Ltd. (NSE: PERSISTENT) is currently trading at INR 5,404.00. The company specializes in software product development and technology services, offering solutions in areas such as cloud computing, data analytics, and enterprise software.
Key Levels:
Support Level: INR 3,993.20
Upside Swing Zone: INR 5,157.40
Possible Upside Levels:
INR 6,347.10
INR 6,944.65
INR 7,705.80
Technical Indicators:
RSI (Relative Strength Index): The RSI is currently at 50.38, indicating neutral momentum. RSI measures the speed and change of price movements, with values above 70 typically indicating overbought conditions and values below 30 indicating oversold conditions.
Volume: The trading volume is 1.34M, providing insight into the strength of price movements. Higher volume often indicates stronger conviction behind price trends, while lower volume may suggest weaker momentum.
Sector and Market Context:
Persistent Systems Ltd. operates in the technology sector, which has shown resilience and growth potential in recent years. The overall market trends for the technology sector have been positive, driven by increasing demand for digital transformation and technological advancements. However, the sector is also subject to volatility due to rapid changes in technology and market dynamics.
Risk Considerations:
Market Conditions: The stock's movement may be influenced by broader market conditions, including economic indicators, interest rates, and geopolitical events.
Sector-Specific Risks: The technology sector is highly competitive and subject to rapid technological changes, which could impact the company's performance.
Company-Specific Risks: Persistent Systems Ltd. may face risks related to its business operations, such as project execution, client concentration, and regulatory changes.
Analysis Summary:
Persistent Systems Ltd. has maintained stability in its technical indicators, with the RSI reflecting neutral momentum and trading volume suggesting moderate participation. The stock is positioned within a favorable zone that could lead to further movement based on market conditions and sector performance. The broader technology sector remains robust but susceptible to shifts in demand and innovation cycles. Investors should remain mindful of external market influences, sector-specific risks, and company fundamentals when assessing potential opportunities.

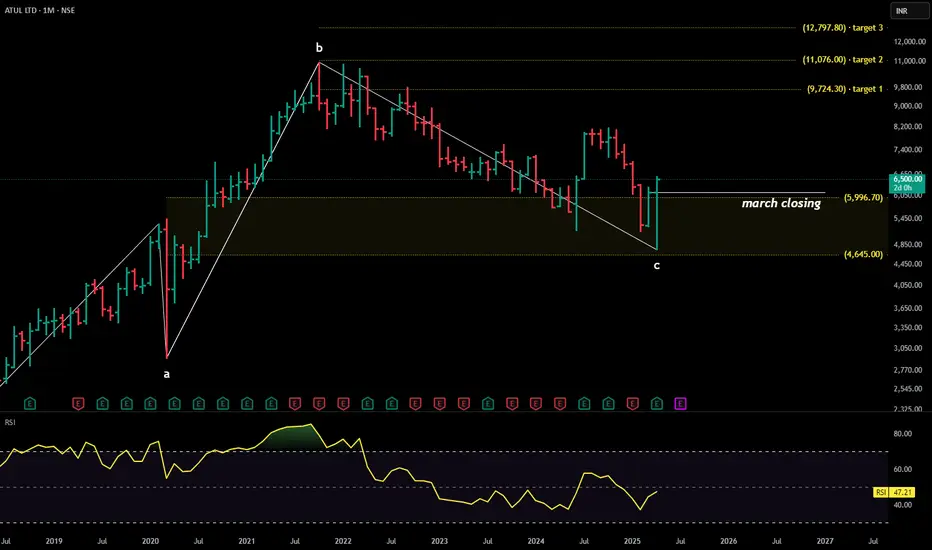
ATUL technical analysisStock Overview: ATUL LTD, listed on the NSE, is currently priced at INR 6,500.00. The company specializes in manufacturing chemicals across diversified industries such as agriculture, pharmaceuticals, and textiles, with a strong focus on innovative solutions.
Key Levels:
Support: 4,645 - 5,996
Upside swing zone: 6219 - 7126
Possible upside levels: 9724, 11076, 12979
Technical Indicators:
RSI (Relative Strength Index): At 47.21, the RSI shows a neutral momentum, indicating that the stock is neither overbought nor oversold. This suggests balanced sentiment without immediate direction bias.
Volume: The current trading volume stands at 3.33M, demonstrating a notable surge compared to previous levels.
Sector and Market Context: ATUL LTD operates in the chemical sector, which has exhibited steady growth amid economic uncertainties, benefiting from surging demand in industries like pharmaceuticals and agriculture. The company's diversified product portfolio positions it well to tap into such growing markets. However, broader market trends are mixed, with global geopolitical tensions and supply chain challenges influencing sector stability. Despite these factors, ATUL LTD has maintained a consistent performance trajectory, leveraging strong fundamentals and market adaptability.
Risk Considerations:
Sector-Specific Risks: Fluctuations in raw material costs and stringent regulatory changes could impact profitability.
Company-Specific Risks: Operational inefficiencies, competitive pressures, and management decisions remain key considerations affecting stock performance.
Analysis Summary: ATUL LTD presents an intriguing case in the chemical sector with well-defined support and upside levels, signaling a balanced technical setup. While the broader chemical sector and market trends provide room for optimism, investors should carefully evaluate potential risks, including regulatory changes and market conditions.
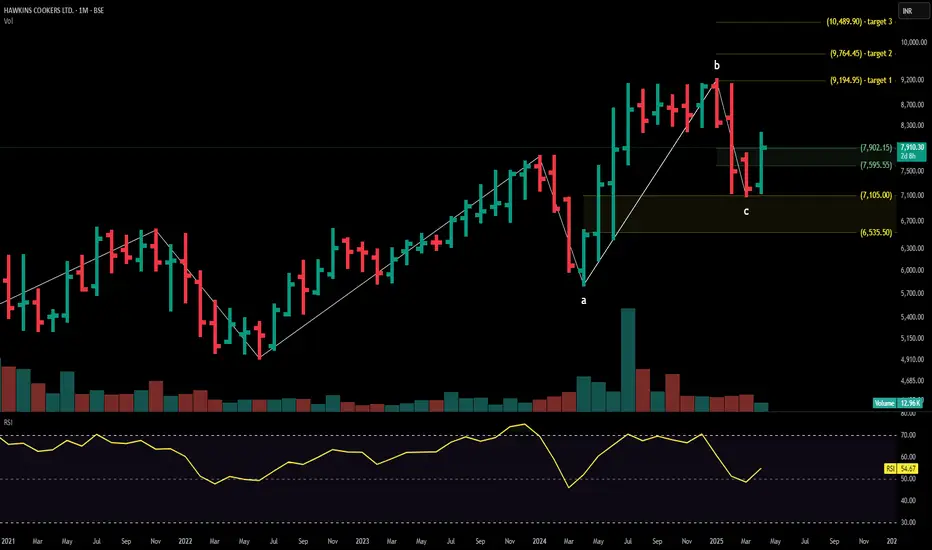
HAWKINS technical analysisStock Overview: Hawkins Cookers Ltd., BSE, current price: ₹7,910.30. Hawkins Cookers Ltd. is a trusted manufacturer of high-quality pressure cookers and cookware, catering to the growing needs of domestic and international markets.
Key Levels:
Support levels: ₹6,535.50, ₹7,105.00
Upside swing zone: ₹7,595.55, ₹7,902.15
Possible upside levels: ₹9,194.95, ₹9,764.45, ₹10,489.90
Technical Indicators:
RSI (Relative Strength Index): The current RSI is at 54.67, indicating a neutral momentum.
Volume: The trading volume is 12.96K, reflecting stable investor activity.
Sector and Market Context: Hawkins Cookers Ltd. operates in the consumer goods sector, particularly in the kitchen appliances niche. This sector has demonstrated resilience, buoyed by increasing urbanization, rising consumer income, and demand for quality appliances. The stock's performance aligns with the sector's growth trajectory, which is positively influenced by innovation and expanding distribution networks. However, the broader market trends remain cautious due to macroeconomic uncertainties and inflationary pressures, with selective recovery across various industries.
Risk Considerations:
Competition: The presence of other strong players in the kitchen appliances industry may impact market share.
Supply Chain Factors: Delays or rising costs in raw materials and logistics could affect production efficiency and margins.
Regulatory Environment: Changes in policies or taxation could create operational challenges for the company.
Analysis Summary: Hawkins Cookers Ltd. demonstrates a steady outlook. The consumer goods sector’s overall growth prospects align favorably with the company’s performance, although potential risks like market volatility, competition, and supply chain disruptions should not be overlooked. Investors may find Hawkins Cookers Ltd. a reliable candidate for monitoring, with room for steady performance subject to market dynamics and sectoral developments.
CASTROL technical analysisStock Overview: Castrol India Ltd, NSE, current price: INR 202.98. Castrol India Ltd is a prominent player in the manufacturing and marketing of automotive and industrial lubricants, greases, and related products, with a strong presence in the automotive sector.
Key Levels:
Support levels: INR 191.34, INR 169.85, INR 138.71.
Upside swing zone: INR 209.13.
Possible upside levels: INR 277.15, INR 308.30, INR 347.95.
Technical Indicators:
RSI (Relative Strength Index): The RSI is currently at 54.44, indicating a neutral stance. This suggests that the stock is neither overbought nor oversold, reflecting balanced momentum. Typically, RSI above 70 suggests overbought conditions, while below 30 indicates oversold zones.
Volume: The trading volume stands at 84.45M, showcasing active investor participation. Higher peaks in trading volume highlight periods of heightened investor interest, which may signal forthcoming price volatility or pivotal movements.
Sector and Market Context: Operating in the lubricants industry, Castrol India Ltd’s performance is closely tied to automotive production and industrial activity. The automotive sector, being sensitive to consumer demand, technological shifts, and regulatory influences, is currently witnessing a mix of recovery and innovation trends. The overall market reflects a cautious optimism, with moderate growth visible in some segments despite macroeconomic headwinds. Castrol's position as a lubricant leader aligns it well with the sector's evolving demands, though the sector remains subject to fluctuations tied to global oil prices and economic cycles.
Risk Considerations:
Market Volatility: Rapid shifts in market sentiment could lead to unpredictable price fluctuations.
Economic Dependency: Any downturn in industrial or automotive production could directly impact demand for lubricants.
Regulatory Policies: New environmental or industry regulations could pose challenges to operations.
Commodity Price Risks: Variability in crude oil prices could influence input costs, affecting margins.
Analysis Summary: Castrol India Ltd reflects a steady technical stance with firm support levels offering resilience. Its potential upside levels and a positive swing zone indicate opportunities for momentum-based movements. The RSI’s neutral position suggests balanced momentum, while trading volumes emphasize active investor engagement. Factoring in sector dynamics and broader market conditions, the stock holds a balanced outlook. However, potential investors should remain mindful of broader market trends, sector-specific developments, and potential risks before making any decisions. This analysis provides a comprehensive perspective without any direct buy or sell recommendations.

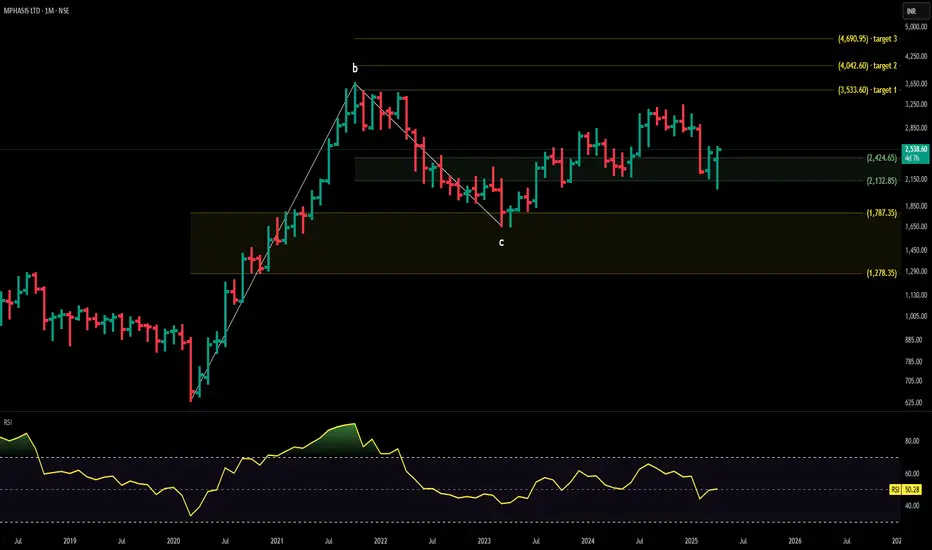
MPHASIS technical analysisStock Overview: Mphasis Limited, traded on the NSE, is currently priced at ₹2,538.60. The company specializes in IT services, offering application development, infrastructure outsourcing, and business process outsourcing to industries like banking, financial services, and insurance.
Key Levels:
Support: ₹1,787.35, ₹1,278.35
Upside Swing Zone: ₹2,424.65, ₹2,132.85
Possible Upside Levels: ₹3,533.60, ₹4,042.60, ₹4,690.95
Technical Indicators:
RSI (Relative Strength Index): The RSI stands at 50.28, indicating a neutral position. This suggests balanced buying and selling pressure without extreme market sentiment.
Volume: The trading volume is 14.03M, reflecting varying levels of activity. Higher volume periods may correlate with significant price movements.
Sector and Market Context: Mphasis operates within the IT services sector, which has demonstrated resilience and growth potential due to increasing demand for digital transformation and cloud services. The sector's overall market trend remains positive, driven by technological advancements and businesses adapting to digital solutions. However, the sector is sensitive to global economic conditions, regulatory changes, and technological disruptions.
Risk Considerations:
Company-Specific Risks: Mphasis faces challenges like competition, client concentration, and the need to keep pace with technological changes.
Sector Risks: The IT services sector is highly competitive and requires continuous innovation to maintain relevance.
Analysis Summary: Mphasis Limited's stock possible upside levels indicate price points the stock could reach under favorable conditions. Investors should consider sector performance, market trends, and company-specific risks before making decisions. Staying informed about developments affecting the stock is crucial for navigating its movement effectively.
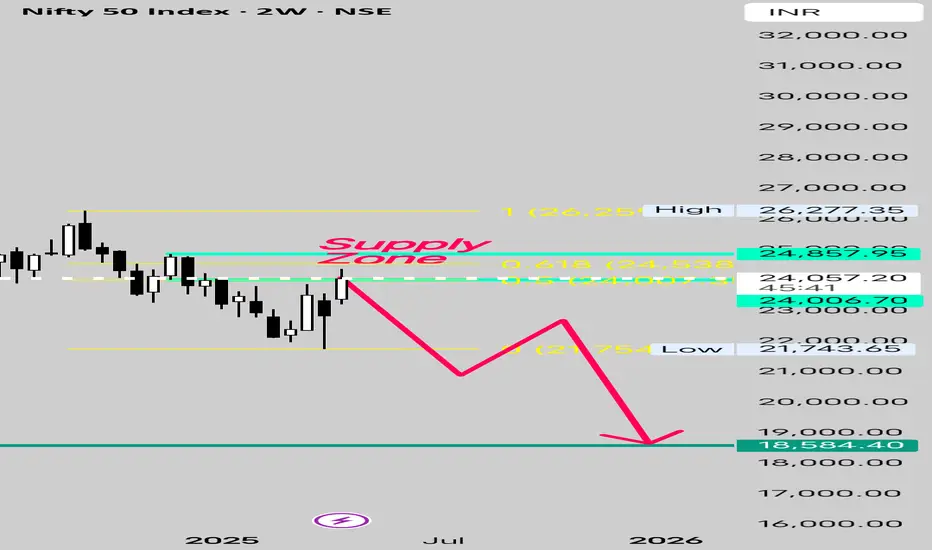
Supply Zone Tested. Nifty ready for Next Down LegSupply Zone has been tested which is situated around 24850 to 24000
Which also happens to be the Fib 0.5 0.6 retracement of the Fall that began from 26k to 22k
Bears are going to get aggressive below 24000
In Months to come we may test 19000 18500.
All The Best 👍