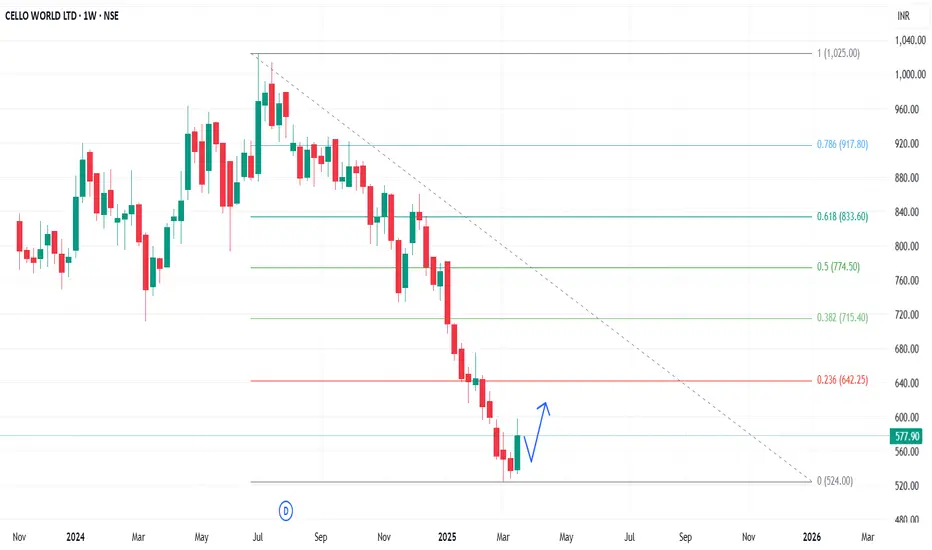
CELLO - Weekly AnalysisIn the Weekly Chart of CELLO ,
we can see that; it has given a W shape recovery from 525 levels.
Let it create a halt candle and then enter with SL & Targets.
Expected momentum is shown in chart.
Fibonacci
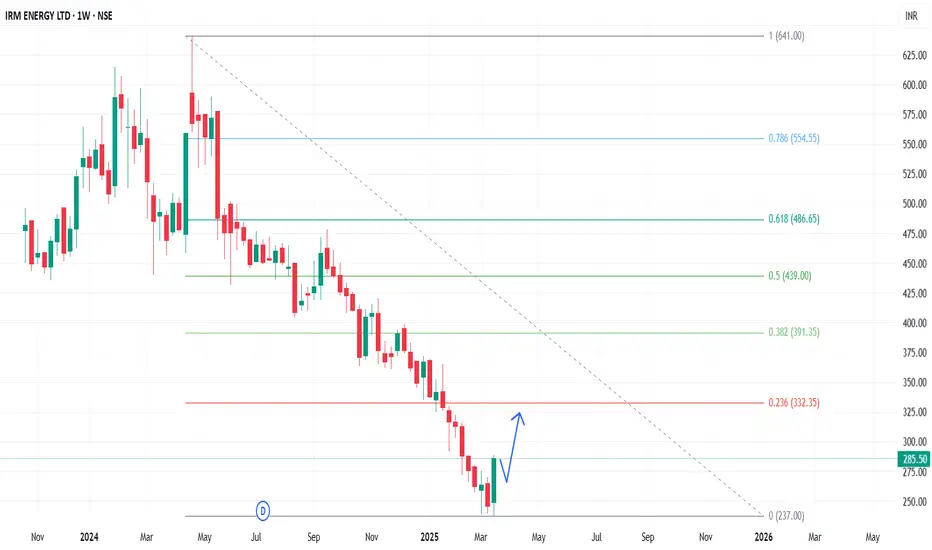
IRMENERGY - Weekly AnalysisIn the Weekly Chart of IRMENERGY ,
we can see that; it has given a W shape recovery from 240 levels.
Let it create a halt candle and then enter with SL & Targets.
Expected momentum is shown in chart.
IREDA - Weekly AnalysisIn the Weekly Chart of IREDA ,
we can see that; it a given a comeback from last FIBO level of support after crossing it.
Let it create a Halt candle and take support of FIBO level and then we can see the continuity in momentum.
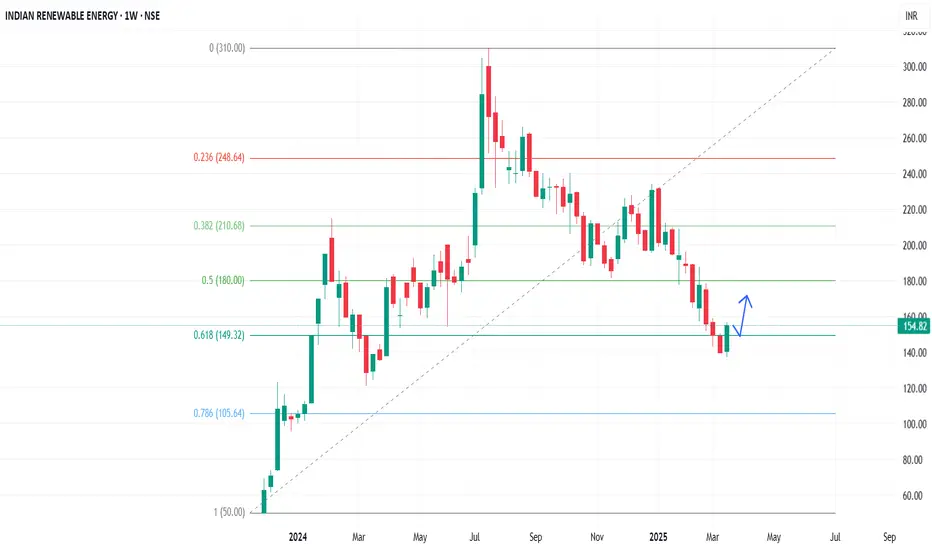
ready for targets MARUTI SUZUKI Stock Overview: Maruti Suzuki India Ltd., traded on NSE, current price: ₹11,732.80. Maruti Suzuki India Ltd. is a leading automobile manufacturer in India, primarily engaged in the production and sale of passenger vehicles.
Technical Indicators:
RSI (Relative Strength Index): The RSI value is 47.68, indicating neutral momentum as it is neither in the overbought (>70) nor oversold (<30) zone.
Volume: The trading volume is 2.07 million, reflecting moderate activity.
MA (Moving Averages): Multiple moving averages (e.g., 50, 200-day SMA) suggest trend direction and potential support/resistance levels.
Sector and Market Context: Maruti Suzuki operates in the automobile sector, which is witnessing fluctuations due to evolving consumer demand, regulatory policies, and economic conditions. The sector is also influenced by the growing focus on electric vehicles and sustainability. The broader market shows signs of recovery post-pandemic, which could positively impact the automobile industry.
Risk Considerations: Potential risks include market volatility, changes in government policies, global economic conditions, supply chain disruptions, and competition from other manufacturers. Additionally, fluctuations in raw material prices and foreign exchange rates could affect performance.
Analysis Summary: Maruti Suzuki India Ltd. exhibits neutral momentum with moderate trading activity. The stock is currently in a swing zone, with potential targets identified. Investors should carefully consider market conditions, sector performance, and associated risks before making decisions.

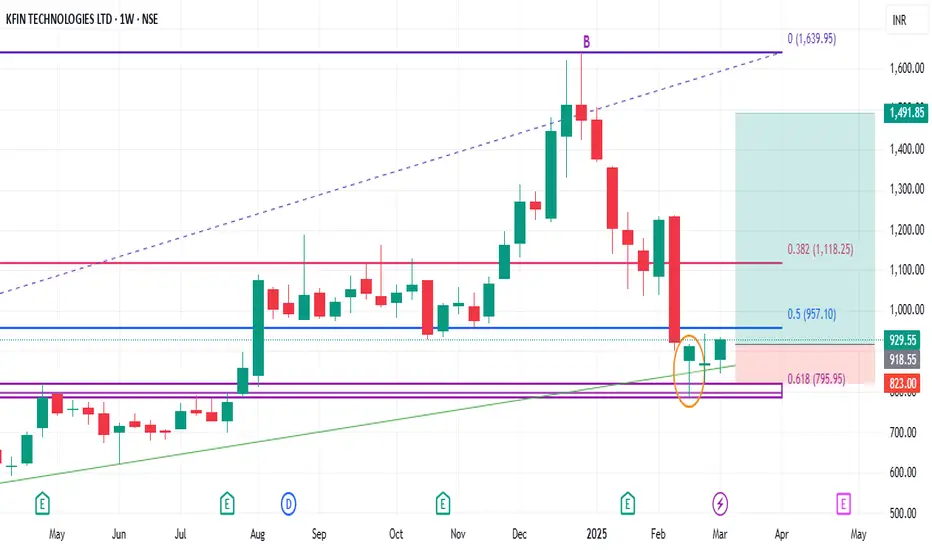
Positional or Longterm Opportunity in KfinechGo Long @ 918.55 for Targets of 1109.65, 1205.2, 1300.75, and 1491.85 with SL 439.15
Reasons to go Long :
1. On a Weekly timeframe if we draw the Fibonacci retracement tool from the recent swing low (point A) to the recent swing high (point B) then we see stock took support from the 0.618 Fibonacci level.
2. Besides, a bullish candlestick pattern Bullish Hammer (marked with orange) is formed around the 0.618 Fibonacci level.
3. In addition to this there is a strong demand zone (marked with purple) which earlier was acting like resistance but now is providing support to the stock.
4. There is also a strong Trendline (marked with green) that is providing support to the stock.
LTIM Trades Sideways After Market Correction Topic Statement:
LTIM has corrected along with the broad market correction and is currently trading in a sideways range, with key support and resistance levels defining its movement.
Key points:
- The stock is moving in a sideways range between 4000 and 6000.
- Price has received heavy support at the 50% retracement level previously and is currently at this level.
- The stock is trading below the 180-day exponential moving average, making it oversold.
- The weekly MFI is at 17.8, indicating that the stock is highly oversold.

Mankind Pharma: Fundamental & Technical Analysis for TradersFinancial Performance Overview
Mankind Pharma, a leading player in the pharmaceutical sector, recently released its Q3 financial results for the period ending December 31, 2024. The company reported a 16.5% decline in net profit, falling to ₹384 crore from ₹460 crore in the same quarter last year. This decline was primarily due to increased expenses, including costs related to the acquisition of Bharat Serums and Vaccines in October 2024.
Despite the profit decline, the company saw a strong revenue growth of 24%, with revenue from operations rising to ₹3,230 crore from ₹2,607 crore year-over-year. This surge is largely driven by an increased market share in chronic illness drugs, which grew to 37.6% from 35.6%.
The company's market capitalization stands at ₹99,640 crore, with a P/E ratio of 45.16.
Technical Analysis & Trading Outlook
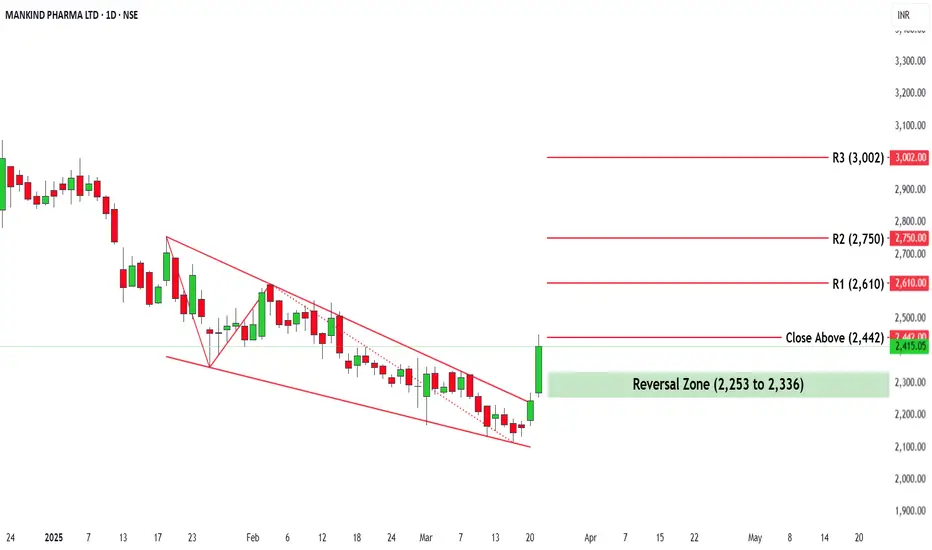
Current Market Price (CMP): ₹2,415.05
Chart Pattern: The stock recently formed a falling wedge pattern on the daily time frame (TF) and gave a breakout with a significant volume increase of 2.36M.
Breakout Confirmation: If the price closes above ₹2,442, we can expect a strong bullish move.
Upside Targets Post-Breakout:
Short-term Target: ₹2,610
Medium-term Target: ₹2,750
Long-term Target: ₹3,002
Potential Downside & Reversal Zone
If the price experiences a pullback, we can expect a reversal zone between ₹2,253 - ₹2,336. A bounce from this level could trigger bullish momentum, offering an ideal re-entry point for traders.
With strong revenue growth, technical breakout confirmation, and a well-defined support zone, Mankind Pharma remains a stock to watch for both fundamental investors and technical traders.
Disclaimer: This analysis is for educational purposes only. Investors should conduct their own research before making any trading decisions.
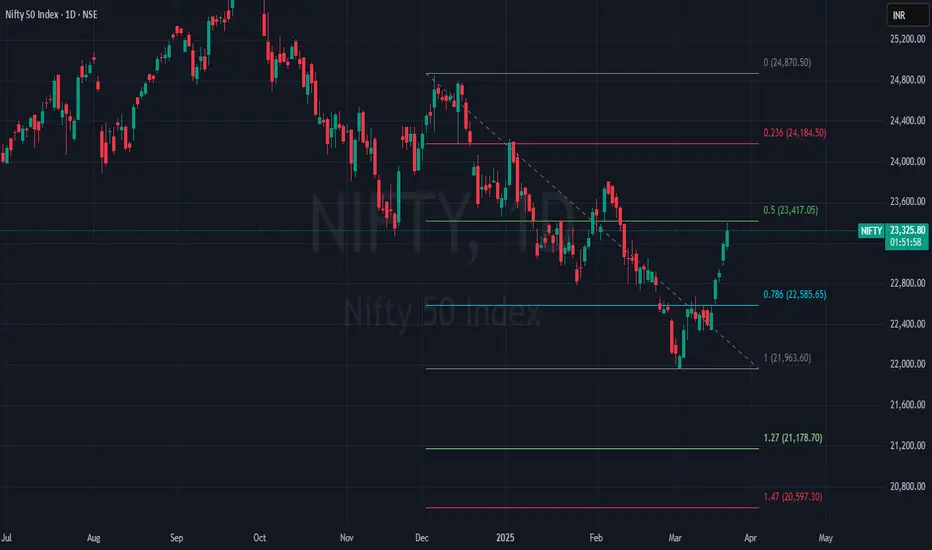
NIFTY 50 : Fibonacci Levels and Potential MovementsLooking at the recent Fibonacci retracements on Nifty, we’ve observed a pattern where the price tends to reverse from the 0.5 level and move towards the 1.47 extension level. Let’s take a closer look at the last three Fibonacci retracements:
1) 26777 to 23263
2) 24857 to 23460
3) 24857 to 22786
Now, if we plot Fibonacci from 24857 to 21965, the 0.5 level comes out to 23415. As we’ve seen in previous cases, the price tends to return from the 0.5 level.
If Nifty forms a red candle on a daily basis at this level (23415) and the next candle breaks the low of the previous candle, then there is a possibility for Nifty to reach the 1.47 extension level, which is around 20600.
HINDUSTAN FOODSStock Overview
Hindustan Foods Ltd, traded on NSE, current price: INR 564.90. The company specializes in manufacturing food products and beverages.
Key Levels
Support (Yellow Zone): INR 415.35 - INR 486.70
Swing Zone (Green Zone): INR 531.25 - INR 572.85
Target Levels (T): INR 726.30, INR 797.65, INR 888.45, INR 1,150.80
Technical Indicators
RSI (Relative Strength Index): Currently at 53.55, indicating neutral momentum as it is neither overbought (>70) nor oversold (<30).
Volume: 395.38K, reflecting active trading and interest in the stock.
MA (Moving Average): The stock price is above the 200-day moving average, suggesting a potential bullish trend.
Sector and Market Context
Hindustan Foods Ltd operates within the consumer goods sector, which has demonstrated resilience and steady growth. The broader market trend has been positive, with consumer goods stocks benefiting from increased demand and economic recovery.
Risk Considerations
Potential risks include:
Market volatility.
Shifts in consumer preferences.
Regulatory changes.
Economic downturns that could impact performance.
Analysis Summary
Hindustan Foods Ltd exhibits stable performance with clearly defined support and resistance levels. Technical indicators suggest a neutral to bullish outlook. Investors should consider the broader market conditions and sector performance while making decisions, keeping in mind the identified risks.

Dixon Corrects After Strong Bull Run Topic statement:
Dixon was on a strong bullish streak, becoming overbought, and has finally faced a correction after breaching its up trendline, leading to increased selling pressure.
Key points:
- The up trendline was breached, triggering selling pressure.
- Price has taken support at the 38.2% retracement level.
- The stock is still above the 90-day EMA, and the weekly MFI is at 30.
- If the 38.2% retracement level fails to hold, further correction to the 50% retracement level is possible.

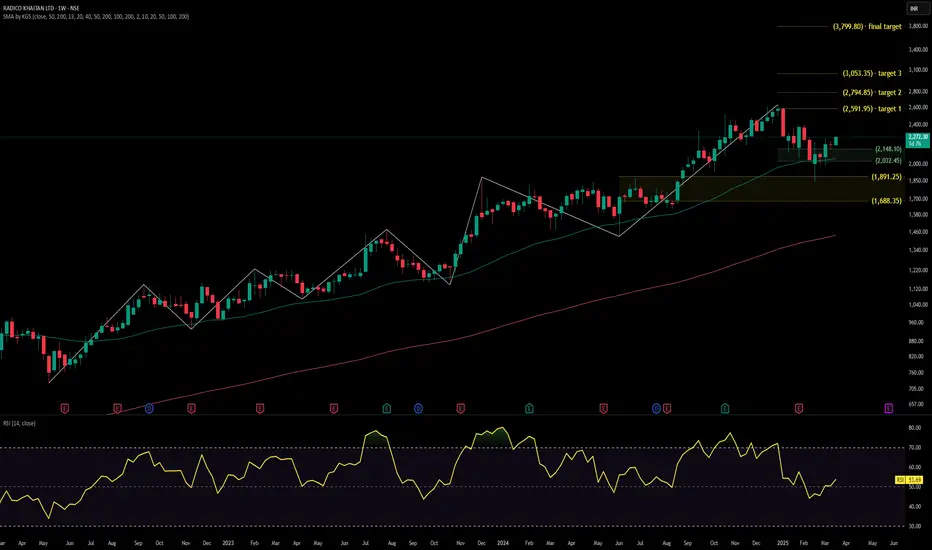
ready for cheers RADICO KHAITANStock Overview:
Stock Name: Radico Khaitan Ltd, Exchange: NSE
Company Business Profile: Radico Khaitan Ltd is a leading Indian company specializing in the manufacturing and distribution of alcoholic beverages, including spirits and liquors.
Key Levels:
Support (Yellow Zone): ₹1,688.35 - ₹1,891.25
Swing Zone (Green Zone): ₹2,032.45 - ₹2,148.10
Technical Indicators:
RSI (Relative Strength Index): Currently at 53.69, indicating neutral momentum. RSI values above 70 suggest overbought conditions, while below 30 indicate oversold conditions.
Volume: 410.85K shares traded, reflecting moderate activity. Higher volume often signals increased interest in the stock.
MA (Moving Averages): The stock price is above the 200-day moving average (₹1,437.52), suggesting a long-term uptrend.
Sector and Market Context: Radico Khaitan Ltd operates within the alcoholic beverages sector, which is influenced by regulatory changes, consumer trends, and economic conditions. The sector shows resilience, and the stock's position above its long-term moving average aligns with the broader bullish market sentiment.
Risk Considerations: Potential risks include regulatory changes impacting the alcoholic beverages industry, fluctuations in raw material costs, and shifts in consumer preferences. Broader market conditions, such as economic downturns or geopolitical events, could also affect the stock's performance.
Analysis Summary: Radico Khaitan Ltd demonstrates a strong upward trend, supported by key technical levels and indicators. While the long-term outlook appears positive, investors should remain cautious of potential risks and market conditions. This analysis is for informational purposes only and does not constitute investment advice.
TATASTEELTATASTEEL's potential price movement:
Support Zone: ₹124.30 (price may bounce up).
Resistance/Target Zones: ₹160 (21.84% gain) and ₹183 (40.88% gain).
Risk: Below ₹124, it may drop to ₹112 or lower.
Analysis: If it holds above ₹124, it has good upside potential; otherwise, risk increases.

ready for targets GUJARAT THEMISStock Overview
Gujarat Themis Biosyn Ltd (NSE: GTBL) is currently trading at ₹257.90. The company operates in the pharmaceutical and biotechnology sector, focusing on fermentation-based active pharmaceutical ingredients (APIs).
Technical Indicators
RSI (Relative Strength Index): Currently at 54.52, indicating a neutral stance. It suggests neither overbought nor oversold conditions, leaving room for further price movement in either direction.
Volume: The recent volume stands at 27.14K, showing moderate participation. Increased volume around support or breakout levels could confirm the trend.
Moving Averages (MA): The stock appears to be trending above a rising support channel, indicating a potential uptrend continuation if it holds above the key levels.
Sector and Market Context
The pharmaceutical and biotechnology sector has been witnessing moderate growth, driven by increasing demand for healthcare products. However, sector rotation and overall market sentiment may impact GTBL’s movement. The NIFTY Pharma Index's performance should be monitored for broader trends.

IndusInd Bank Plunges on Accounting ConcernsTopic Statement:
IndusInd Bank has faced a massive selloff following accounting discrepancies in its derivatives portfolio, pushing the stock into oversold territory.
Key points:
- Stock has broken the 61.8% retracement level, indicating the selling pressure may continue until a full 100% retracement towards Rs 243.
- Price has overextended below the 180-day EMA, making the stock oversold.
- MFI on the weekly chart is at 20, denoting highly oversold conditions.

Triveni Turbine - Chart of the Week NSE:TRITURBINE has a beautiful structure on the Weekly Timeframe to Qualify for my Chart of the Week idea, it saw Decent Volumes around the marked Key Levels which is 0.786% Fib Retracement Levels and also a Rising trendline which has been defending since June 2022 Several Times.
About:
NSE:TRITURBINE primarily manufactures and supplies power-generating equipment and solutions. It was a division of NSE:TRIVENI since the 1970s and was demerged w.e.f from Oct 2010 into a separate entity.
Trade Setup:
Could be a good Positional Trade with the Rising Trendline Being a Major Support along with FIb Levels.
📌Thank you for exploring my idea! I hope you found it valuable.
🙏FLLOW for more
👍BOOST if useful
✍️COMMENT Below your views.
Meanwhile, check out my other stock ideas on the right side until this trade is activated. I would love your feedback.
Disclaimer: "I am not SEBI REGISTERED RESEARCH ANALYST AND INVESTMENT ADVISER."
This analysis is intended solely for informational and educational purposes only and should not be interpreted as financial advice. It is advisable to consult a qualified financial advisor or conduct thorough research before making investment decisions.

GSK Pharma - Chart of the MonthNSE:GLAXO has a beautiful structure on the Monthly Timeframe to Qualify for my Chart of the Month idea, it saw Heavy Volumes around the marked Key Levels which broke out and retested went to ATM and Again Retested and Bounced from that Place With Volumes in Last Month.
Also if we Use Fibonacci retracement it bounced from Crucial 0.618 Levels.
About:
NSE:GLAXO researches, manufactures and makes available a broad range of medicines and vaccines that benefit people, It's a Leading Global healthcare company part of GlaxoSmithKline plc (GSK), a British multinational pharmaceutical company headquartered in London.
Trade Setup:
Could be a good Positional Trade with those Key Levels as Major Support and AIM for New ATH.
📌Thank you for exploring my idea! I hope you found it valuable.
🙏FLLOW for more
👍BOOST if useful
✍️COMMENT Below your views.
Meanwhile, check out my other stock ideas on the right side until this trade is activated. I would love your feedback.
Disclaimer: "I am not SEBI REGISTERED RESEARCH ANALYST AND INVESTMENT ADVISER."
This analysis is intended solely for informational and educational purposes only and should not be interpreted as financial advice. It is advisable to consult a qualified financial advisor or conduct thorough research before making investment decisions.

NIFTY 50 PRE MARKET ANALYSIS
opening 22662 -above bullish trendline , near immediate resistance in 15m time frame 22670
support for dip 22600 (R1+PDH) , for breakout should clear day high and 22700 (R2) if not sustained can come after breakdown to test CP - 22500 levels

book your flat KOLTE-PATILStock Overview
Stock Name: Kolte Patil Developers Ltd.
Exchange: NSE
Current Price: ₹252.35
Company Business Profile: Kolte Patil Developers Ltd. is a real estate company engaged in developing residential, commercial, and retail properties.
Technical Indicators
RSI (Relative Strength Index): Currently at 48.13, indicating neutral momentum as it hovers near the midpoint of 50.
Volume: 11.25M, reflecting active trading and liquidity.
Moving Average (MA): The 50-period Simple Moving Average (SMA) is at ₹338.59, suggesting the stock is trading below its short-term trend line.
Sector and Market Context
Kolte Patil Developers Ltd. operates in the real estate sector, which is influenced by factors such as interest rates, economic growth, and government policies. The stock's performance aligns with broader real estate market trends, which have shown moderate growth recently. Additionally, overall market sentiment and macroeconomic conditions play a significant role in shaping its trajectory.
Risk Considerations
Market Risks: Volatility, changes in interest rates, and economic downturns.
Sector-Specific Risks: Regulatory changes, project delays, and cost overruns.
Company-Specific Risks: Management changes or operational inefficiencies could impact performance.
Analysis Summary
Kolte Patil Developers Ltd. exhibits neutral momentum with the RSI near 50 and is trading below the 50-period SMA. The identified support and swing zones provide critical levels to monitor for potential price movements. While the target levels indicate possible upside, investors should carefully consider the associated risks and market conditions before making decisions.

$MONGUSDT massive weekly bullish divergenceMASSIVE WEEKLY BULLISH DIVERGENCE
something very big cooking on POLONIEX:MONGUSDT as weekly bullish divergence showing very big move incoming.. Things can get much more bullish than anyone ever thought possible.. Is $MONG gonna pull off 10,000X?!
DONT UNDERESTIMATE WEEKLY BULLISH DIVERGENCE

possible pole n flag breakout in GLOBUS SPRITISStock Overview
Stock Name: Globus Spirits Ltd.
Exchange: NSE (National Stock Exchange of India)
Current Price: ₹881.20
Business Profile: Globus Spirits Ltd. is a leading player in the alcoholic beverages industry, specializing in the production and distribution of Indian Made Foreign Liquor (IMFL), Country Liquor, and Bulk Alcohol. The company operates across multiple segments, catering to diverse consumer preferences.
Key Levels
Support (Yellow Zone): ₹709.65
Swing Zone (Green Zone): ₹1,310.20
Target Levels (T): T1: ₹1,711.15 T2: ₹1,996.50 T3: ₹2,360.05 Final Target: ₹3,409.90
Technical Indicators
Relative Strength Index (RSI):
Current RSI: 49.54, indicating neutral momentum. RSI values above 70 suggest overbought conditions, while below 30 indicate oversold conditions.
Volume:
Current Volume: 964.3K. High volume during price increases confirms strong buying interest, while low volume during declines suggests weak selling pressure.
Moving Average (MA):
The 50-period Simple Moving Average (SMA) is ₹915.57. The stock trading below this level indicates potential bearish sentiment.
Sector and Market Context
Sector Performance: Globus Spirits Ltd. operates in the alcoholic beverages sector, which has shown resilience amid fluctuating market conditions. The sector benefits from steady consumer demand and favorable regulatory policies.
Market Trends: The broader market has been moderately bullish, with indices showing gradual recovery. However, sector-specific factors, such as raw material costs and excise duties, remain critical.
Risk Considerations
Market Risks: Volatility in the broader market due to macroeconomic factors like interest rate changes or geopolitical events.
Sector-Specific Risks: Regulatory changes, fluctuations in raw material prices, and shifts in consumer preferences could impact performance.
Stock-Specific Risks: Potential earnings misses or management changes may influence investor sentiment.
Analysis Summary
Globus Spirits Ltd. presents a mixed technical outlook. While the RSI indicates neutral momentum, volume trends suggest periods of strong investor interest. The stock's performance is closely tied to sector trends and broader market conditions. Investors should monitor key levels and remain cautious of potential risks. This analysis is for informational purposes only and does not constitute financial advice.

ready to fire missile BDLTechnical Analysis Report
Stock Overview
Stock Name: Bharat Dynamics Ltd.
Exchange: NSE (National Stock Exchange of India)
Current Price: ₹1,108.25
Chart Timeframe: Weekly (1W)
Company Business Profile: Bharat Dynamics Ltd. is a public sector enterprise under the Ministry of Defence, specializing in the production of ammunition and missile systems. It plays a pivotal role in India's defense sector, contributing to national security and defense exports.
Candlestick Pattern Analysis
The chart highlights a bullish engulfing pattern at a key support level, suggesting a potential reversal to an uptrend.
A bearish engulfing pattern is visible near a resistance level, indicating a possible trend reversal to the downside.
Key Levels
Support Levels (Yellow Zone): ₹737.75, ₹850.70, ₹963.70
Swing Zone (Green Zone): ₹1,103.50, ₹1,224.21
Target Levels (T): ₹1,403.70, ₹1,721.00, ₹1,946.95, ₹2,234.70, ₹3,065.70
Technical Indicators
RSI (Relative Strength Index): Currently at 47.30, indicating a neutral position. RSI values between 30 and 70 suggest the stock is neither overbought nor oversold.
Volume: The volume chart shows significant spikes during the uptrend, reflecting strong buying interest.
MA (Moving Average): The 50-week Simple Moving Average (SMA) is at ₹1,224.21. The price is currently below this SMA, indicating a potential bearish trend.
Volume Trends
Volume Spikes: Notable during the uptrend phase, confirming strong buying momentum.
Volume Declines: Observed during the correction phase, indicating reduced trading activity.
Dividend Information
Ex-Date: February 14, 2025
Dividend Amount: ₹4.00 per share
Payment Date: March 8, 2025
Sector and Market Context
Bharat Dynamics Ltd. operates in the defense sector, which is influenced by government policies, defense budgets, and geopolitical factors. The stock has shown strong bullish momentum recently, aligning with the sector's growth trajectory and increased defense spending globally.
Risk Considerations
Government Policies: Changes in defense budgets or policies could impact the company's revenue.
Geopolitical Risks: Tensions or conflicts may affect operations or investor sentiment.
Market Conditions: Economic downturns or shifts in sectoral focus could influence stock performance.
Analysis Summary
Bharat Dynamics Ltd. exhibits a strong technical setup with clear support and resistance levels. The RSI indicates a neutral stance, while volume trends highlight significant buying interest during the uptrend. The stock's performance is closely tied to the defense sector's dynamics and broader market trends. Investors should consider potential risks, including policy changes and geopolitical factors, before making decisions.

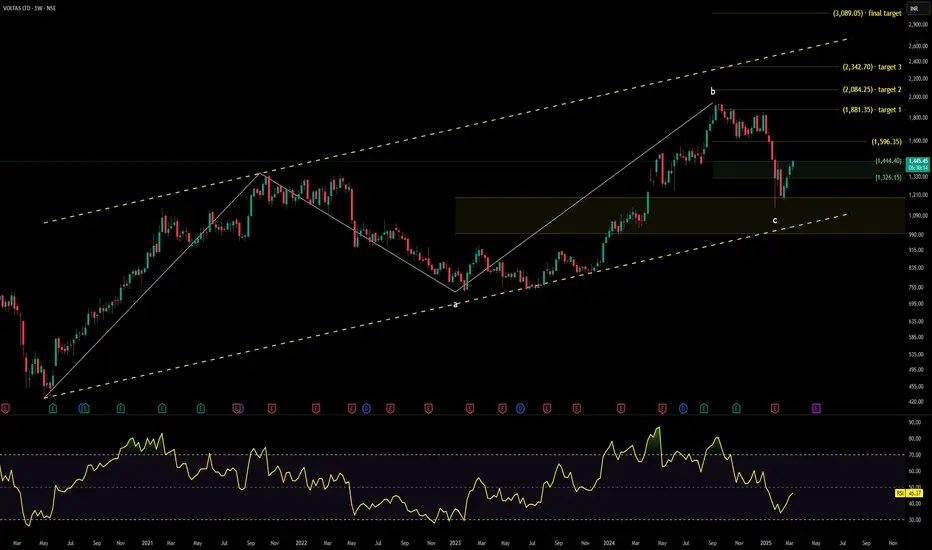
ready to chill VOLTASStock Overview
Stock Name: Voltas Ltd.
Exchange: NSE (National Stock Exchange of India)
Current Price: 1,145.45 INR
Chart Timeframe: 1M (Monthly)
Company Business Profile: Voltas Ltd. is an Indian multinational company that provides engineering solutions for a wide spectrum of industries in areas such as heating, ventilation, air conditioning, refrigeration, electro-mechanical projects, and textile machinery.
Candlestick Pattern Analysis
The chart shows a prominent uptrend followed by a correction phase. There is a visible bullish engulfing pattern around point 'a', indicating a potential reversal from the downtrend. Additionally, there is a bearish engulfing pattern near point 'b', suggesting a possible short-term top.
Key Levels
Support (Yellow Zone): 1,188.55 INR
Swing Zone (Green Zone): 1,326.15 INR
Target Levels (T): Target 1: 1,881.35 INR Target 2: 2,084.25 INR Target 3: 2,342.70 INR
Technical Indicators
RSI (Relative Strength Index): The RSI is currently at 55.08, which is in the neutral zone. This suggests that the stock is neither overbought nor oversold, indicating a balanced momentum.
Volume Trends
The volume trends show a significant spike during the initial uptrend, which is a positive sign of strong buying interest. However, there is a noticeable decline in volume during the correction phase, suggesting a lack of selling pressure. This could indicate that the correction might be temporary and the uptrend could resume.
Sector and Market Context
Voltas Ltd. operates in the engineering and air conditioning sector, which has shown resilience and growth potential in recent years. The overall market trend has been bullish, with the NSE index showing a steady uptrend. Voltas Ltd.'s performance is in line with the sector and market trends, indicating a strong position within its industry.
Risk Considerations
Possible risks include market volatility, changes in government policies, and economic conditions that could impact the engineering and air conditioning sector. Additionally, global supply chain disruptions and fluctuations in raw material prices could affect the company's performance.
Analysis Summary
Voltas Ltd. is currently in a correction phase after a strong uptrend. The technical indicators suggest a balanced momentum with no immediate signs of overbought or oversold conditions. The volume trends indicate strong buying interest during the uptrend and a lack of selling pressure during the correction. The stock is well-positioned within its sector and the overall market trend is positive. However, investors should be aware of potential risks and market conditions that could influence the stock's movement.
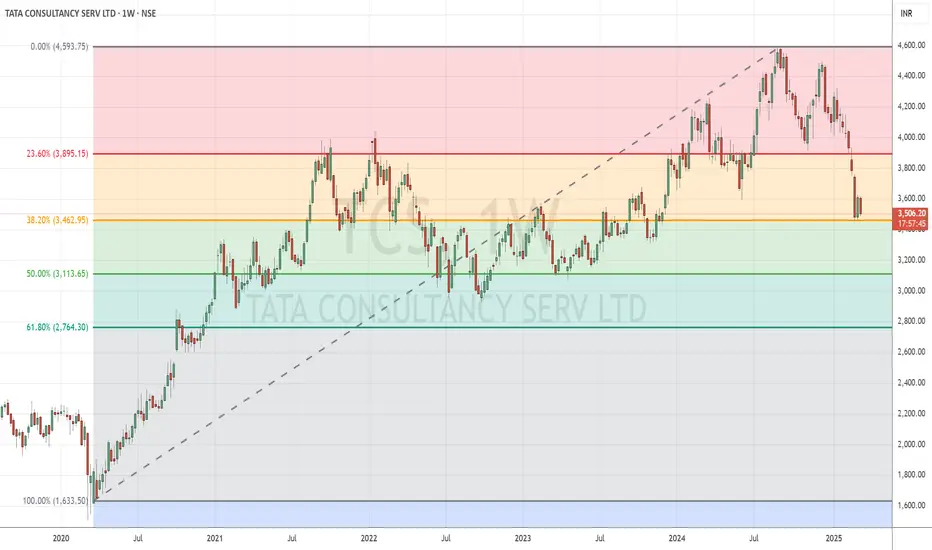
TCS Approaches Strong Support Amid Severe CorrectionTopic Statement:
TCS has seen a sharp correction in recent months, with the stock finding support at the 3500 level while trading below the 180-day EMA, indicating oversold conditions, further confirmed by a highly oversold weekly MFI.
Key points:
- Stock takes support at the 38.2% retracement level
- Price is below the 180-day EMA, marking it as oversold
- Weekly MFI is at 18, indicating the stock is highly oversold