EURUSD LONGEurusd coming toward buying zone in 4hr time frame. wait for to enter zone use 15mins confimation for entry
Fibonacci

03-02-25 Nifty key levelsDear traders, here are the key levels for nifty 03-02-25, important support and resistance for intraday, based on previous day movement and market trend.
Note: Intraday view only

Elliot Wave study EMAMI LTDEmami Ltd., incorporated in the year 1983, is a Mid Cap company (having a market cap of Rs 27,316.17 Crore) operating in FMCG sector.
Emami Ltd. key Products/Revenue Segments include Personal Care and Other Operating Revenue for the year ending 31-Mar-2024.
For the quarter ended 31-12-2024, the company has reported a Consolidated Total Income of Rs 1,064.41 Crore, up 16.69 % from last quarter Total Income of Rs 912.15 Crore and up 5.07 % from last year same quarter Total Income of Rs 1,013.03 Crore. Company has reported net profit after tax of Rs 283.48 Crore in latest quarter.

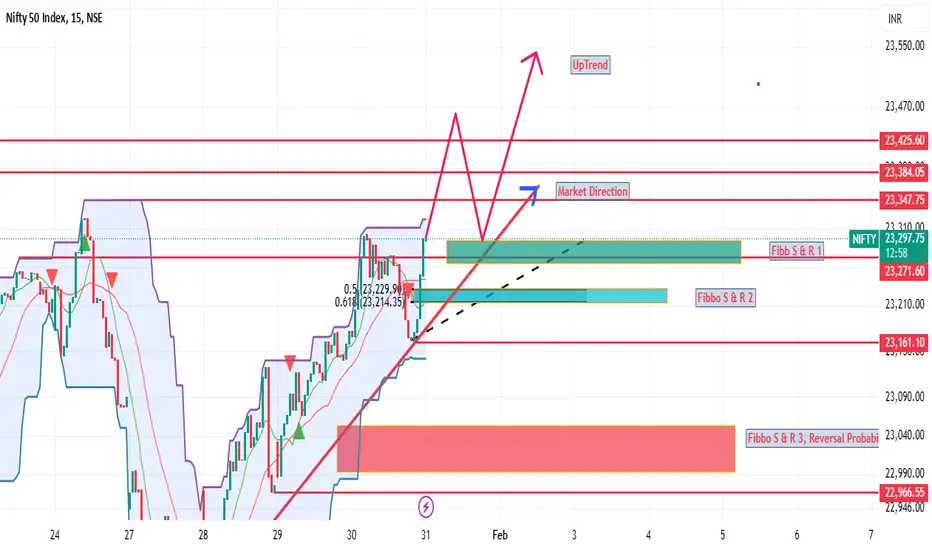
Market Potential Upside, Uptrend, Check Fibbo Levels for Price AMarket current trend is uptrend. For price action kindly check Fibbo levels. Possibility of market rangebound. Overall market trend is bullish.
NIFTY 50 UPTREND 3 days -DIP TRADE (BUDGET effect)Continously on 3rd day NIFTY is in buy in dip - with dip trade coming in 1st one hour by taking support at prev day liquidity /swing & 20 ema -5m
If broader trend is kept in mind - intraday trade can be derived on that basis

Buying opportunity in PRESTIGE ESTATE LTDPRESTIGE ESTATE LTD is in Double Correction.
The maximum target for wave (Y) of double correction is 161.8% extension.
We can see that price is near 161.8% so here we can buy this stock with stoploss below 1185.
The target will be minimum 38.2% retracement of entire move i.e. 1528
This analysis is based on Elliott Wave theory and Fibonacci.
This analysis is for educational purpose only.

Tata Motors - Yet to test the previous higher high swing!Better to wait for Tata motors to fall more and start accumulating from around 610 levels as it is close to the High high formation of previous swing from 2015, if it breaks don't panic buy more once it hits the purple trend line and finally at 550 levels!
Around 550 range it has an extreme strong support!
PS: Bad result came out today as well!

Bank nifty showing sign of bounce.Bank nifty is showing divergence on chart. Divergence repeats as like 6Aug 2024 to14 Aug 2014 as per chart. MACD also showing cross over. Bank nifty bounce is expected from here.

SBI LIFE INSURANCE: Potential for Good Returns in coming DaysTrade Details:
Buy Above 1445
Tp1 - 1565
Tp2 - 1670
Tp3 - 1800
Tp4 - 1920
SL - Below 1400 (Only to get started)
Rationale :
Multi Timeframe Analysis Shows:
1. Support taken at 1393, a Strong Demand Zone backed by 3 Monthly Candle
2. Support taken at 1438, Fresh Formed Demand Zone backed by 0.78 Fib Retracement of the Recent rally and Weekly Support
3. Multiple Points where SBI LI has taken support at 22 Monthly EMA in past marked by Circles.
Consolidation Zone - Trending move expected outside this Zone

Breakout Potential After Trendline BreakA possible breakout is expected once the price breaks through a key trendline. This strategy focuses on identifying significant trendlines formed by price highs or lows. When the price breaches this trendline, it could signal a change in market direction, indicating a potential breakout. Traders should monitor volume and other indicators to confirm the breakout's strength before taking action.

NIFTY HAS BROKEN 50 WEMA WITH HEAD AND SHOULDER PATTERN COMPLETEnifty has broken 50 weekly EMA
formed a head and shoulder or triple top pattern at in an attempt to retest the EMA from under and retest completion done.
sell at cmp 22880 22900
target 22550 22500
sl above 23000

This is a daily chart of IRFC (NSE).Key Points:
Downtrend: The stock is moving down but is near strong support (green lines).
Breakout Possible: If it moves above ₹144.70, it may go up to ₹149.04 and then ₹166.90.
Resistance: The red trendline is acting as a hurdle. A breakout above it can push the price higher.
Risk Level: If it falls below ₹127.65, the downtrend may continue.
Potential Upside:
First target: ₹144.70 (+6.78%)
Second target: ₹166.90 (+10.81%)
Conclusion:
Above ₹144.70 → Bullish move possible 🚀
Below ₹127.65 → Downtrend risk ⚠️

PVRINOXKey Observations:
Downtrend: The stock has been falling for a long time.
Support Level (Green Lines): The stock has reached a strong support zone around ₹988 - ₹1,043, where buyers are stepping in.
Bounce Back: The stock has given a small green candle, indicating some buying interest.
Target Level (Blue Line - ₹1,204.20): If the stock continues to rise, it may move up by 13.66% to ₹1,204.20 (previous support, now resistance).
Volume: Volume is slightly increasing, which supports a potential reversal.
Conclusion:
If the stock holds above ₹1,043, it may go toward ₹1,204.
If it breaks below ₹988, the downtrend may continue.

27-01 Nifty intraday levelsDear traders, here are the key levels for nifty 27-01-25 and important support and resistance for intraday,based on previous day movement. Red lines represent resistance area,green line represent support area.
Note: Intraday view only
Time Frame: 15 minute

Technical Analysis of Ethereum - Weekly Time Frame
👉🚀Here is a #technical analysis of #Ethereum #ETH based on the most recent data and insights from the
📉📈Chart

Nifty ready for bounce. Buy SpottedOn Higher time frame, Nifty has taken support at 0.61 Fib (23k) Retracement of the Election Rally from 22k to 26k.
If Nifty Holds this level, it could trigger a Short Covering taking Nifty to Major Resistance Levels at
23500
23800
24000
24200
24800
25000
Rejection from Any of These levels may resume the correction. If Sustains Above 25000, (Since it's a Monthly Candle Resistance) Then Next Rally may Begin..
This may be supported by inline earnings reports or better than expected earnings and Budget!

POONAWALLAA!Fibonacci levels, which help guess where the price might stop or change direction.
Here's the easy part:
Fibonacci Levels: Think of these as road signs on the chart. They show where the price might find support (like a safety net) or resistance (like a ceiling).
Blue Arrow: This arrow suggests that the price might go up.
Price Increase Note: The chart says that the price could increase.
feel free to ask! 😊

Gold long term opportunity - 15% from current priceGold has been travelling in an ascending channel since July 2024, when China started buying in large amounts.
It has formed a textbook cup-and-handle pattern by taking support from its previous resistance of 73800, by forming the cup's bottom. Cup and handle range of approx 7.2% might take it to the channel's top, which co-incides with Fib 1.6 level of 84000.
When it breaks the channel, the channel's range of 8.5% might take it above Fib 2.6 level of 90000.
So far buying opportunities might present itself at following intervals:
78900, when it takes support from the cup and handle resistance
79800, when it takes rejection from Fib 1 level
Again at around 80000 when it breaks above the Fib 1 level and takes support from it.

USDJPY at Resistance + Fibonacci retracement .....!📊 USDJPY Fibonacci Retracement Analysis
This chart showcases a Fibonacci retracement applied to the recent downtrend in USDJPY. Price is testing the 0.382 retracement level at 156.360, signaling potential resistance. A rejection at this level could lead to a short opportunity, targeting 155.626 (-0.60%). Watch for confirmations such as bearish candles or trendline breaks for optimal entries.

BBTC: Showing strength from a critical level!⚡️Price Analysis:
1️⃣ Perfect retest of 5-year ATH breakout level.
2️⃣ Overall price structure is bullish.
3️⃣ EMAs are providing dynamic support to the price.
4️⃣ Volumes are good.
5️⃣ Price respecting and bouncing from the fibonacci 60% retracement level.
✨ Key Observations:
➡️ Multiple timeframe alignment showing strength
➡️ Ideal RRR setup at current retest level
➡️ 1:3 RRR can be expected.
➡️ Multiple target zones visible on upside
➡️ Trend structure remains strongly bullish
⚠️ Disclaimer: This is NOT a buy/sell recommendation. This post is meant for learning purposes only. Views are personal. Please, do your due diligence before investing.⚠️
💬 Drop your thoughts on the analysis below! ✌️
🔥 Happy Trading!✅🚀

Education purpose only - ZomatoStock is respecting Fib level..
It should cross its recent high i.e. 306
Target should 360/-
New year orders are going to be a positive triggers for all ecom companies..
SL should be BO candle low i.e. 280...
Lets see how this hypothesis will play..
ZLong

Ashapura Minechem - All Time Breakout after 17 yearsAshapura Minechem has give ATH breakout after 17 years. Technically this stock can go to whooping 24500. Other factors:
1. 3rd largest producer of Bentonite in the world
2. Promoters have increased stake
3. Electrification, E-cars, Solar panels gives huge opportunity
4. Technically, has given breakout after 17 years
5. Has done a retracement of ~55% from its high price before moving up and giving a breakout
6. Monthly volumes have been steady
Looking at the above parameters and opportunities ahead, this stock is poised to move up to our immediate targets and a big buy for longterm.
Keep this stock in your radar. Keep following @Cleaneasycharts as we provide Right Stock at Right Time at Right Price.
Cheers!!

INFY Declares Q3 Earnings Amid Market PressureTopic Statement: Despite posting healthy Q3 earnings with profit growth of 11.6% QoQ, INFY's stock experienced a significant decline, signaling potential further corrections.
Key Points:
1. Stock dropped 6% after announcing Q3 earnings, creating a gap.
2. Candle broke the 23.6% retracement level.
3. Price may fall to the 38.2% retracement level, a previous support in November.
4. Price is near the 180-day moving average, indicating oversold conditions.
5. If the price reaches the 38.2% level, it will be under the 180-day moving average.
