Liquidity Grab Completed, Waiting for Pullback to ContinueMarket Context
Gold has just completed a strong impulsive rally, sweeping buy-side liquidity above the previous highs. After this expansion, price is now entering a short-term consolidation / pullback phase, which is expected behavior following a liquidity grab rather than a full trend reversal.
From a fundamental perspective, expectations of a more accommodative Fed stance continue to limit downside pressure on Gold, keeping the broader bias supported despite intraday corrections.
Technical Structure (Short-Term)
The larger structure remains bullish
Recent move shows a liquidity grab at the highs, followed by rejection
Current price action suggests rebalancing into demand zones
No confirmed bearish market structure shift so far
Key Technical Zones
Upper Resistance / Sell Reaction: 4,360 – 4,365
Intraday Resistance: 4,333 – 4,336
Buy Zone (Pullback Area): 4,300 – 4,305
Deeper Demand / Liquidity Support: 4,275 – 4,280
Trading Plan – MMF Style
Primary Scenario – Buy the Pullback
Expect price to retrace into 4,300 – 4,305 or deeper toward 4,280
Look for bullish reaction / stabilization to rejoin the trend
Upside targets:
TP1: 4,323
TP2: 4,335
TP3: 4,360+ (liquidity)
Alternative Scenario
If price holds above 4,323 and breaks higher directly, wait for a clean retest before considering continuation setups.
Avoid chasing price at premium levels.
Invalidation
A sustained break and H1 close below 4,275 would weaken the bullish continuation scenario and shift focus to deeper consolidation.
Summary
Gold remains in a bullish environment, with current weakness viewed as a technical pullback after liquidity grab.
Bias remains buy-the-dip, prioritizing patience and confirmation at key demand zones.
Fibonacci

BTC next Leg after Liquidity Another DeadCat Bounce Liquidity Grab but pattern Buildup
1. Liquidity and Direction towards 82k - 60%
2. Break the Descending channel and go up to 92k - 20%
3. Megaphone Expanding Bearish Pattern 0.5 to 0.6 Fib Retest down on 3 Touches - 80%

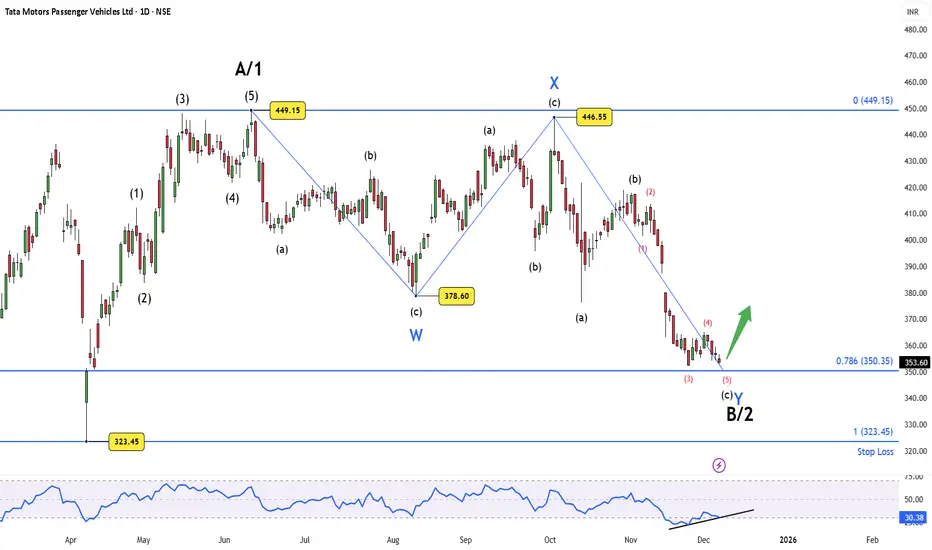
Tata Motors PV – Wave B/2 Near Completion, Bounce Zone ActivatedThe ongoing decline appears to be unfolding as a complex corrective structure, with Wave C of the larger Wave B/2 now approaching its typical termination area. Price has reached the 0.786 Fibonacci support at ₹350.35 — a level where deeper corrective phases frequently exhaust themselves.
Structurally, the final leg of Wave C shows a clear five-wave micro pattern, and downside momentum has begun to fade. The RSI is printing early bullish divergence, suggesting that sellers are losing strength even as price tests fresh lows. This combination often precedes a relief bounce within the broader framework.
As long as the price respects ₹323.45, this corrective interpretation remains valid and a bounce from the current zone is the preferred expectation. A decisive close below the invalidation level would signal that the correction is not yet complete and that a deeper retracement is unfolding.
Disclaimer: This analysis is for educational purposes only and does not constitute investment advice. Please do your own research (DYOR) before making any trading decisions.
XAU/USD: Price shifts from Supply, eyeing liquidity draw◆ Market Context (H1)
Gold is maintaining a medium-term uptrend, however, the price has reacted at the Supply Zone ~4,350 and started to adjust. The current decline is a technical pullback, with no signal of a main trend reversal.
◆ SMC & Price Action
• The upward structure remains valid as higher lows are maintained.
• Price is leaving the Supply Zone and may return to the Liquidity Buy + Fibo areas below.
• The upward trendline still acts as dynamic support for the recovery.
• No clear bearish CHoCH has appeared → prioritize the trend continuation scenario.
◆ Key Levels
• Supply / resistance: 4,350
• Liquidity Buy + Fibo: ~4,299
• Support Zone – Buy: 4,276
• Invalid upward structure: clear break of 4,276
◆ Trading Scenarios
➤ Scenario A – Pullback BUY (priority)
• Wait for price to return to Liquidity Buy + Fibo ~4,299
• Condition: price holding reaction, rejection candles
• Targets:
▪ 4,325
▪ 4,350 (Supply)
➤ Scenario B – Deeper Pullback
• If 4,299 is breached
• Monitor Support Zone 4,276 for buying reaction
• Only BUY if structure is preserved
➤ Scenario C – Break & Continue
• If price does not pull back deeply and holds above 4,325
• Follow the uptrend towards 4,350
• Manage risk at Supply
◆ Summary
• Main trend: Bullish (pullback within uptrend)
• Decision area: 4,299 → 4,276
• Upper target: 4,350
• Avoid SELL against the trend without a bearish CHoCH.

XAUUSD M30: Watching BUY 4,317–4,303, Targets 4,337–4,3461) Market Context (M30) – SMC & Price Structure
• The chart is on the M30 timeframe (not H1).
• After the impulsive move up, price has entered a consolidation / corrective phase , with BOS and ChoCH signals indicating a rotation of order flow around the equilibrium zone.
• Price is currently trading in the middle of the range, so the optimal approach is to wait for price to return to Demand/OB or wait for a sweep into Supply before making decisions.
2) Key Levels
• Supply / $$$ (upper targets): 4,346.655
• Intermediate Supply: 4,337.166
• OB Buy (Demand 1): 4,317–4,315 (tag 4,317.623)
• BUY Swing (Demand 2 – deeper): 4,303–4,305 (tag 4,303.099)
• Risk reference: SL reference at 4,289
3) Trading Scenarios (SMC – conditional setups)
Scenario A – BUY pullback at OB 4,317–4,315 (intraday priority)
• If price pulls back into 4,317–4,315 and shows clear bullish reaction (long lower wicks, bullish engulfing, or a bullish ChoCH on M15/M30).
• Then prioritize BUY continuation trades.
• Reference targets:
• TP1: 4,337
• TP2: 4,346
• If price reaches 4,337 / 4,346 and shows strong rejection, prioritize partial profit-taking rather than expecting a straight continuation.
Scenario B – Deep sweep into BUY Swing 4,303–4,305 (higher-quality setup)
• If price breaks below the 4,317 OB and continues to sweep liquidity into 4,303–4,305 .
• Only BUY after a clear reversal signal appears (post-sweep + fast reclaim).
• Reference targets: 4,317 → 4,337 → 4,346.
Scenario C – SELL reaction at Supply (counter-trend, scalp only)
• If price rallies into 4,337 or 4,346 and prints distribution signals (strong rejection / bearish ChoCH).
• A short SELL toward 4,317 can be considered.
• Note: SELLs are purely technical reactions; the primary bias remains “buy the dip” at the marked Demand zones.
4) News on 18/12 Impacting Gold (Macro Drivers)
• US CPI (November) released today — typically a major volatility driver for XAUUSD due to its direct impact on rate expectations and the USD.
Bureau of Labor Statistics
• On the same day: Initial Jobless Claims and the Philadelphia Fed Manufacturing Index — often cause short-term spikes around release times.
S&P Global
• Beyond the US, markets are also monitoring a series of central bank decisions (ECB/BoE/Norges Bank/Riksbank…), which may amplify USD and risk sentiment volatility, indirectly affecting gold.
S&P Global
CPI Trading Guidance
• Avoid entering trades right before CPI; preferably wait 5–15 minutes after the release for structure to become clearer, then execute based on reactions at 4,317 / 4,303 or Supply reactions at 4,337 / 4,346 .
5) Conclusion (Bias & Risk)
• Intraday bias: prioritize BUYs at Demand (4,317–4,315 and deeper 4,303–4,305).
• Focus on “right level – right signal”; avoid FOMO in the middle of the range.
• Maintain strict risk management, as CPI day often brings elevated volatility.
— Trade the levels, not the noise.

XAU/USD| Bullish Structure Holds, Buy Pullbacks for ContinuationGold remains in a well-defined bullish channel. After a strong impulsive move, price is now undergoing a technical pullback / rebalancing phase, which is normal behavior within a healthy uptrend.
From a fundamental perspective, dovish Fed expectations continue to support Gold, keeping downside moves corrective rather than trend-reversing.
Technical Structure (Short-Term)
Bullish market structure remains intact (Higher High – Higher Low)
Current pullback is occurring within the discount zone of the ascending channel
No confirmed bearish break of structure at this stage
Upside liquidity remains stacked above recent highs
Trading Plan – MMF Style
Primary Scenario – Trend-Following BUY
Preferred BUY zone: 4,303 – 4,320
Condition: price holds above support and maintains HL structure
Targets:
TP1: 4,335
TP2: 4,345
TP3: 4,359 (buy-side liquidity)
Alternative Scenario
If price does not pull back deeply and breaks above 4,335, wait for a clean retest to continue BUY setups.
Invalidation
A H1 close below 4,280 invalidates the short-term bullish bias and cancels BUY setups.
Summary
The short-term bias for Gold remains bullish.
Priority remains buying pullbacks within the channel, avoiding FOMO at premium prices and waiting for price to return to key liquidity zones.

Major support in nifty and banknifty, Bounce OR Breakdownin 15 minute timeframe there is major support in Nifty and banknifty, so probability is there will be a good bounce can happen today or tomorrow
Else if it breakdown on any of the Index, consider there will be major downfall in coming days.

Mahindra & Mahindra: Correction Phase Initiated from ATHFrom the recent all-time high near ₹3,795 , price action on the 4H timeframe shows a clear loss of impulsive structure. The initial decline from ATH is best interpreted as a leading diagonal , a common pattern that often kick-starts a broader corrective phase .
The diagonal unfolded Wave (1) with overlapping internal waves, confirming the corrective nature rather than trend continuation.
Currently, price appears to be attempting a Wave (2) retracement . Typical recovery zones lie between the 0.5–0.618 Fibonacci retracement (₹3,686–₹3,712) . As long as price remains below this band, the broader bias stays bearish , with scope for a stronger Wave (3) decline to follow.
Invalidation
This bearish count is invalidated above the ATH (₹3,795) . A move beyond this level would negate the diagonal structure and require a fresh bullish reassessment.
Summary
ATH rejection confirmed
Leading diagonal suggests corrective transition
Wave (2) retracement in progress
Below ATH -> downside risk remains active
Disclaimer
Disclaimer: This analysis is for educational purposes only and does not constitute investment advice. Please do your own research (DYOR) before making any trading decisions.

Hero MotoCorp: Post-Wave 3 Reset UnderwayFrom the 2020 low near 1,475, Hero MotoCorp on the weekly timeframe has been unfolding a higher-degree impulsive structure . The advance into the all-time high at 6,388.50 appears to have completed Wave 3 , with the internal structure cleanly subdividing into five waves (i)–(v) .
Wave (v) terminated near the 100% Fibonacci extension of Wave (i) measured from Wave (iv) , a typical exhaustion zone for a third wave of higher degree.
With the five-wave rally from 2,146.85 to the ATH now complete , the market has entered a corrective phase interpreted as Major Wave 4 .
Fibonacci retracement projections place the likely correction zone between:
0.5 retracement at 4,267 and 0.618 retracement at 3,767 .
Importantly, these levels remain well above the Major Wave 1 high at 3,629.05 , keeping the broader impulsive structure intact.
Volume profile analysis adds further confluence. When drawn from the rally between 3,344 and the ATH , the Point of Control aligns closely with the 50% retracement , reinforcing this region as a high-probability Wave 4 development zone.
In summary, Hero MotoCorp appears to have topped out for the near term . While a brief extension of Wave (v) cannot be ruled out, the weekly RSI was already in the overbought zone at the ATH . Any marginal new high would likely be accompanied by a bearish RSI divergence , strengthening the case for a corrective move into the projected Fibonacci zones before the final advance in Major Wave 5 .
Disclaimer: This analysis is for educational purposes only and does not constitute investment advice. Please do your own research (DYOR) before making any trading decisions.

NVIDIA: Double Bottom Flat at Support — Bounce Setup in PlayNVIDIA is currently testing a well-defined support zone near the prior lows, where price action is starting to compress rather than accelerate lower. The structure forming at this level resembles a double-bottom flat , suggesting that selling pressure is gradually losing momentum.
From an Elliott Wave perspective, the ongoing decline fits well as the final leg of a corrective phase. As long as this support zone holds, the odds favor the development of a Wave C move higher , which would mark a relief rally within the broader structure. The repeated defense of this level strengthens the case for a near-term bounce rather than an immediate breakdown.
That said, this is a decision zone . A clean hold keeps the upside scenario alive, while a decisive break below support would invalidate the flat structure and open the door for deeper downside. Until then, patience is key — let price confirm before committing.
Key Level to Watch: ~170
Above it: bounce potential
Below it: structure fails
Disclaimer:
Disclaimer: This analysis is for educational purposes only and does not constitute investment advice. Please do your own research (DYOR) before making any trading decisions.

XAU/USD: Trendline support awaits confirmation for gains.◆ Market Context (M30)
The price is maintaining an uptrend with higher lows, supported by the rising trendline. After a correction, the market reacted with buying at Support ~4,275, indicating that the flow of funds protecting the structure is still present. Currently, the price is entering the Liquidity + Fibo zone—a decisive area for the next move.
◆ SMC & Price Action
• The uptrend structure remains valid as long as the trendline + support 4,275 is held.
• Liquidity + Fibo ~4,300 is a short-term reaction zone (prone to fluctuations).
• Supply Zone ~4,349 is the upper liquidity target; reactions here need to be observed.
• A clear break of 4,275 will weaken the short-term uptrend structure.
◆ Key Levels
• Support: 4,275
• Liquidity + Fibo: ~4,300
• Supply / Target: 4,349
• Invalid: clear break below 4,275
◆ Trading Scenarios
➤ Scenario A – Pullback BUY (priority)
• Wait for price holding reaction around 4,300 (or slight pullback to trendline)
• Condition: candle rejects decline / holds HL
• Targets:
▪ 4,330
▪ 4,349 (Supply)
➤ Scenario B – Break & Continue
• If price closes candle above 4,300
• Follow the trend up to 4,349, manage risk at Supply
➤ Scenario C – Breakdown (defensive)
• If 4,275 is broken
• Price may return to test lower areas → stay out/wait for new bullish CHoCH
◆ Summary
• Trend: Bullish when > 4,275.
• Decisive zone: Liquidity + Fibo ~4,300.
• Upper target: 4,349.
• Avoid FOMO; prioritize pullback along trendline.

XAU/USD: Rejected at Sell, Awaiting Support Reaction◆ Market Context (M30)
Price has twice swept Liquidity Sell around the peak area but failed to hold, indicating weakening buying pressure at premium. Previously, the market had a Liquidity Sweep + Trap at the bottom, then created an upward BOS, so the current decline is seen as a rebalancing pullback, not yet a confirmed reversal.
◆ SMC & Price Action
• The upper Liquidity Sell area has been completed → profit-taking pressure appears.
• Price is returning to Support Zone 4,275 – 4,270, where it previously held and created BOS.
• Below is a large OB 4,216, acting as a liquidity attraction area if the current support is broken.
• The FVG + Fibo Sell area above is a reaction zone if the price retraces.
◆ Key Levels
• Liquidity Sell (swept): 4,345 – 4,350
• Current Support: 4,275 – 4,270
• Lower OB: 4,216
• Supply / upper target (if rebound): 4,330 → 4,360+
◆ Trading Scenarios
➤ Scenario A – Pullback BUY (priority)
• Await reaction at Support 4,275 – 4,270
• Condition: maintain structure, appearance of rejection candle / buying reaction
• Targets:
▪ 4,305
▪ 4,330
▪ extended: 4,360+
• Invalid if clearly breaks 4,257
➤ Scenario B – Deeper Pullback
• If Support 4,275 is lost
• Monitor reaction at OB 4,216
• Only BUY when a new upward CHoCH appears
➤ Scenario C – Short-term Sell Retracement
• If price retraces to FVG + Fibo Sell but does not break the peak
• Observe rejection signals for short-term SELL back to the support area
◆ Summary
• Context: upper Liquidity Sell swept → prioritize waiting for pullback.
• Decisive area: 4,275 – 4,270.
• Losing this area → potential liquidity attraction to 4,216.
• Avoid FOMO BUY at premium; wait for clear reaction at support/OB.

XAU/USD: Buy on Pullback to FVG–OB 4.29x!1. Context & Price Structure (H1)
• The price is moving within an accumulation/wyckoff range with a descending trendline above and clear support below.
• After a series of strong fluctuations, the market has shown ChoCH points indicating that the cash flow is "shifting" continuously, not yet a one-way trend.
• At the current time, the most reasonable bias is to wait for the price to pull back to the discount zone (FVG–OB) to find a BUY point according to the scenario of expanding to the liquidity zone above.
2. Key Levels on the Chart
• Resistance / Range High: 4,347.818 → peak of the range, where a sweep/false break is likely before deciding the direction.
• FVG – OB (Buy Zone): 4,290.899 – 4,279.641 → confluence zone "attracting price", prioritize watching for BUY when confirmed.
• Range Low / Support: 4,274.429 → bottom of the range, is the invalidation point for the BUY scenario if decisively broken.
• Current reference price: around 4,325.920 → currently in the middle of the range, not an optimal entry point.
3. Trading Plan (Captain Vincent – with clear conditions)
Main Scenario – BUY at FVG–OB 4.29x–4.27x (priority)
• Expect the price to pull back to 4,290 – 4,280 to fill FVG and retest OB.
• At the BUY zone, only activate when confirmed:
Clear wick candle on H1/M15.
Bullish engulfing or bullish ChoCH on M15.
Price reclaims 4,290 after a deep touch.
• BUY Zone: 4,290.9 – 4,279.6.
• Stop (safe by structure): below 4,274.4 (stop the scenario if H1 candle closes below the range bottom).
• Targets:
TP1: return to the middle of the range 4,325 – 4,330.
TP2: retest 4,347.8.
TP3 extension: if breaking and holding above 4,348 → expect a "run" to a higher zone following the arrow (area 4.38x–4.39x on the chart).
Alternative Scenario – BUY Breakout if clean break of 4,347.8
• If the price does not return to FVG–OB but breaks straight through 4,347.8 with a strong H1 candle and closes above it.
• Then prioritize waiting for a retest of 4,347.8 before BUY continuation.
• Aim to hold according to the scenario of expanding to a higher zone, avoid FOMO right at the breakout candle.
Defensive Scenario – If breaking 4,274.4
• If H1 closes below 4,274.4 and does not reclaim immediately.
• Then the BUY scenario from FVG–OB is invalidated, prioritize staying out waiting for a new structure (avoid bottom fishing).
4. Risk Management Notes
• Do not enter orders when the price is in the middle of the range (around 4.32x) because R:R is not attractive.
• Prioritize "right zone – right signal" at FVG–OB, do not enter orders just because the price touches the zone.
• With range trading, always prepare for a sweep scenario: react quickly, manage volume tightly.

XAU/USD: Buy on Price Retracement in Discount AreaAfter the previous strong decline, gold has held firm at the channel bottom demand area and showed a clear upward reaction. Currently, the price is in a technical recovery phase, simultaneously returning to test the liquidity areas above.
On the macro side, market sentiment still leans towards the expectation that the Fed will maintain a softer stance, providing support for gold during downward adjustments.
Technical Structure (M30–H1)
The price is moving within a short-term upward channel
The 4,278 – 4,280 area plays an important demand role (structure bottom)
After forming a Higher Low, the price bounced up and maintained the upward structure
The areas above are liquidity + supply, need to observe price reactions
Trading Plan – MMF Style
Main Scenario – BUY according to structure
Priority BUY area: 4,300 – 4,304
Condition: price retraces to demand area, does not break the previous bottom
Targets:
TP1: 4,324
TP2: 4,353
TP3: 4,363 (liquidity above)
Alternative Scenario
If the price does not retrace deeply but breaks and holds above 4,324, wait for a retest to BUY following the trend.
Invalidation Area
If the price breaks strongly below 4,278, the short-term upward structure is invalidated
In that case: stay out, wait for new structure confirmation
MMF Perspective
The short-term trend supports BUY when the price retraces to the discount area.
Do not chase orders in the premium area – patiently wait for the price to reach demand, trade according to structure instead of emotions.
Daily Bias: Bullish above 4,278 – Priority to BUY pullback.

XAUUSD (Gold) – 15M | SMC Trade IdeaPrice has delivered a clean impulsive bullish leg, displacing above prior structure and confirming bullish BOS on the 15M timeframe. The move was followed by a brief pause, forming a premium supply reaction, which is now being used as a mitigation entry.
SMC Context
Strong bullish displacement confirms institutional intent
Entry aligned at discount to premium flip after BOS
Stop placed above the protected high to invalidate bullish narrative
Targets aligned with liquidity resting below equal lows / demand zone
Execution Plan
Bias: Short-term sell from premium
Entry: At marked mitigation zone
SL: Above recent high
TP: Liquidity sweep into lower demand zone
RR: Favorable, asymmetric structure

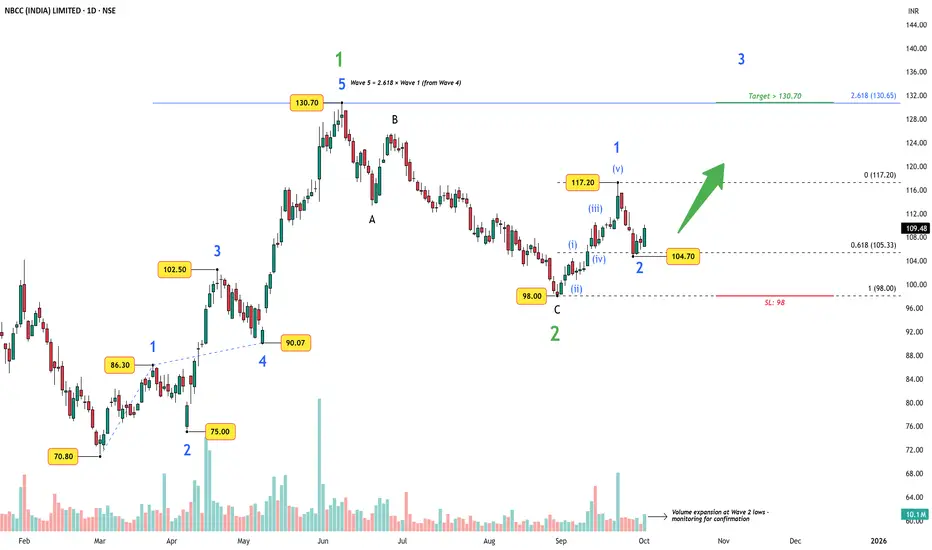
NBCC (India) – Wave 3 Setup Backed by Strong Project PipelineAfter completing a textbook 5-wave advance into 130.70 , where Wave 5 aligned exactly with the 2.618 extension of Wave 1 projected from Wave 4, NBCC corrected into 98. That low now marks a clean green Wave 2.
The recent bounce to 117.20 formed Wave 1 of a higher-degree Wave 3.
Price has retraced into the 104–105 zone (0.618 Fib) with visible volume expansion, suggesting accumulation.
Invalidation/SL sits at 98 , making risk well-defined.
Breakout above 117.20 opens the path toward 130.70+ and potentially much higher, in line with the 2.618 Fib target around 130.65.
Fundamentals in Brief
Market cap: ₹295.9B
P/E ratio: ~50.8, indicating premium valuation but supported by steady order book growth.
Revenue (FY24): ~₹115.9B, with Project Management Consultancy (PMC) as the major contributor.
Debt: Effectively zero – NBCC runs a net cash balance sheet, giving it flexibility.
Dividend yield (TTM): ~0.8% – small, but consistent payouts.
Margins: Net margin steady around 5–6%.
NBCC’s fundamentals support its technical setup: low leverage, steady revenues, and government backing in project management give confidence that the bullish Elliott Wave count has room to play out.
Disclaimer: This analysis is for educational purposes only and does not constitute investment advice. Please do your own research (DYOR) before making any trading decisions.
S&P 500: Positioned for a Santa Rally?While tracking the global markets — especially the US indices — one thing stood out clearly.
The rally from 6521.92 to 6895.78 unfolded as a clean impulsive move , not a corrective grind. That structural behavior is what made me treat this leg as an impulsive rally (Wave 1/A) rather than just another bounce.
Since then, price action has cooled into a Wave 2/B reset , pulling back towards key Fibonacci retracement pocket . Structurally, this looks more like a pause before continuation than the start of a larger breakdown.
From a broader sentiment perspective, the backdrop remains supportive. The Fed’s recent rate cut continues to favor risk assets, NVIDIA’s staggering earnings have reinforced confidence in the AI-led growth narrative, and the CBOE Volatility Index remaining subdued suggests markets are not in a fear-driven regime.
So… will Santa deliver a rally — or even deliver early?
At the moment, the market appears to be positioning itself towards key Fibonacci retracement levels , creating a favorable setup for a potential Santa rally . If the structure holds, Wave 3/C could be the move where Santa shows up with the goods.
And if the US index does start unwrapping a rally, history suggests Indian markets rarely stay on the sidelines — definitely something to keep on the radar.
Disclaimer: This analysis is for educational purposes only and does not constitute investment advice. Please do your own research (DYOR) before making any trading decisions.

Praj Ind (D): Aggressive Bullish Rev, Value Buy at Major SupportTimeframe: Daily | Scale: Linear
After a brutal 11-month downtrend, the stock has staged a violent "V-shaped" recovery from a 4-year historical support zone. This move is backed by the highest volume in months, signaling a potential trend change or a significant relief rally.
🚀 1. The "Why" (Catalyst for the 13%+ Surge)
The massive volume surge is likely driven by Value Buying and Short Covering :
- Historical Support: The stock hit ₹292 , a level not seen since mid-2022. Smart money often accumulates fundamentally sound companies at such multi-year structural supports.
- Oversold Conditions: After falling ~66%, the stock was deeply oversold. The removal of ethanol production caps for the 2025-26 supply year (fundamental tailwind) is finally being priced in.
📈 2. The Technical Structure
> The Floor (292-300): This is the "Line in the Sand." The stock tested this zone on Dec 9 and formed a base.
> The Ignition: The surge since yesterday (Dec 15) acts as an "Ignition Bar."
- Volume: 41.48 Million . This is not retail participation; this is institutional accumulation.
- Momentum: Rising ~14% in a short span confirms that the "bears are trapped."
📊 3. Indicators
- EMAs: The short-term EMAs (like 20-day) are yet to confirm a Positive Crossover because the move is so sharp. However, the price has decisively reclaimed the 20-day EMA , which is the first step.
- RSI: The rising RSI from oversold territory confirms momentum is shifting from bearish to bullish.
🎯 4. Future Scenarios & Key Levels
The primary challenge now is to sustain this vertical move.
> 🐂 Bullish Case (Continuation):
- Immediate Resistance: ₹369 . This is the previous breakdown level.
- Target: ₹427 . If ₹369 is cleared, the stock has an open path to ₹427 (which aligns with the 200-day EMA or major Fibonacci level).
> 🛡️ Support (The "Higher Low"):
- Immediate Support: ₹315 – ₹320 . In a healthy uptrend, the stock should not fall back to ₹292. Any pullback should ideally hold above ₹315 to form a "Higher Low" structure.
Conclusion
This is a classic "Dead Cat Bounce" turning into a Reversal . The volume confirms validity. The trade is now to buy on dips near ₹320 , targeting ₹369 and ₹427 . Avoid chasing the vertical rally; wait for a small cooling off.

The railway stocks are okay for a reboundqThe Fib retracement might take the counters that have been is distress for a large part of last many years to go back to highs

USDJPY – Potential for a Volatile End to the WeekIt’s the last full trading week of the year before the Christmas break but that doesn’t necessarily mean that FX markets will be quiet. The calendar is still packed full of important risk events, and when combined with the possibility for decreasing levels of liquidity into Friday’s close it could be a recipe for volatility.
Take USDJPY for example. It has already been the biggest mover in the G7 currency space with its fall from opening levels at 155.80 on Monday down to a low of 154.68 so far this morning and the key risk events are still to come. These events take the form of US Non-farm Payrolls later today (1330 GMT), US CPI on Thursday (1330 GMT) and then the Bank of Japan interest rate decision (0300 GMT) and press conference (0630 GMT) on Friday.
Traders have been eagerly awaiting today’s latest US payrolls release which could impact the direction of the US Dollar in the short term. A weaker US labour market reading may increase the chances for a Federal Reserve interest rate cut in the first quarter of 2026, which could weigh on USDJPY prices, while a stronger number could see USDJPY strengthen.
Similarly, the direction of US inflation on Thursday could be important as some Fed policymakers have signalled they are uncomfortable with prices rising consistently above the US central bank’s 2% target. A higher-than-expected CPI reading could see US bond yields rise, taking USDJPY higher, while a weaker number could see USDJPY come under pressure as the focus shifts to the Bank of Japan rate decision on Friday morning.
At this meeting, the Japanese central bank is expected to raise interest rates by 25bps (around 90% probability), so anything else would be a shock that may lead to a nasty spike in USDJPY volatility. The comments of Governor Ueda in the press conference could also be important depending on what hints he gives about the potential for further rate hikes through 2026.
That’s it, and yes, I know, a lot to take in and prepare for! Looking at the charts, USDJPY has been in a 270-point trading range between 154.30-157.00 for the last month and there could be potential for that to change.
With that in mind, lets assess the technical outlook.
Technical Update: Are Further Corrective Themes Emerging?
The USDJPY rally from the 154.34 December 5th low to the 156.96 December 9th high was impressive, yet subsequent price action may be suggesting a slowing in upside momentum, even further price weakness.
A key concern for traders may be that the December 9th high remained well below the November 20th extreme at 157.89, reinforcing caution regarding near‑term price activity.
The risk is that this activity represents a ‘weak test’ of the 157.89 price high. In other words, while previous moves higher were accompanied by buying support strong enough to break and close above prior highs and resistance levels, this time the market has been unable to do so, raising concerns over the sustainability of upside momentum.
Traders may now question whether recent price activity signals a slowing of upside momentum and the potential for a phase of weakness. Much may depend on future sentiment once the outcome of the key risk events is known, making it prudent to remain aware of the key support and resistance levels as key reference points in the days ahead.
If Price Weakness is to Materialise:
It may still be argued that activity since the November 20th high reflects a phase of price consolidation within the longer‑term uptrend. Therefore, the focus may initially turn to the December 5th low at 154.34 as the first key support level.
Closing breaks below 154.34 could suggest a developing pattern of lower highs and lower lows, which is the basic definition of a downtrend. Should this occur, risks may then shift toward further price weakness with scope to test lower supports.
As the chart shows, closing breaks below support at 154.34 could see a deeper retracement of the October 1st to November 20th advance. If this is the case, the 38.2% level at 153.16 may be tested, with scope for extension towards the 50% retracement at 151.70.
If Support Holds and Price Strength Develops:
Of course, the 154.34 December 5th low support may yet hold and allow fresh price strength to develop. In that case, the focus may then turn to 156.01, the current level of the Bollinger mid‑average, as the first resistance. Closing breaks above 156.01 might now be required to open scope for higher levels
A confirmed break above 156.01 in USDJPY could trigger further upside pressure, with 156.96, the December 9th high, emerging as the next resistance. Should this level also give way, upside potential may extend toward 157.89, the November 20th high
The material provided here has not been prepared accordance with legal requirements designed to promote the independence of investment research and as such is considered to be a marketing communication. Whilst it is not subject to any prohibition on dealing ahead of the dissemination of investment research, we will not seek to take any advantage before providing it to our clients.
Pepperstone doesn’t represent that the material provided here is accurate, current or complete, and therefore shouldn’t be relied upon as such. The information, whether from a third party or not, isn’t to be considered as a recommendation; or an offer to buy or sell; or the solicitation of an offer to buy or sell any security, financial product or instrument; or to participate in any particular trading strategy. It does not take into account readers’ financial situation or investment objectives. We advise any readers of this content to seek their own advice. Without the approval of Pepperstone, reproduction or redistribution of this information isn’t permitted.

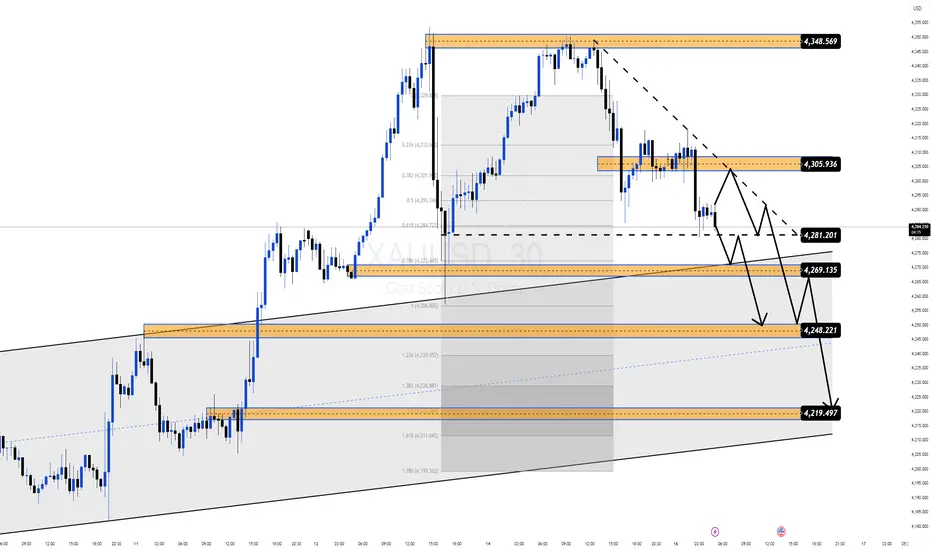
XAU/USD: Sell on Bearish OB, Buy Deep at Bullish OB1. Context & Price Structure (M30)
• The price is in a downward correction after a strong previous increase.
• On the retracement zone, EQH + ChoCH decrease appears → signal of weakening buying flow, prioritize "retracement to sell" in the short term.
• The price is still pressed under the descending trendline, so the short-term bias remains downward until a clear break occurs.
• Support Zone 4,275 is the decisive point: if held, it will rebound technically, if broken, it opens the path to the lower demand zone.
2. Key Levels (according to the chart drawn)
• OB Bearish (Sell Zone): 4,308 – 4,312 (≈ 4,311.888) → supply zone + trendline confluence, prioritize watching for SELL when retracing.
• Support Zone: 4,272 – 4,276 (≈ 4,275.451) → central support zone, can create a rebound/retracement.
• Mid Support / Target: 4,247.624 → next target if 4,275 is broken.
• OB Bullish (Buy Zone): 4,223.400 – 4,205.983 → strong demand zone, expected to sweep and reverse.
3. Trading Plan (with clear conditions)
Scenario 1 – SELL on retracement at Bearish OB (main scenario)
• If the price retraces to 4,308 – 4,312 and a rejection reaction appears:
strong pin bar
downward engulfing
or ChoCH decreases again on M15/M30
• Then prioritize SELL according to the correction trend.
• TP1: 4,275
• TP2: 4,247
• TP3: 4,223 (approaching OB Bullish)
• Invalidation: M30 closes above 4,318 and holds above → stop SELL idea.
Scenario 2 – BUY deep at Bullish OB (important scenario to catch a large retracement)
• If the price breaks 4,275 with a clear M30 candle and slides down to 4,223 – 4,206.
• Wait for Liquidity Sweep + reversal signal:
pin bar at OB
upward engulfing
or ChoCH increases (M15/M30)
• When confirmed, prioritize BUY.
• TP1: 4,247
• TP2: 4,275
• TP3: 4,308
• Invalidation: M30 closes below 4,198 → stay out and observe.
4. Risk Management Notes
• Do not chase SELL when the price is close to 4,275 (support zone).
• Do not BUY early before the price hits Bullish OB and confirmation is received.
• If the price reclaims strongly above the trendline + 4,312, the bias will shift to "BUY pullback" instead of "Sell retracement."

XAU/USD – Distribution at the Top, Sell on Rallies Market ContexAfter a strong bullish impulse, Gold is now showing clear signs of exhaustion near the upper liquidity zone. Price failed to sustain above the recent high and has started to rotate lower, suggesting a distribution phase rather than continuation.
From a macro perspective, although expectations around Fed policy remain mixed, short-term positioning looks crowded on the buy side, increasing the probability of a corrective move to rebalance liquidity.
Technical Structure (M30–H1)
Price rejected sharply from the 4,348 supply / liquidity zone
A lower high has formed under descending trendline resistance
Market is trading below key intraday structure, signaling bearish pressure
Current price action favors a sell-the-rally approach
Trading Plan – MMF Style
Primary Scenario – SELL Continuation
Preferred SELL zone: 4,300 – 4,306
Confirmation: bearish rejection / weak bullish momentum
Targets:
TP1: 4,281
TP2: 4,269
TP3: 4,248
Extended target: 4,219 (major demand + channel support)
Invalidation
A clean break and hold above 4,348 would invalidate the short-term bearish bias.
In that case, stand aside and wait for new structure confirmation.
MMF Perspective
At premium levels, risk favors patience over chasing buys.
The focus now is on capital protection and selling rallies, waiting for price to reach deeper demand zones before considering any new bullish setups.
Bias today: Bearish below 4,348 – Sell rallies, manage risk strictly.
BTC Weekly Downtrend
BTC has moving in a downtrend trend on weekly chartand soon moving to the 50% retracement level at 70.8k
further down is 58.4 - 48k zone
its a high probablility zone for a weekly bullish reversal to take place as it will the long consolidation of buyers.
