BEL Triangle & Flag BreakoutBEL is attempting breakout from Triangle and Bull Flag Pattern on 1D timeframe. Watch for closing at End of the Day. Watch for Earnings because this stock carries earnings risk.
FLAG

INDIAN HOTELS (INDHOTEL) – Swing Trade SetupINDIAN HOTELS (INDHOTEL): CMP: 748.65; RSI: 51.47
✅ Trend: Strong Bullish (Weekly Golden Cross)
📐 Pattern: Flag consolidation → Breakout setup
🔔 Entry:
• Above ₹770 (weekly close / breakout confirmation)
⛔ Stop Loss:
• ₹700 (below flag support & recent swing low)
🎯 Targets:
• T1: ₹820–830 (partial profit)
• T2: ₹880–900 (flag pole projection / Wave-V zone)
📌 Risk–Reward: ~1:2.5 to 1:3
⚠️ Note:
• Enter only on breakout with volume
• Trail SL once T1 is achieved
📈 Trend is up. Consolidation is healthy. Breakout can lead to next expansion leg.
📌 Thanks a ton for checking out my idea! Hope it sparked some value for you.
🙏 Follow for more insights
👍 Boost if you found it helpful
✍️ Drop a comment with your thoughts below!

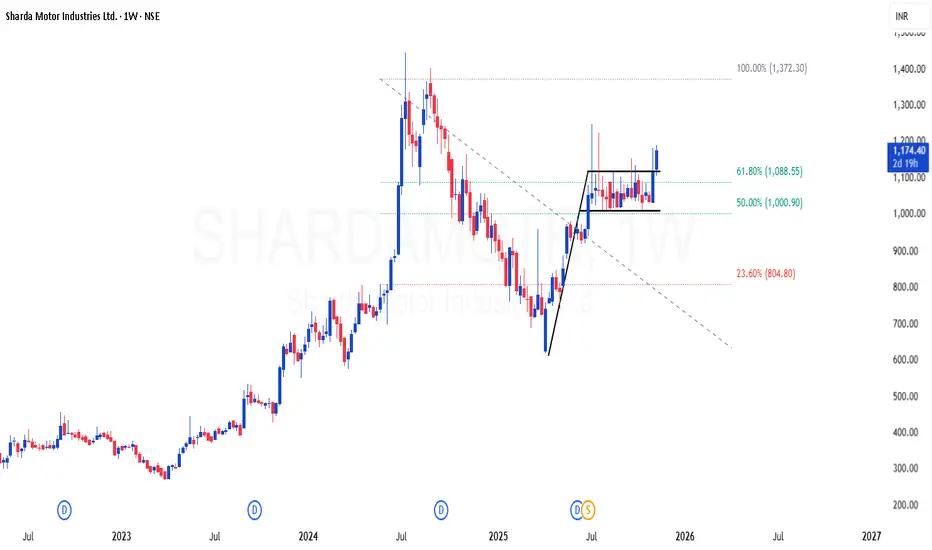
SHARDAMOTR | Nice flag breakout in weekly time frameSHARDAMOTR | Nice flag breakout in weekly time frame
CMP : 1170 (Dip : 1000)
SL : 900
Target : 1800 (based on fib)
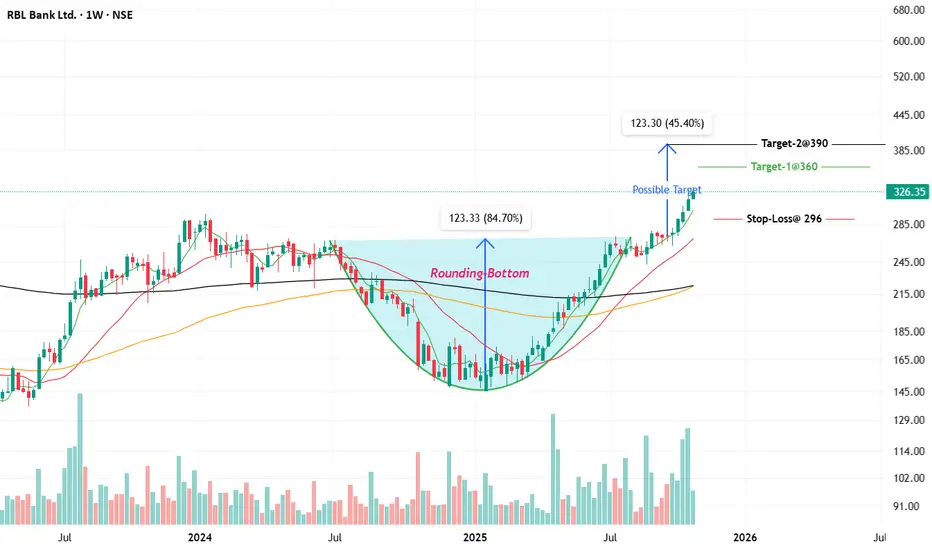
RBL Bank on the Verge: Weekly Chart Signals a Fresh Trend BreakRBL Bank has shown strong bullish momentum in its weekly chart, supported by rising price, strong moving averages, and a robust uptrend. The stock is currently trading near its 52-week high at around ₹326, indicating significant strength in the ongoing trend.
Technical Indicator Analysis
• Price and Trend: The stock has risen over 42% in the past year and over 7% in the last month, supported by strong volume and positive sentiment.
• Moving Averages: The 50-week and 200-week moving averages are sloping upwards, and the price is trading well above both, which is a bullish sign.
• Relative Strength: RSI (implied by the breakout and new highs) likely remains in bullish territory, confirming momentum.
• Support and Resistance: The stock has immediate support near ₹300 and strong resistance is seen at the recent high of ₹331.50.
Chart Pattern and Target
• Pattern Observed: A continuation breakout, possibly following a flag or rounding bottom pattern, is implied. The price action has broken past key resistances, and the trend remains strong.
• Entry Point: New entries can be considered on minor pullbacks toward ₹310-315, or on a weekly close above ₹331.50 for momentum traders.
• Target: Immediate target is the all-time range toward ₹350 . If momentum continues, longer-term targets could be in the ₹380–400 zone, using previous swing projections and extension from current levels.
• Stop Loss: Suggested stop-loss for positional trades is below ₹296 on a closing basis to protect gains and manage downside risk.
Overall, the weekly technical for RBL Bank support a bullish stance with buy-on-dip and breakout strategies, as long as the price remains above the key moving averages and stop-loss.
📌 Thanks a ton for checking out my idea! Hope it sparked some value for you.
🙏 Follow for more insights
👍 Boost if you found it helpful
✍️ Drop a comment with your thoughts below!
Jio Financial Services (JIOFIN)Pattern: Bullish Flag
Breakout Zone: Above ₹312
Structure: Flag developing after a strong pole; EMAs supportive and flattening upward
Momentum: RSI recovering above 50, MACD histogram turning positive
Plan:
Buy Trigger: Close above ₹312
Stoploss: ATR-based (~₹298)
Targets: ₹360 → ₹388
View: Post-consolidation breakout potential; improving sentiment in Financials sector.

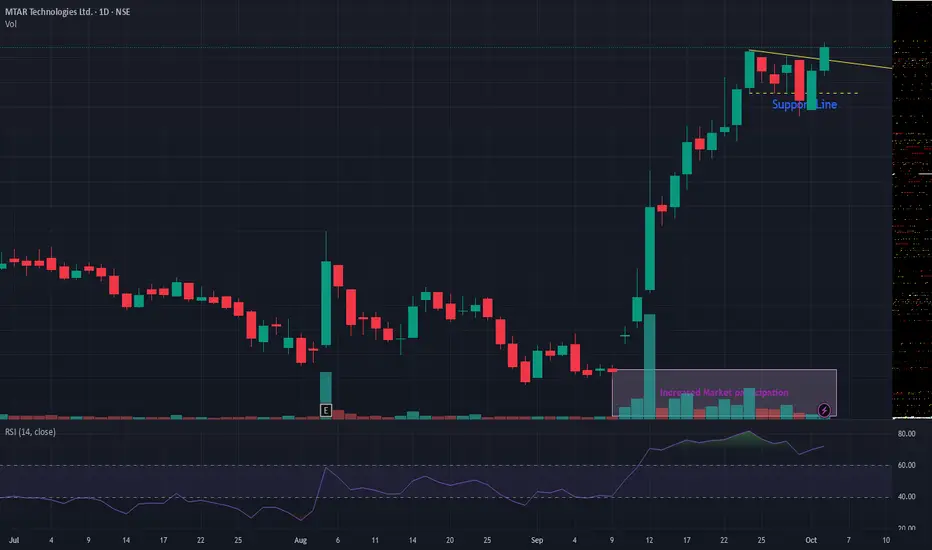
MTARTECHMTARTECH giving trend-line breakout. VCP breakout also observed. Volume too has spiked. As long as it is above support line, the stock seems attractive. Many defense stocks are showing strength and trying to give a run! Keep in your watchlist
Silver Bullish Breakout on Monthly & Weekly CharPattern Formed: Symmetrical Triangle (Long-Term Consolidation)
Breakout Type: Bullish Breakout on Monthly & Weekly Chart
Volume Confirmation: Strength in breakout with price expansion
Measured Move Target: ~$44 (based on triangle height projection)
Immediate Resistance Zone: $44.11 (Historical supply zone)
Support Levels Post-Breakout:
Immediate Support: $34.78
Strong Support: $33.28

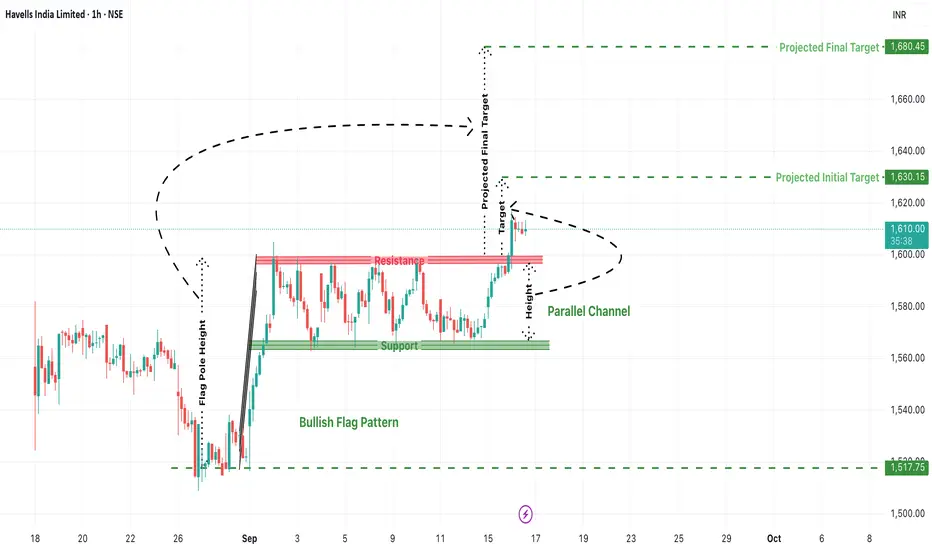
Havells Bullish Flag Breakout: Can We See a Rally to 1680+?Havells India Ltd. is currently showing a classic bullish technical setup—a Bullish Flag Pattern—that could lead to a potential breakout and strong upside movement in the short term. Traders who favor breakout-based strategies should pay close attention to this chart, especially considering the structured parallel channel and previous rally that preceded it.
1. Bullish Flag Pattern: Anatomy of the Setup
A bull flag is a continuation pattern that occurs after a sharp price rise (flagpole), followed by a period of consolidation within a narrow parallel channel (the flag). This structure typically suggests that the bullish trend will resume once the price breaks out of the flag range.
In Havells:
Flag Pole: The stock surged sharply from the 1517 zone to near 1610, forming a vertical rise.
Flag/Channel: Price moved sideways within a narrow support at ~1570 and resistance at ~1610, creating a clean parallel channel.
This shows price compression after a strong move, typically a sign of healthy consolidation before another leg up.
2. Breakout Levels and Price Action Confirmation
As per the current chart:
Havells has broken above the resistance zone around 1610, signaling a potential breakout.
The breakout candle is attempting to close above the red resistance band, and follow-up candles will be crucial to confirm strength.
A retest of this breakout zone could offer ideal long entries.
3. Projected Targets from the Pattern
Using the flagpole height, we can project upside targets from the breakout point:
Initial Target: ₹1630.15
A conservative target based on minor resistance and pole extension.
Final Projected Target: ₹1680.45
This marks the full measured move and could be achieved if the rally sustains momentum.
4. Ideal Trading Plan (For Traders)
Entry:
After confirmed breakout above ₹1610
Or on retest near ₹1600–1610 zone with bullish price action.
Stop Loss:
Below the flag support zone at around ₹1570
Aggressive traders can keep it below ₹1585.
Targets:
T1: ₹1630
T2: ₹1680+
Risk-Reward Ratio:
Minimum 1:2 depending on entry price.
5. Risk Scenarios to Watch For
False Breakouts: If the breakout doesn’t sustain and price falls back into the channel, it may trap early longs.
Macro Events: Broader market volatility (Nifty moves or global cues) can impact momentum.
Volume: Lack of volume on breakout candles can reduce conviction—always monitor volume to confirm strength.
Conclusion: Havells Looks Set for a Fresh Rally
This is a textbook bullish flag breakout in formation, with clear upside potential. If the momentum sustains, Havells could very well reach 1680+ in the coming sessions. However, traders must practice disciplined risk management, wait for confirmation, and avoid chasing without a proper plan.
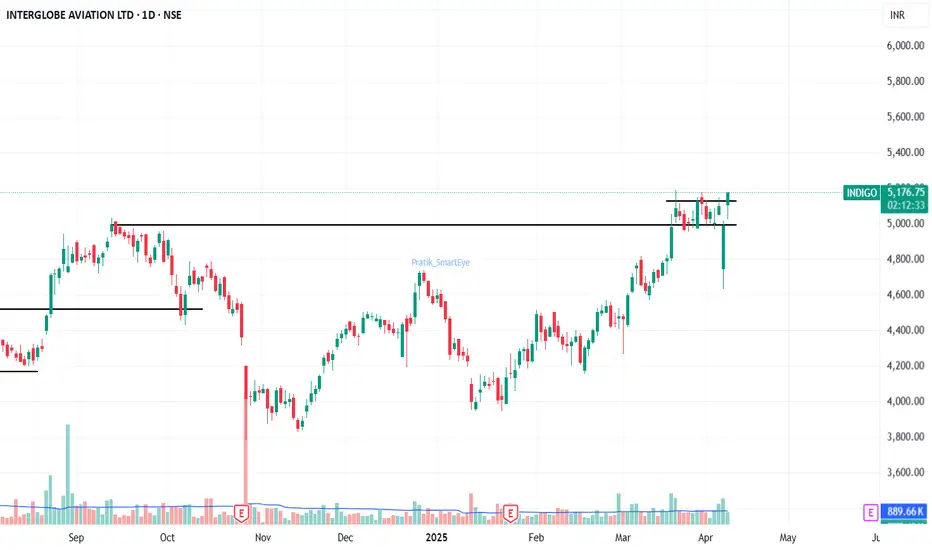
Indigo - Breakout of flag pattern. CMP 5150.Indigo - Breakout of flag pattern. CMP 5150.
After a rounding bottom breakout the stock traded in a small zone and breaking above the zone today. sustained close above the flag line can give a good up-move.
SL 5000 closing basis.
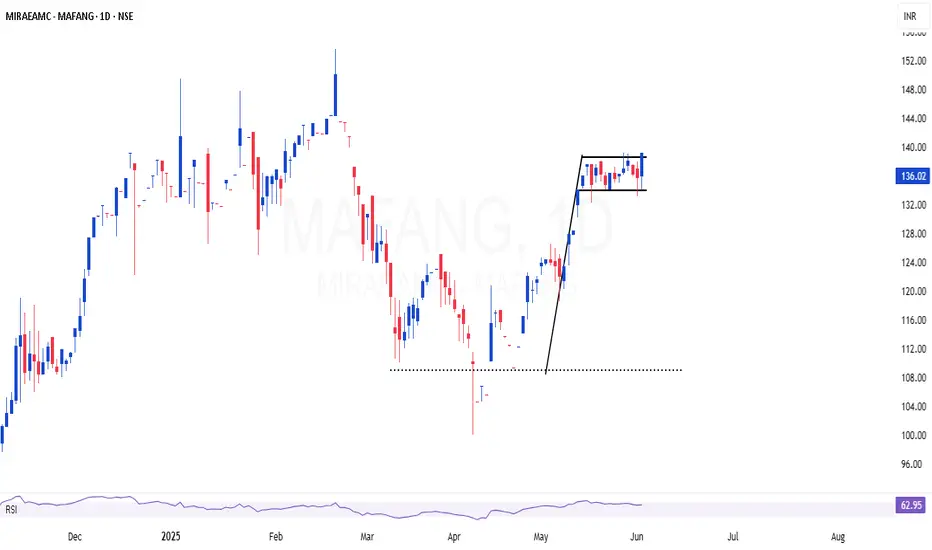
MAFANG | Excellent bull flag setup in top class index fundMAFANG 🏁| Strong buy in top class index fund 👌
-Strong uptrend supported by volume
-Consolidation near all-time highs — bullish structure
-Global tech dominance + AI tailwinds
MAFANG (Meta, Apple, Facebook, Amazon, Netflix, Google) is showing solid momentum and forming a strong technical base in a top-tier index fund.
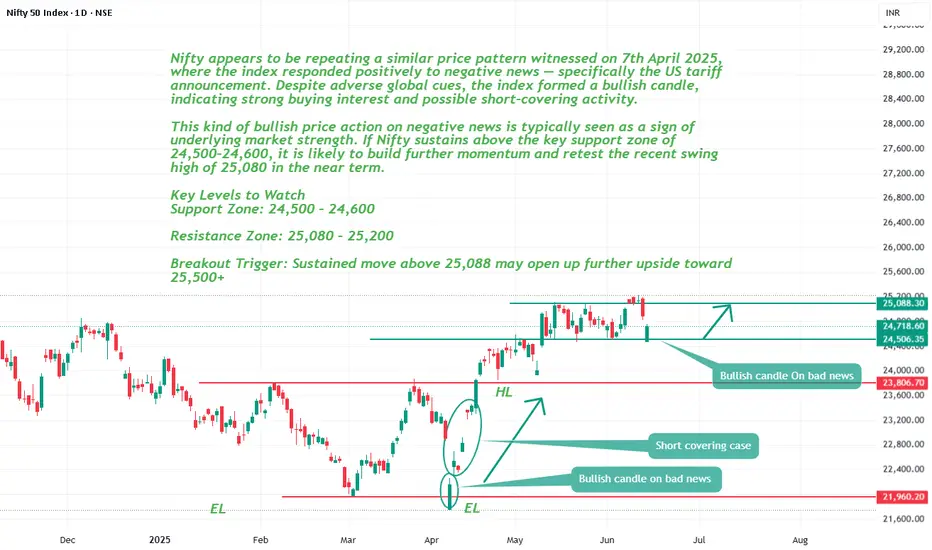
Nifty appears to be repeating price pattern of 7th April.Nifty appears to be repeating a similar price pattern witnessed on 7th April 2025, where the index responded positively to negative news — specifically the US tariff announcement. Despite adverse global cues, the index formed a bullish candle, indicating strong buying interest and possible short-covering activity.
This kind of bullish price action on negative news is typically seen as a sign of underlying market strength. If Nifty sustains above the key support zone of 24,500–24,600, it is likely to build further momentum and retest the recent swing high of 25,080 in the near term.
Key Levels to Watch
Support Zone: 24,500 – 24,600
Resistance Zone: 25,080 – 25,200
Breakout Trigger: Sustained move above 25,088 may open up further upside toward 25,500+
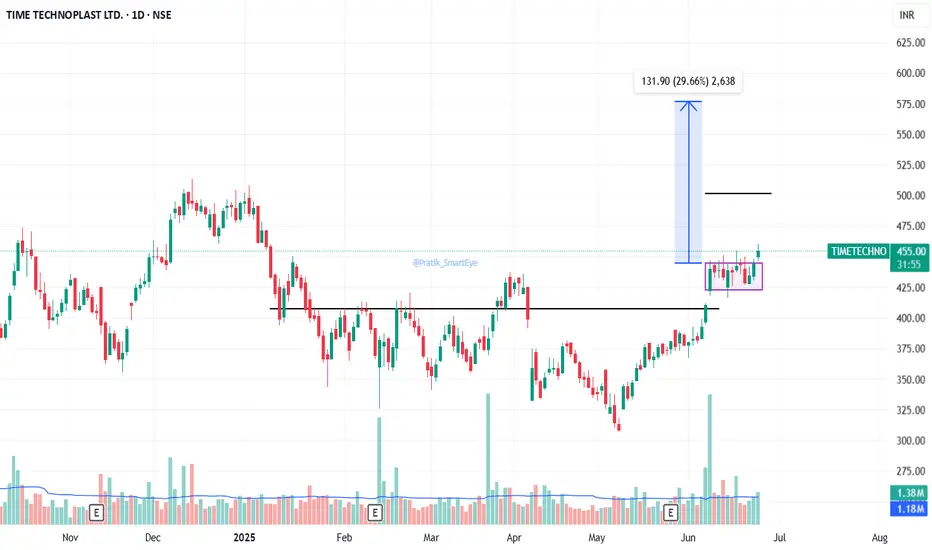
Time Technoplast: Box / Flag BreakoutTime Technoplast: Box / Flag Breakout. CMP 454.
Resistance at 500/576.
Support at 423.
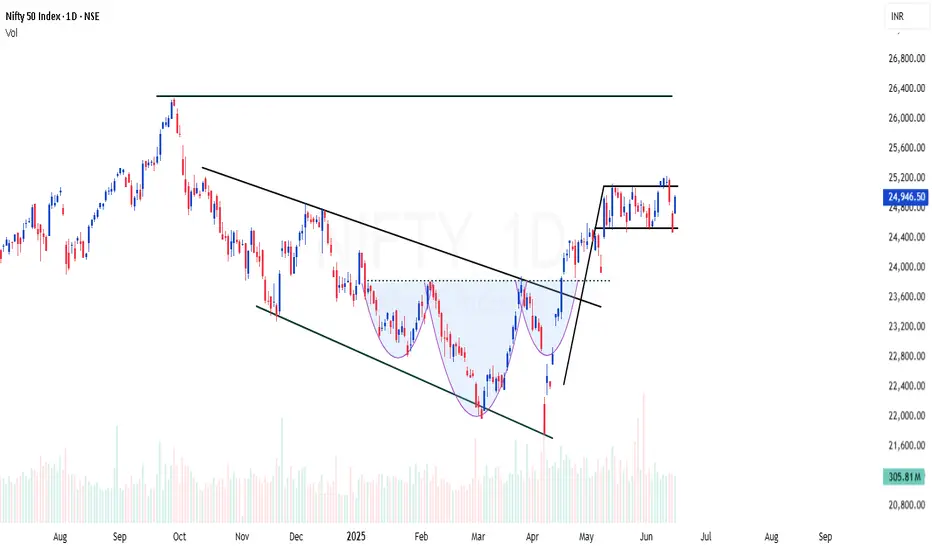
NIFTY | Back to back bullish patternsNIFTY showing back to back bullish signs
Channel breakout - Done
Inverted Head & Shoulder breakout (INHS) - Done
Now forming flag setup
NIFTY shows strength to move another 15% this year
BPCL | Ferocious Flag - Looks good for 30%BPCL | Ferocious Flag 🏁
Looks good for 30% based on the flag setup
Keep SL below 300 for short term trading position
CMP : 334

TechM - Flag Breakout A good Flag Breakout on Daily Chart.
Indicators is also showing strength.
Breakout above 1610
Flag height - 425 points
Target - 2000
#ShortTerm Trade.

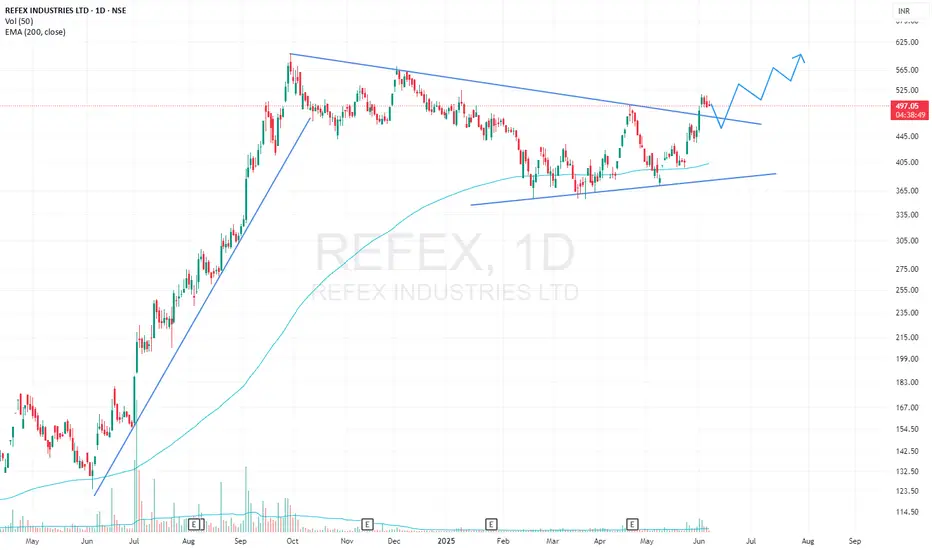
REFEX Triangle & Bull Flag BreakoutREFEX has given a breakout from Symmetrical Triangle and Bull Flag pattern on 1D timeframe with high volumes. Stock has also bounced several times from 200 EMA. Long Position can be initiated with proper risk management.
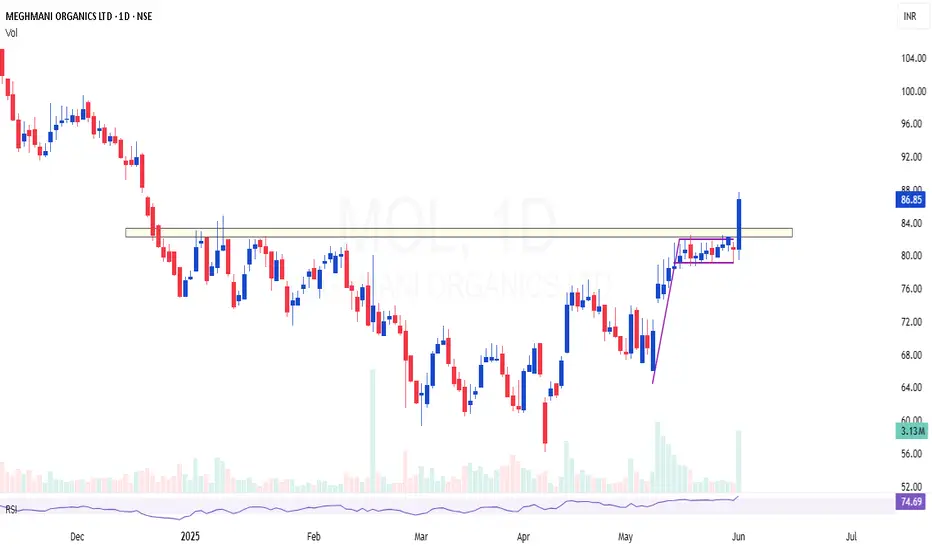
MOL | Breakout Above Supply Zone | Flag + 200 EMA ConfluenceMOL | Strong Breakout Above Supply Zone | Flag + 200 EMA Confluence
Previously shared around the ₹70 level — now showing clear strength with a decisive breakout above the supply zone, backed by strong volume.
✅ Breakout Confirmation: Price has convincingly breached previous resistance, which now acts as support. The volume accompanying this move adds weight to the breakout.
📈 Flag Formation (Daily Timeframe): A clean bull flag is visible on the daily chart — a classic continuation pattern indicating further upside potential.
📉 200 EMA Support: The 200 EMA is holding well and aligns perfectly as a dynamic support, reinforcing the current bullish structure.
🧾 Fundamentals Supporting the Technicals: Recent quarterly results suggest the bottom may already be in place, adding a fundamental tailwind to the technical setup.
🟢 Conclusion: This zone offers an excellent area of value for swing traders and position holders. Watch for sustained momentum and retests as potential entries.
CARERATING | Channel + Flag breakout with 200 EMA supportCARERATING | Channel + Flag breakout with 200 EMA support
High probable setup
CMP : 1237
SL : 1150
Target : 1550

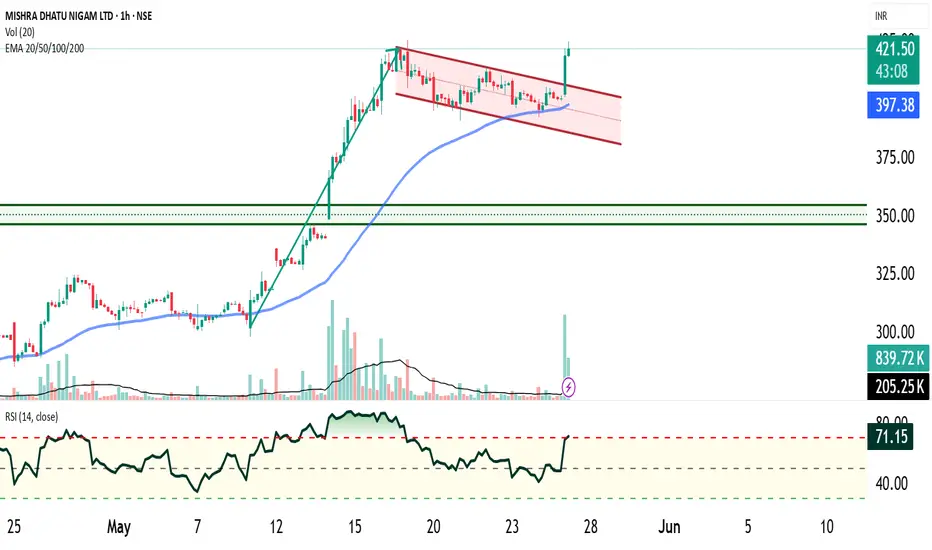
MIDHANI – Bullish Flag Breakout📊 Pattern Analysis
1. Pole Formation:
The initial rally forming the flagpole is marked by high-momentum bullish candles rising at approximately a 60° angle, supported by increasing volume, indicating strong institutional buying and trend conviction.
2. Flag Formation:
Following the pole, the stock entered a consolidation phase forming a downward-sloping parallel channel (the flag). This retracement occurred on declining volume, a classic sign of a healthy correction with no aggressive selling pressure — reinforcing the validity of a bullish flag.
3. Breakout Confirmation:
The stock has now broken out above the flag resistance with a large bullish candle and surge in volume, confirming the continuation of the prior uptrend. The breakout candle shows a decisive close above the flag range, indicating strong buyer interest.
📈 Technical Indicators
Volume: Volume has spiked significantly on the breakout day, validating the move.
50 EMA: Price has respected the 50-day EMA, which has acted as dynamic support throughout the flag formation.
RSI: The Relative Strength Index is currently above 65, indicating strong bullish momentum but still below overbought levels, allowing room for further upside.
🎯 Trade Setup
Parameter Level
Entry On breakout confirmation or minor pullback
Target Height of the pole added to breakout point
Stop-Loss Below the recent swing low (bottom of flag) or trailing SL aligned with the 50 EMA
Risk-Reward Favorable – allows strategic trailing of profits
📌 Example Calculation:
If the pole is ₹80 high and the breakout occurred at ₹320, target = ₹400.
📌 Conclusion
MIDHANI has confirmed a textbook bullish flag breakout with strong technicals in place:
High-angle pole on volume,
Shallow flag pullback with weak volume,
Breakout with rising momentum and EMA support.
This setup suggests a strong trend continuation and offers an attractive opportunity for momentum traders and swing positions.
🔁 Call to Action
✅ Follow for more updates
👍 Like if you found this analysis helpful
📤 Share with your friends and fellow traders
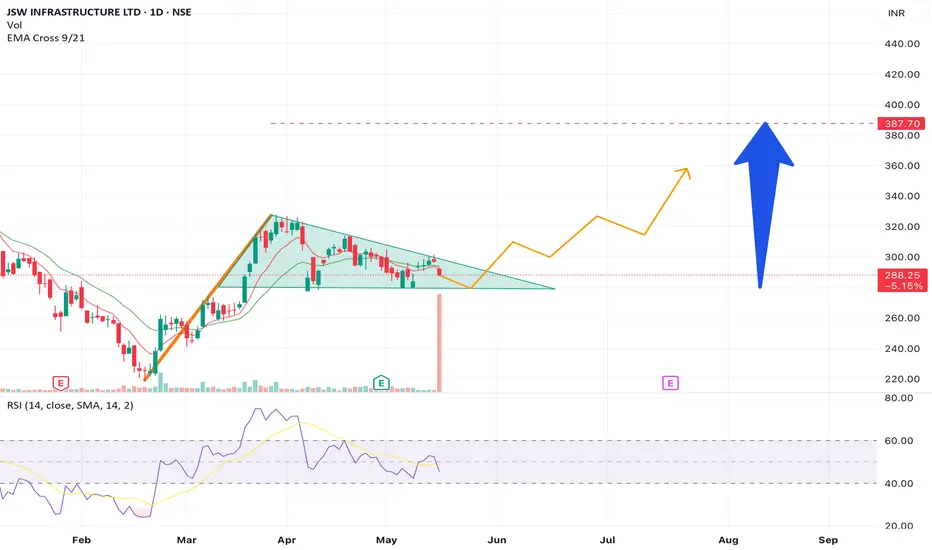
JSW Infrastructure got a huge volume transaction. Long probableA super huge volume transaction has happened in JSW infra. It has formed flag and pole pattern in recent times breakout from the pattern has a probable upside with significant return.
Alembic Ltd – Inverted Flag Pattern Forming | Breakout Trade SetAlembic Ltd appears to be forming a classic inverted flag pattern on the daily chart:
Bearish Flagpole: A strong and sharp downward move from ~₹148 to ₹88 established the flagpole.
Bullish Flag (Retracement Channel): Since March, the price has been moving in a parallel rising channel — a typical retracement phase.
The price is currently near the lower trendline of the flag, suggesting a potential entry point for a breakout trade.
Support zone : Around ₹100–₹101 near the lower channel boundary.
Target: ₹113–₹115 (upper boundary of the flag channel).
Stop-Loss: Below the lower trendline of the flag (~₹96), or tighter based on risk preference.
Bias:
Neutral to slightly bullish in the short term as long as price stays within the flag.
Watch for a volume-supported breakout above recent swing highs (~₹105) to confirm momentum toward the target.

Rossari Biotech - Bullish FlagA good Flag Breakout
Fundamentally also the stock looks strong.
Breakout above 705
SL 680
Pattern Breakout Target : 805

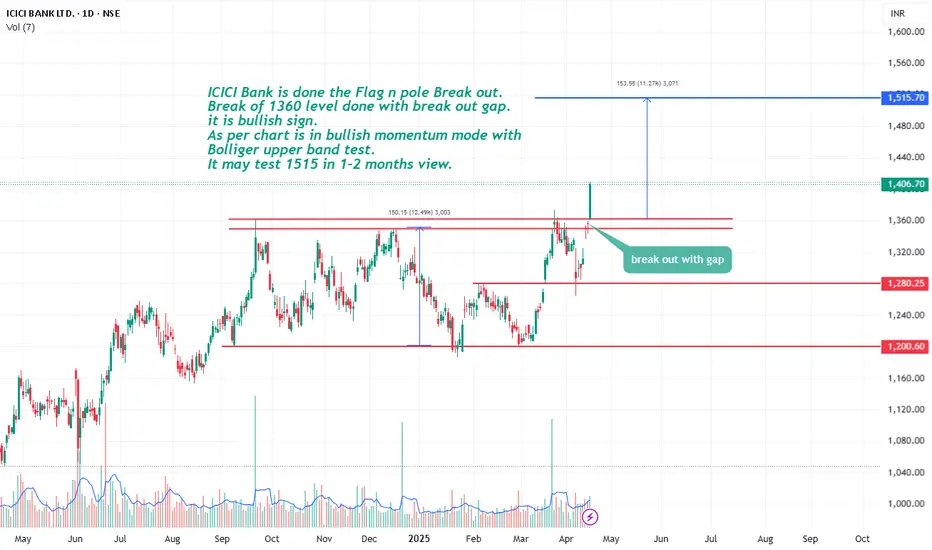
ICICI Bank on flag n pole breakout ICICI Bank is done the Flag n pole Break out. Break of 1360 level done with break out gap.
it is bullish sign. As per chart is in bullish momentum mode with Bolliger upper band test.
It may test 1515 in 1-2 months view.