Nifty 50 Weekly chart bullish flag patternHi everyone!
This is my first idea on this platform this year.
Due caution advised. Only for education learning purposes.
On weekly charts, NIFTY is seen following the bullish flag pattern. If it manages to not plummet this week and sustain above 17700, it shall surely mark a journey towards 18350 and beyond in the next couple of weeks.
I’m going to buy some calls and short some puts if it sustains above 17700 and would hedge it with put buys.
FLAG

intraday, swing, short termhead and shoulders + flag pattern is formed
midcap and smallcap stocks are going to boom
intraday opportunity is less, but for two to three days of holding is good
for long term investment
reffer my old analysis attached below

L&T with many confluences....LONGGLT has formed a complete double bottom move and hit an important resistance level forming a bullish flag pattern and a break of resistance level on above average could lead to a long trade.
Observe the moving average crossover and high Volume.
Targets of T1 and T2 could be taken
Stop Loss below the recent flag swing low.
Keep It Simple

long term investment; min 70% return; inverted head and shoulderinverted head and shoulder is formed in weekly chart
wait for event of this script
incase earnings is positive and candle close above 760 then go for it,
untill then wait for news
long term investment; min 70% return
huge potential is there.
investment ;
if you are intrested in investmet, go for it with small risk,
more possibility is there to breakout.

BALKRISIND | Trendline + Flag breakout - Looks potential for 15%BALKRISIND | Trendline + Flag breakout - Looks potential for 15%
CMP : 2350
SL : 2230
Target : 2700
1:3 risk reward setup
Last time flag failed, it doesn't stop us from taking again when you respect and trust a system 💪

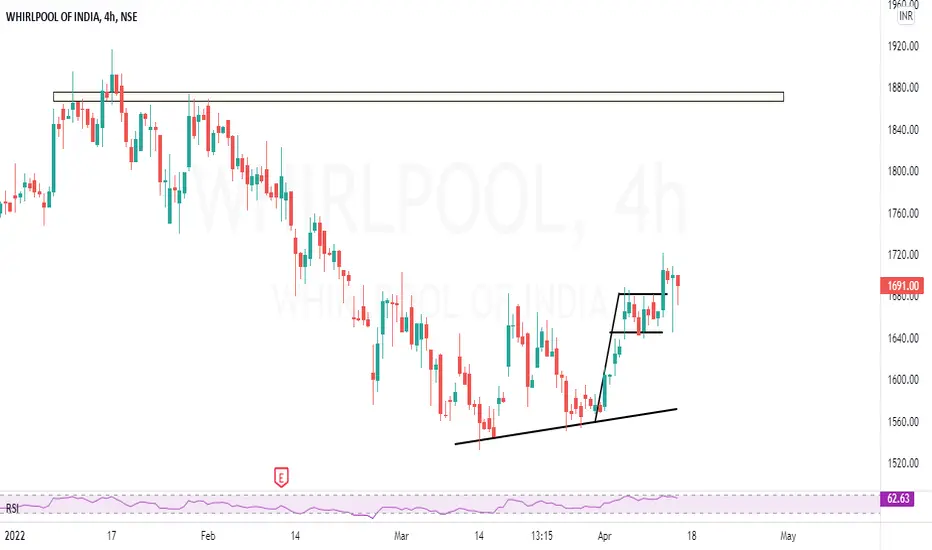
WHIRLPOOL | Simple flag breakout - Looks promising for 10%WHIRLPOOL | Simple flag breakout - Looks promising for 10%
CMP : 1690
SL : 1620
Target : 1860
1:3 risk reward setup
Bulls taking charge ?NSE:TATAMTRDVR NSE:CNXAUTO
Technically strong !
Look out if bulls can charge ahead successfully!

HEROMOTOCO - SWING TRADE ANALYSISNSE:HEROMOTOCO
The auto sector have been outperforming in such a bearish market.
Most of the auto stocks have broken out of different resistance
one of them is heromotoco it has raised well and now consolidating near
previous swing high and forming a continuation pattern if it crosses 2810 then
A new 2nd bull leg is expected.
all levels has been mentioned on chart
DM me for more detail
happy trading!

Bullish Flag Pattern | BTCUSDT Intraday TradeHi Guys,
Here is a trade for you in Bitcoin, all the relevant details are mentioned in Chart.

AMBUJACEM ready to resume rallyAMBUJA CEMENT formed Flag & Pole pattern on Weekly & Daily charts. and on small timeframe facing resistance with a falling trendline. It may give larger targets on positional trade.

AMBUJA CEMENT LOOKS BULLISH ABOVE 375Ambuja cement looks bullish above 375.
Bullish Flag pattern created. above 375 it is clear breakout.
Entry - 375 - 380
Target - 420 , 450
Sl - 345
(Education purpose only )

Bank nifty1.global sentiment are confuse for me
2. war was not end
(Chart shows a lower lows and pattern formation )
1.IF Tomorrow gap up 5 min or 15 min candle if break the resistance 33482.. if we can see the price action for buying side and exit at the target price 33618
2.If Open in flat wait for the trend up side or downside Or it may have side ways then take the trade
3.if gap down wait For close the 5 min or 15 min candle the crossed 33000 buy and wait for the target
Weekly high and low should be mark
Total Oi base call side 4,19,077 compare to put side 3,52,723 OI
**(Friday
So call atm to 500 points itm contracts 65,595 oi
Put atm to 500 points itm contracts 39,402 oi
atm options added 33500 strike price
Note . this just prediction. market can happen anything

Nifty 50global sentiment are confuse for me
2. war was not end
Observe the trend lines
(16000)Fib 50 % reversal level for down side
(Chart shows halt and flag pattern )
1.IF Tomorrow gap up 15 min candle if break the resistance 15917 .. if we can see the price action for buying side and exit at the target price no Trail as per your rules
2.If Open in flat wait for the trend up side or downside Or it may have side ways then take the trade
3.if gap down wait For close the 5 min or 15 min candle the crossed 15714 buy and target price no Trail as per your rules 15624
**(Friday
Total Oi base call side 6,61,203 compare to put side 6,84,087 OI
So call atm to 500 points itm contracts 1,00,992 oi
Put atm to 500 points itm contracts 87,151 oi)**
put options purchased itm 16700 strike price 11,773 oi
every 50 points straddles are created
Option chain shows bullish
Note . this just prediction. market can happen anything

banknifty 1.global sentiment weekly positive
2. war was not end
(Chart shows a breakout )
(small Up Trend )
1.IF Tomorrow gap up 5 min or 15 min candle if break the resistance 33776 .. if we can see the price action for buying side and exit at the target price 34339
2.If Open in flat wait for the trend up side or downside Or it may have side ways then take the trade
3.if gap down cross wait For close the 5 min or 15 min candle the crossed 33389 buy and wait for the target
Weekly high and low should be mark
when 1st time hit resistance and halt for 1 day or 4 to 5 hour may change the trend .. Monday may gap up it may have chance to up side
Possibility my have on up side (up to previous week swing high)
Note . this just prediction. market can happen anything

Bearish Flag PatternBearish Flag Pattern Forming In NIFTY50
A bear flag is a technical pattern that provides an extension/continuation to an existing downward trend. The bear flag formation is underlined from an initial strong directional move down, followed by a consolidation channel in an upwards direction (see image below). The strong move down is known as the ‘flagpole’ whilst the consolidation is referred to as the ‘flag’ itself.
Bear flag formation summary
Preceding downtrend (flag pole)
Identify upward sloping consolidation (bear flag)
If the retracement becomes higher than 50%, it may not be a flag pattern. Ideally, we’ll see the retracement be less than 38%
Enter at top of the flag or on a breakout below the low of the lower channel
Look for prices to break lower with a length equal to the size of the flag pole

Banknifty1. global sentiment negative
2. war was not end
(Chart Shows Bear Flag )
(2 days Consolidation )
1.IF Tomorrow gap up 15 min candle should be green or if touches support .. if we can see the price action for buying side and buy the CE and exit at the target price
2.If Open in flat wait for the range break Up side or downside the take the trade
3.if gap down cross 32324.50 wait For close the 5 min or 15 min candle the crossed 32324.50 buy the Pe and wait for the target
But as per logic . every time reversal it will take consolidation 60% win rate for up check the previous data
dates 17 march 2022
dates 13 may 2022
Note . this just prediction. market can happen anything

Nifty 50Rules
1. global sentiment negative
2. war was not end
(Chart Shows Bear Flag)
(2 days Consolidation )
1.IF Tomorrow gap up 15 min candle should be green or if touches support .. if we can see the price action for buying side and buy the CE and exit at the target price
2.If Open in flat wait for the range break Up side or downside the take the trade
3.if gap down cross 15183.00 wait For close the 5 min or 15 min candle the crossed 15183 buy the Pe and wait for the target
But as per logic . every time reversal it will take consolidation 60% win rate for up check the previous data
dates 17 march 2022
dates 13 may 2022
Note . this just prediction. market can happen anything

YES BANK - 2 choices YES BANK - 2 choices
1. Now in a flag pattern
2. If it breaks and opens and closes above the 12.9 means short-term target will be 13.5
3. If it breaks the flag pattern down-ward means it has support at 12.5 and 12.20.
Note:
1. I’m not a SEBI Registered advisor, my views are personal and for educational purposes only.
2. Always check with your financial advisor and take the trade as per your risk/reward ratio.
3. Follow me for more patterns and like, and share so that we feel it is helpful to many and share more patterns...

TVS MOTORTVS MOTOR
Looking very bullish on charts multiple indication for UP SWING.
- H&S PATTERN.
- FLAG FORMATION.
- FORMING THREE WHITE SOLDIERS (IF TODAY'S CLOSE IS POSITIVE)
Trade formation.
If closes today above 763 can stock can move towards 790.
Enter Cautiously Real Break-out above 763.
Targets- 1- 776
2- 790
3 - Keep tailing stock moving in blue sky zone.
Stop loss - 740 Closing basis.
@forextidings
@tradingview_
@Bulls @Stock @BUY @Equities


MUTHOOTFIN | Consolidation near resistance + RSI - Potential 10%MUTHOOTFIN | Consolidation near resistance + RSI Breakout looks convincing for 10%
CMP : 1374
SL : 1330
Target : 1520
1:3+ risk reward setup

Bear Flag EUR/CHFBearish flag can be seen in 1hr time frame with bearish trend lets see how this pattern works

Flag-Pole Pattern On Nifty 15 min ChartWill Nifty Touch 16300 Today?
Formed FLAG-POLE Pattern on 15 Min Chart
