Pole and Flag in Paras DefenseParas Defense shows a nice pole and flag chart pattern. It has the highest possibility to move to 860 in the coming week
Flag

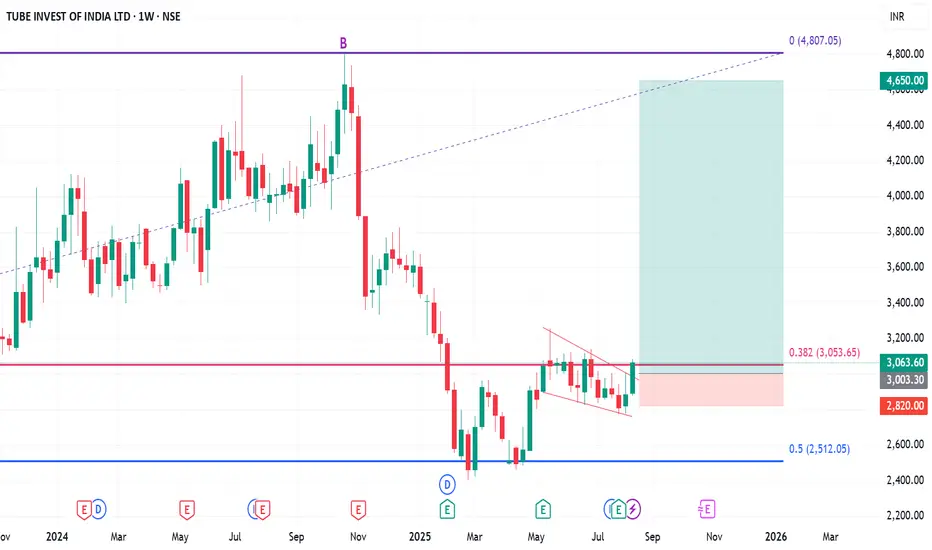
Positional or Long-term Opportunity in TIINDIAGo Long @ 3003.3 for Targets of 3330, 3830, and 4650 with SL 2820
Reasons to go Long :
1. On Weekly timeframe if we draw Fibonacci retracement from the all time swing low (A) to the all time swing high (B) then the stock took support from the 0.5 Fibonacci level.
2. In addition to this, the stock formed a Double Bottom Pattern (W) around 0.5 Fibonacci level.
3. After retracing the stock formed pole & flag pattern & gave breakout.
SBI (Weekly) - Breakout of sideways trendState Bank of India (SBI) has shown a significant bullish development this week, decisively breaking out of a key angular resistance trendline that has been in place since July 2024. This breakout, which follows a prolonged consolidation phase after its All-Time High in June 2024, was confirmed by a strong +4.71% price increase on the back of massive trading volume.
Confirmation from Multiple Indicators 👍
The positive outlook is strongly supported by several technical signals, suggesting a high degree of conviction in the recent move:
- Volume Surge: The breakout was accompanied by exceptionally high volume , indicating significant buying interest. The general trend of rising volume further validates the move.
- Momentum Indicators: Both the short-term Exponential Moving Averages (EMAs) and the Relative Strength Index (RSI) have entered a state of positive crossover, providing dual confirmation of building bullish momentum.
Outlook
Given the strength of the breakout and the confluence of bullish indicators, the path of least resistance appears to be upward. However, monitoring the price action in the upcoming week will be crucial to confirm that this breakout is sustained and not a false move.

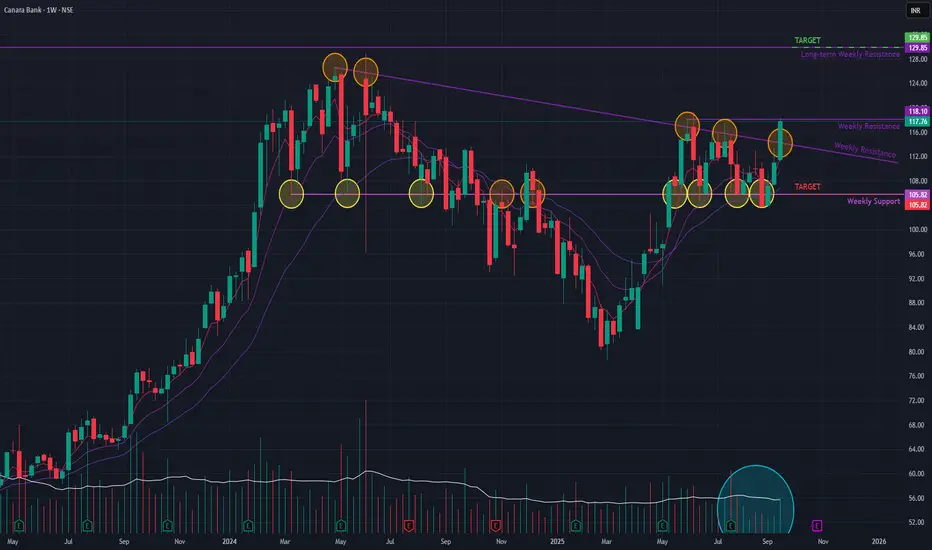
Canara Bank (Weekly) - Will it BreakOut of sideways trend??Canara Bank has demonstrated a significant bullish development this week, breaking out of a key angular resistance trendline . This move was validated by a strong increase in trading volume and a notable +6.13% price surge , signaling renewed buyer interest.
This breakout occurs after a period of sideways consolidation that has been in place since May 2025. This consolidation phase followed a corrective downtrend that lasted from June 2024 to March 2025, which itself came after a multi-year rally that began in October 2020.
Bullish Indicators Supporting the Move 👍
Several technical factors support a positive outlook:
- Volume Confirmation: The breakout was accompanied by a healthy surge in trading volume , indicating strong conviction behind the move.
- Momentum: Short-term Exponential Moving Averages (EMAs) have entered a positive crossover , a classic signal of building upward momentum.
The Immediate Hurdle Ahead 🚧
Despite the positive signs, the stock is currently trading just below a short-term resistance level . A decisive move above this immediate barrier is required to confirm the continuation of the uptrend.
Future Outlook and Key Levels
The price action in the upcoming week will be crucial. Two primary scenarios exist:
- Bullish Case 📈: If the stock successfully breaks and holds above the current short-term resistance, the path could be clear for a rally towards the next major resistance zone at ₹129 .
- Bearish Case 📉: If the upward momentum fails and the stock is rejected at this resistance, it could pull back towards the support level of ₹105 .
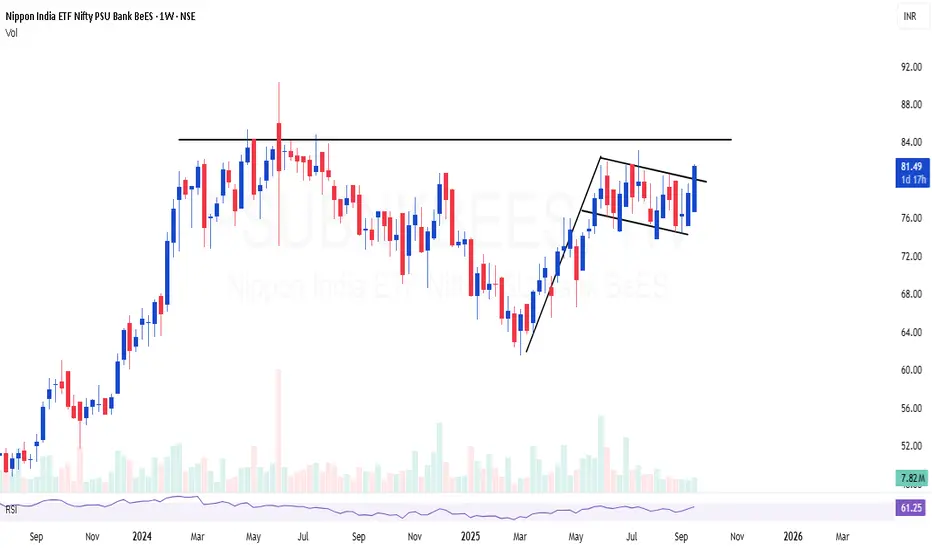
PSUBNKBEES | Excellent consolidation and flag formationPSUBNKBEES | Excellent consolidation and flag formation
Relatively safe bet on PSU Bank index, looks good for 30-40%
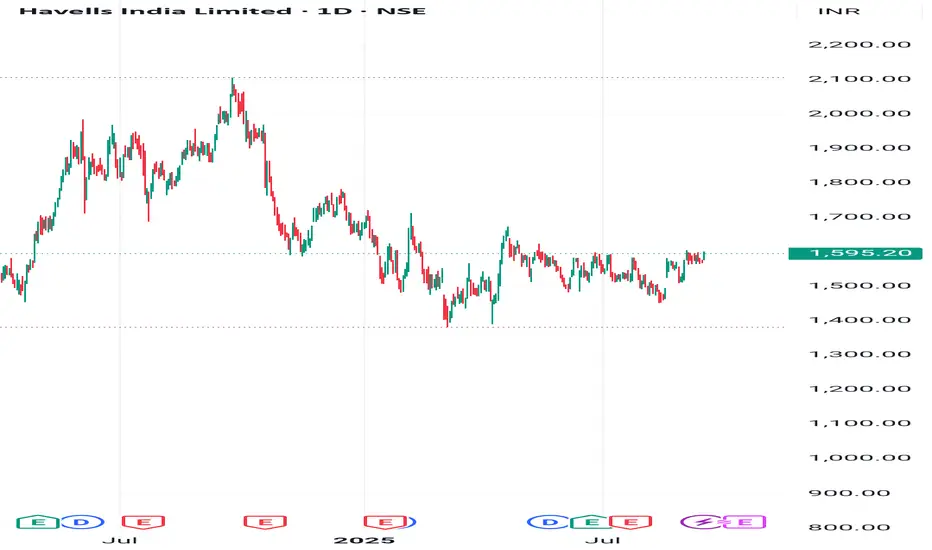
Havells flag n poleHavells flag n pole breakout
Add alerts acc...
Proper consolidation for 2 to 3 phases
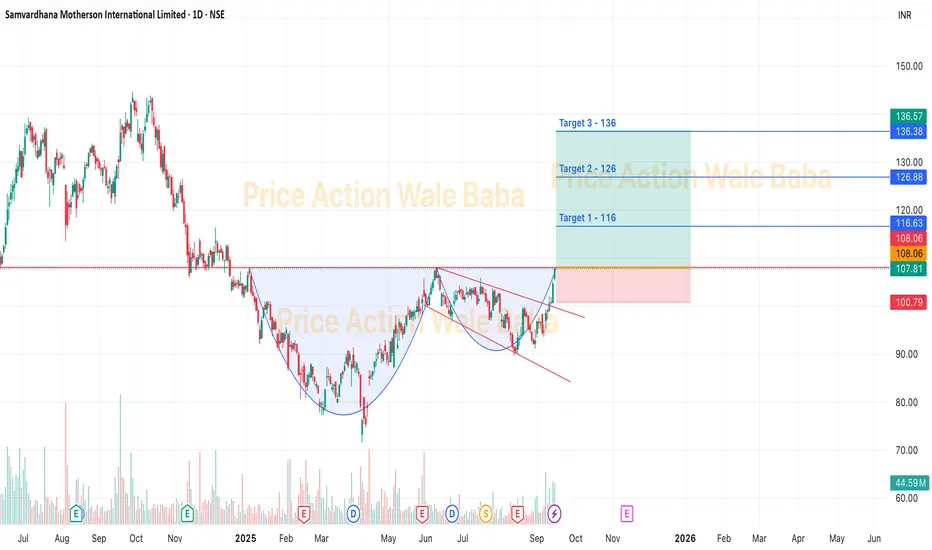
Motherson - Cup and Handle PatternMOTHERSON exhibits a well-defined and technically strong cup-and-handle pattern, confirming a bullish trend continuation signal.
The breakout was clean and heavily volume-supported, and the retest appears to be holding—a key zone to observe for buyers.
Monitor volume and price action closely: a bounce from current support may signal next leg up, while a failure may invalidate the pattern.
Ideal entry points would be above the breakout neckline—with stop-loss below the handle and targets based on cup depth.
This analysis is provided purely for educational and informational purposes, based on public technical references. It should not be construed as financial advice. Please consult a licensed financial advisor before making any trading or investment decisions.
Bullish Silver is looking very very hot
Its bullish Flag making if silver sustain this week above 42.25$, then it comes to 49 superfast maybe next in two days only
There's no recommendations from my side
Only for learning purpose

M&M FLAG PATTERN BREAKOUTM&M Breaking flag pattern on daily chart
with huge volume,good volume building last week
MACD crossover done
RSI bullish around 70
trading above 20 ema
target1 3600 target2 4000
retest level around 3300,sl 3050
DO YOUR OWN ANALYSIS BEFORE INVESTING

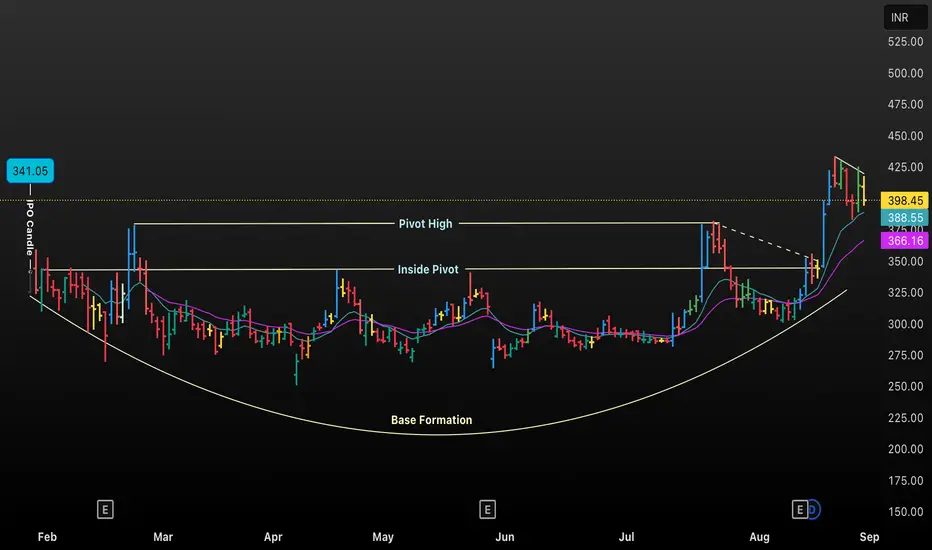
“DENTA’s Breakout Surge: Cup & Handle Pattern SignalsThe chart displays the daily price candles for DENTA, highlighting key technical levels: the Pivot High, Inside Pivot, and the rounded Base Formation that characterizes a classic Cup and Handle chart pattern. The IPO Candle signifies the initial price action post-listing. As prices gradually form a rounded bottom, accumulation occurs, followed by an upward breakout above the resistance (Pivot High), indicating bullish momentum. The colored moving averages provide additional context for trend strength and potential support levels.
30% buy on each level GAL - PSXI am going to purchase 30% of my portfolio in this stock. What about You?
Let me explain why I am buying so i can keep it as record. I will visit this setup again and review my analysis again.
In all of the fundamental analysis of around 200 PSX companies of PSX, this company comes at No. 1. Here is the reason.
Revenue CAGR of 49.39% second to Sazgar in Automobile Sector.
Net Income / Profit after Tax CAGR for 5 years is as huge as 72%, second to sazgar in Auto Sector.
Net Margin of 14% while sazgar has 15 %
The largest inventory makes the difference amongst automobile sector.
Negative Fundamental
ROICE 7% lowest amongst auto sector.
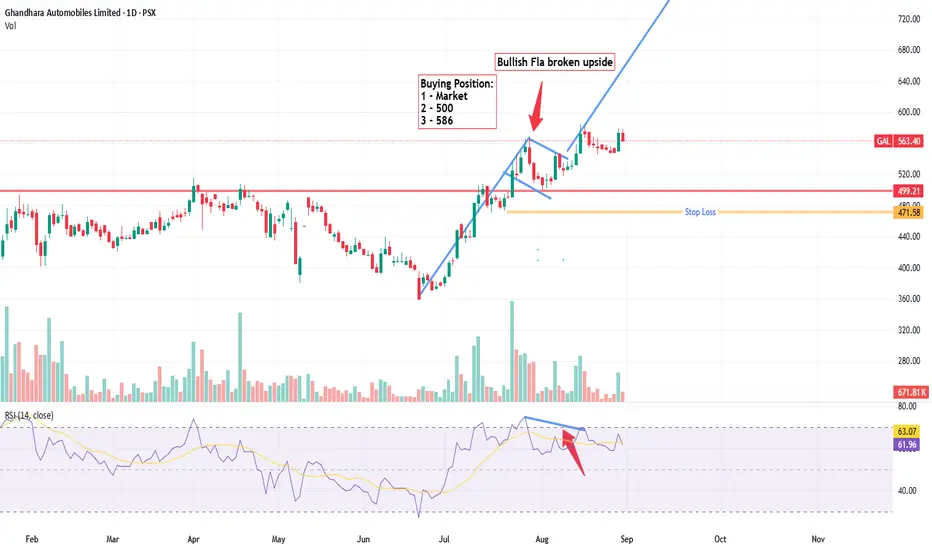
Technical chart:.
With good fundamentals and upcoming Rekodeq project, I am bullish on my technical bias. I will make interval buying as per the mentioned levels.
1st Buy
On Market Buy around @563 because it already broken the Bullish Flag. I will at 30% of my portfolio to my first Buy.
2nd Buy (30% more):
Because the price has a bearish divergence, I therefore will wait if the price is breaking the previous lower low at support level @492, if not then 2nd Buy triggers.
3rd Buy (40% More):
The price needs to goes up and breaks 586 area then more buying and then wait for the price to touch my target.
Negative aspect of Bullish Bias.
The Bearish divergence needs to be dilluted Well, its a question mark and I will wait for the breakout of the current top to disrespect this obvious divergence.
Gold about To Fly! ATH soon!Gold has been In Consolidation for past 5 Months.
4 occasions when it had settled near 3300.
It's about time for Gold to take Shorts For Cleaners?
This time around it's about to Settle near 3400.
3420 3440 will be Crucial for Bears to Defend if they wish to hold grip over this Consolidation.
Longs will get aggressive above 3440 3450 Targeting 3550 3750
😲
A prolonged consolidation could continue in case 3420 shows Profit Booking
For time Being 3375 3350 looks like providing support.
If it continues to Hold then it may build the Bull Case

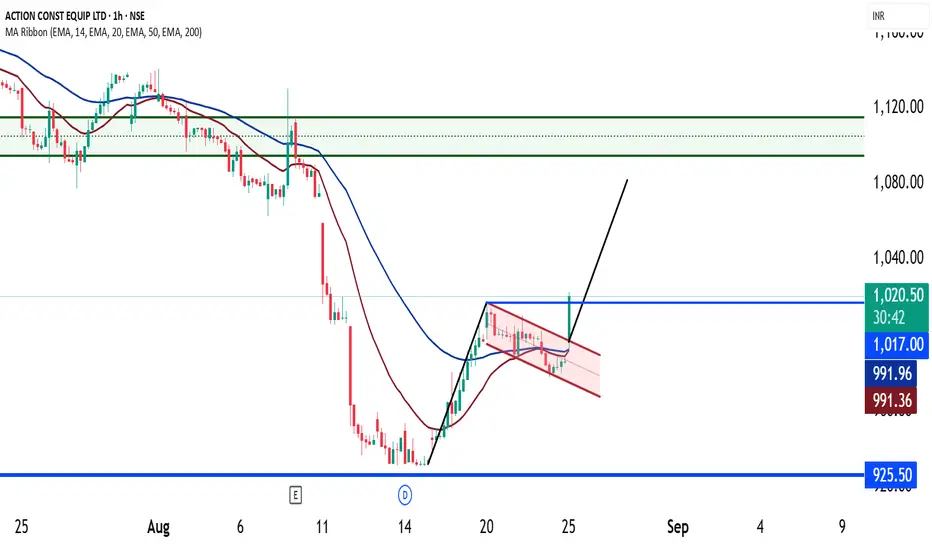
ACE - Breakout of Bullish FlagACE Construction has confirmed an upside breakout from a bullish flag pattern, indicating potential trend continuation. The RSI is rising towards 70, reflecting increasing bullish momentum. Additionally, EMAs are nearing a bullish crossover, reinforcing a short- to mid-term bullish outlook. Sustained volume and price action above key resistances will further validate the move.
UBERUBER has recently exhibited a classic Pole and Flag formation on its price chart—typically a bullish continuation pattern that indicates a strong upward trend after a brief consolidation. The "pole" reflects the steep and rapid price rise, while the "flag" represents the short-term consolidation or retracement that follows.
A breakout above the flag’s resistance has been observed, signaling renewed bullish momentum. This breakout suggests that the stock could be entering the next leg of its upward trajectory.
A retracement toward the breakout level could offer a compelling buying opportunity, especially for medium to long-term investors. A stop-loss around $69 is advisable to manage downside risk, as this level marks a key support zone.
If the breakout sustains, the stock has the potential for significant upside over the next 2–3 years, supported by both technical strength and UBER's improving fundamentals and business growth.
Summary :
Pattern Identified: Pole and Flag
Breakout Status: Confirmed
Buy Zone: On retracement near breakout level
Stop Loss: $69
Outlook: Bullish; strong follow-through expected over the next 2–3 years

LongPole and flag pattern
Long term growth
Buy on dip situation
Bad market conditions may take down till 400 any break out will take it to 900+
For education purpose only
Time 6-12 month depending on market conditions

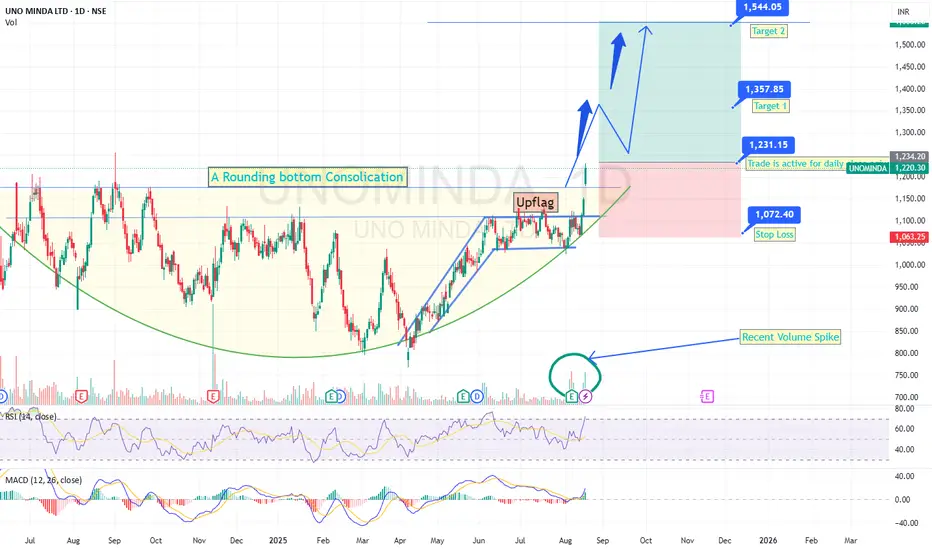
An Upflag Inside an Round bottom consolidation with Gap up B/OUno Minda was consolidating between the 1180-800 price range for past 1.2 years,under a daily time frame.
This is a very good price consolidation with respect to time.
With the recent expectation that the Goverment might slash the GST rate slabs for Automobile Industry, this auto parts maker stock has given a breakout of the rounding bottom consolidation, with an inside upflag break out confirmation too.
Though the breakout has happened with gap up, it is a better candidate for going long, considering the recent surge in volumes with RSI and MACD providing double confirmation.
3 Criteria to consider:
1. Rounding bottrom Breakout
2. Inside upflag breakout
3. News that GST rate migh be slashed for auto industry.
Hence it is better to consider under below levels:
1. Jump in - Daily close >1260
2. Stop Loss - Daily close <1060
3. Target 1 - 1357-1360 range
4. Target 2 - 1548-1550 range.(Takes time, with retest to rounding base and pull back).
The ideas shared here are purely for educational purpose only.
Nifty weekly review Aug 18 - Aug 22The price was consolidating in a narrow range over the past two days. The range of 24600 to 24700 has become a zone of resistance. A decisive move is needed to form a trend. Price has formed a bull flag pattern, and below 24500, this pattern becomes invalid.
Buy above 24720 with the stop loss of 24670 for the targets 24760, 24820, 24860, 24900, 24960, 25000, and 25080.
Sell below 24480 with the stop loss of 24530 for the targets 24440, 24400, 24340, 24280, 24200, and 24120.
Always do your analysis before taking any trade.

Gold new ATHGold has beautiful flag & poll pattern. Rushing toward new all time high soon. Till December i think gold will rock. Any dip will be buying opportunity only. I can see the 4000 levels soon.

Long Bosch - Target 52000+This is Long term view
Bosch has broken out of Flag and Pole pattern and ready to achieve new Highs.
Target 1 - 39900
Target 2 - 42000
Target 3 - 52000+
Stop Loss - 28800

Against the Herd: My CAMS Big Short Moment at ₹4,000?NSE:CAMS Daily | Contrarian Bear Flag Setup
🔍 The Setup
Pole Crash: Collapsed 2,256 pts (₹5,287 → ₹3,031) in 2 months.
Flag Trap: Now stuck in ₹4,000–4,500 range (bulls in denial 😴).
Trigger: Daily close < ₹4,000 = breakdown confirmed!
Void If: Price climbs > ₹4,500 (run away 🏃♂️).
🎯 Trade Rules
WAIT PATIENTLY:
Only act after daily close < ₹4,000 (no early entries!).
SELL THE BOUNCES:
Short every pullback to ₹3,900–4,000 (zombie rallies).
PROFIT TARGETS:
Quick exit at ₹3,500 (bank 12%).
Hold core position for ₹3,031 (pole low).
STOP-LOSS: ₹4,050 (1.2% risk).
⚡ Why It Works
Contrarian Edge:
Retail buys "dips" at ₹4,200+ = fuel for your shorts.
Stats:
70% win rate if volume spikes on breakdown.
83% pullbacks fail at ₹4,000 (NSE backtests).
Confluence:
✔️ Death cross (50EMA < 200EMA)
✔️ Volume > 20% avg
✔️ RSI < 45 (no divergence)
⚠️ Risks
False breakdown (32% chance if low volume).
Sector reversal (watch Nifty IT index!).
‘The Big Short’ sequel? Only if bears win! 🎬
🐻 "Bear's Honor Code"
"This ain’t honey-coated advice. I’m a grumpy bear with a keyboard, not your financial Yogi.
Trade at your own risk – if you lose salmon, don’t hibernate in my cave.
Backtested? Yes. Guaranteed? Only in a bear’s dreams. 🍯💤"

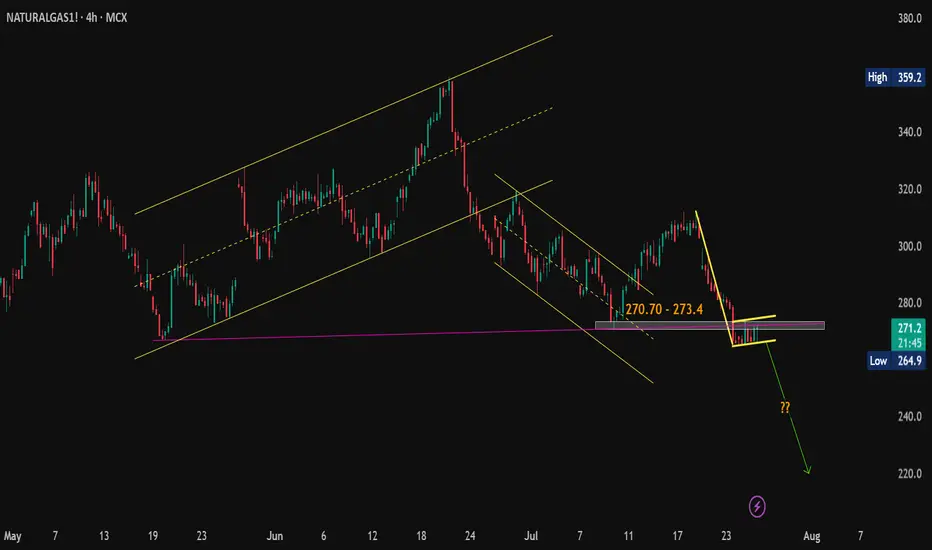
Natural Gas Technical Breakdown Ahead? Eyes on the 264.90 Mark#Commodity
#NaturalGas View:
CMP: 271.70
🔹 Resistance Levels:
• 270.70 – 273.40
• 275.00
• 284.00
🔹 Support Level:
• 264.90
Technical View:
Natural Gas seems to be forming a bearish flag pattern on the hourly & 4 hours chart. The price is currently facing resistance at the pink trendline breakdown level. While it's still early for confirmation, a decisive hourly close below 264.90 may validate the pattern and open the door for further downside. If the pattern plays out, a possible target zone around 220 could be in sight.
📌 Note: This is a technical analysis view shared for educational purposes only and not a recommendation to buy/sell. Always consult your financial advisor before making any trading decisions.
#Commodity | #NaturalGas | #MCX | #PriceAction
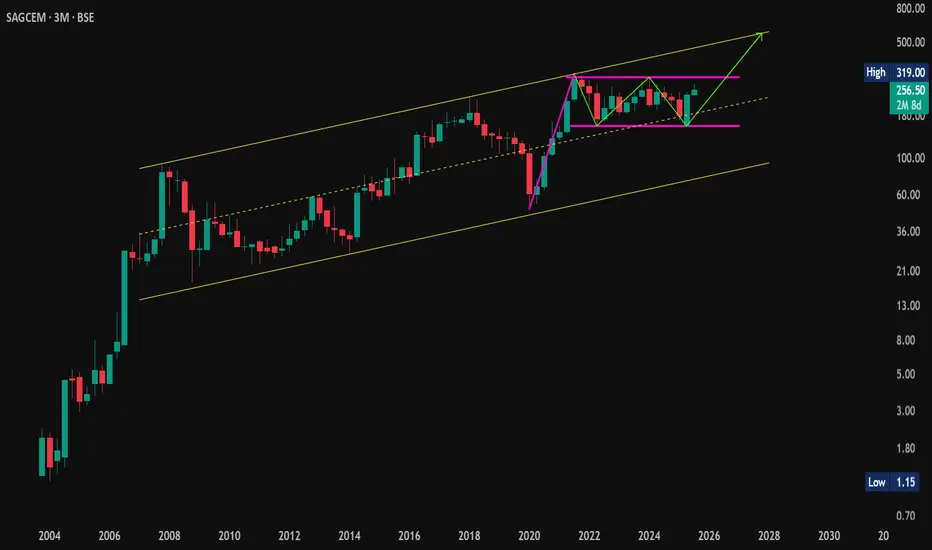
Flag + W Pattern Combo on Monthly! | #SagCem On Radar🔍 #OnRadar
#SagCem (Sagar Cements Ltd.)
🚩 Flag + W Pattern Combo on Monthly!
📈 Chart Timeframe: Monthly & Quarterly (Educational Observation Only)
📊 Technical Structure Overview:
A rare confluence of bullish patterns spotted:
🚩 #FlagPattern — classic continuation structure
🔻🔻 #WPattern (Double Bottom) — bullish reversal signal
🔼 Both developing inside a long-term #AscendingChannel
🎯 Potential Pattern Projections:
Flag Target: 560+
W Pattern Target: 450+
🛡 Support Zones:
255
234–209 (Demand cluster)
❌ Pattern Invalidation:
Below 155 on Monthly Closing Basis (MCB)
🧠 Educational Note:
When multiple bullish structures align on higher timeframes, they often lead to explosive moves—if validated by breakout and volume.
⚠️ Disclaimer:
This is not a buy/sell recommendation. Shared strictly for educational and technical study purposes. Always consult your financial advisor before acting on any market insights.
#PriceAction | #TechnicalAnalysis | #ChartPatterns | #FlagPattern | #Wpattern | #AscendingChannel | #InsideBar | #LongTerm
North East is booming and transport of cement is not easyThese are locally made ingredients
They cant be moved from far off places
Transportation increases cost
I feel that this stock can be in a big bull run into this decade
