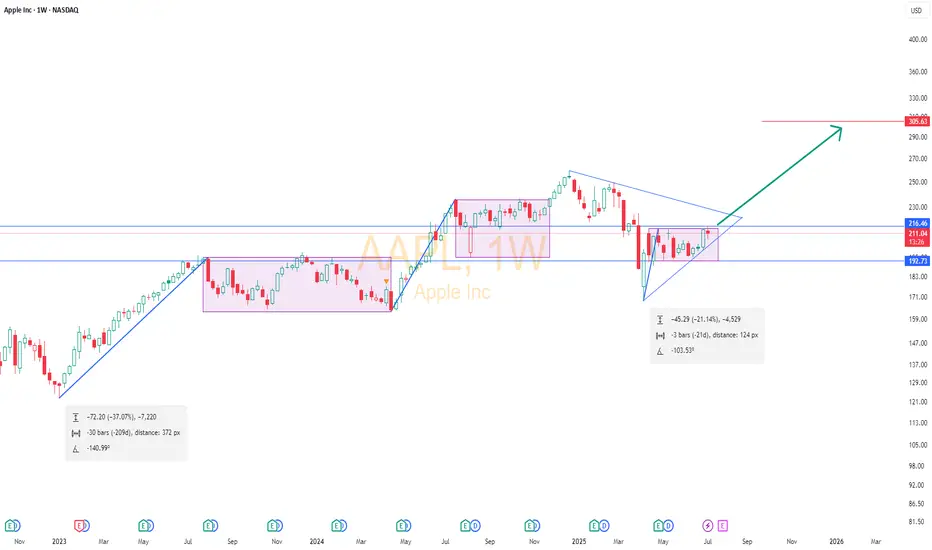
Aapl📈 NASDAQ:AAPL Weekly Chart Update
Apple is forming its third bullish flag since Jan 2023.
🔹 Flags:
1️⃣ Jan 2023 – Feb 2024
2️⃣ May 2024 – Mar 2025
3️⃣ Ongoing since Apr 2025
🔺 A triangle formation from Dec 2024 to Apr 2025 low is also converging.
💥 Breakout level: Weekly close above $216
📉 Stop Loss: $193 (weekly close)
🎯 Target: $305 in coming weeks
Technicals point to a strong bullish setup. Keep it on watch!
#AAPL #Apple #StockMarket #ChartAnalysis #TradingView
Flag
JP Power - Are bad times over for this penny stock?Stock can fly if it gives a monthly closure above 25
Sharing only for educational purposes. Keep in watchlist to see who it unfolds.
Penny stocks should be strictly avoided for investment purposes.
Highly risky.

Indian Oil Corporation Limited (IOC)Indian Oil Corporation Limited (IOC), is India’s largest government-owned oil and gas company, operating under the Ministry of Petroleum and Natural Gas.
IOC continued to fall from October last year to March,2025.
And for within 2 months 50% return (145 level), it was this is amazing performance.Currently it's made a bullish flag pattern.
Friends! as per technical chart pattern I want to see in the coming days IOC near 175-180 level.

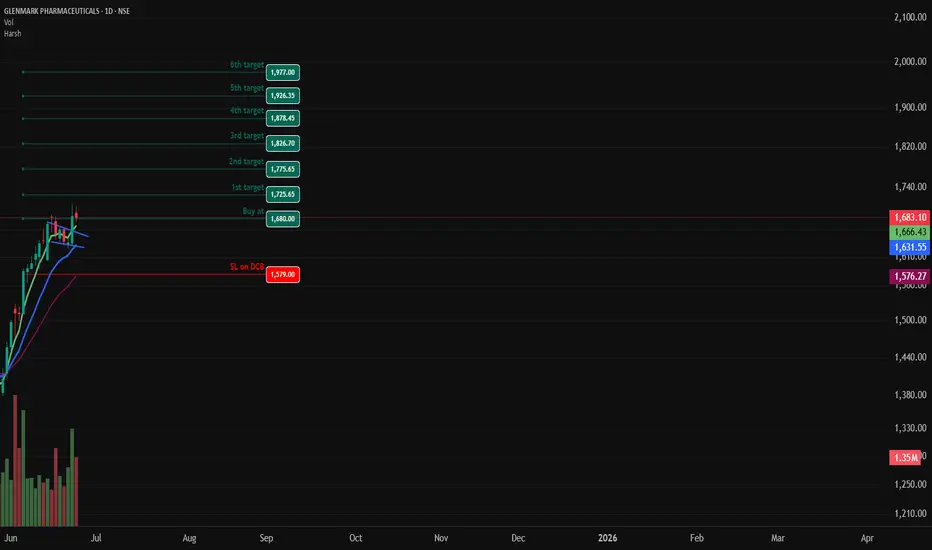
GLENMMAR PHARMACUITCAL- Bullish Flag & Pole Breakout (Daily T/F)Trade Setup
📌 Stock: GLENMARK PHARMACUITICALS ( NSE:GLENMARK )
📌 Trend: Strong Bullish Momentum
📌 Risk-Reward Ratio: 1:3 (Favorable)
🎯 Entry Zone: ₹1680.00 (Breakout Confirmation)
🛑 Stop Loss: ₹1579.00 (Daily Closing Basis) (-6 % Risk)
🎯 Target Levels:
₹1725.65
₹1775.65
₹1826.70
₹1878.45
₹1926.35
₹1977.00 (Final Target)
Technical Rationale
✅ Bullish Flag & Pole Breakout - Classic bullish pattern confirming uptrend continuation
✅ Strong Momentum - Daily RSI > 60, Weekly RSI >60 Monthly rsi >60
✅ Volume Confirmation - Breakout volume 1.93M vs previous day's 1.16M
✅ Multi-Timeframe Alignment - Daily and weekly charts showing strength
Key Observations
• The breakout comes with significantly higher volume, validating strength
• Well-defined pattern with clear price & volume breakout
• Conservative stop loss at recent swing low
Trade Management Strategy
• Consider partial profit booking at each target level
• Move stop loss to breakeven after Target 1 is achieved
• Trail stop loss to protect profits as price progresses
Disclaimer ⚠️
This analysis is strictly for educational purposes and should not be construed as financial advice. Trading in equities involves substantial risk of capital loss. Past performance is not indicative of future results. Always conduct your own research, consider your risk appetite, and consult a financial advisor before making any investment decisions. The author assumes no responsibility for any trading outcomes based on this information.
What do you think? Are you watching NSE:GLENMARK for this breakout opportunity? Share your views in the comments!
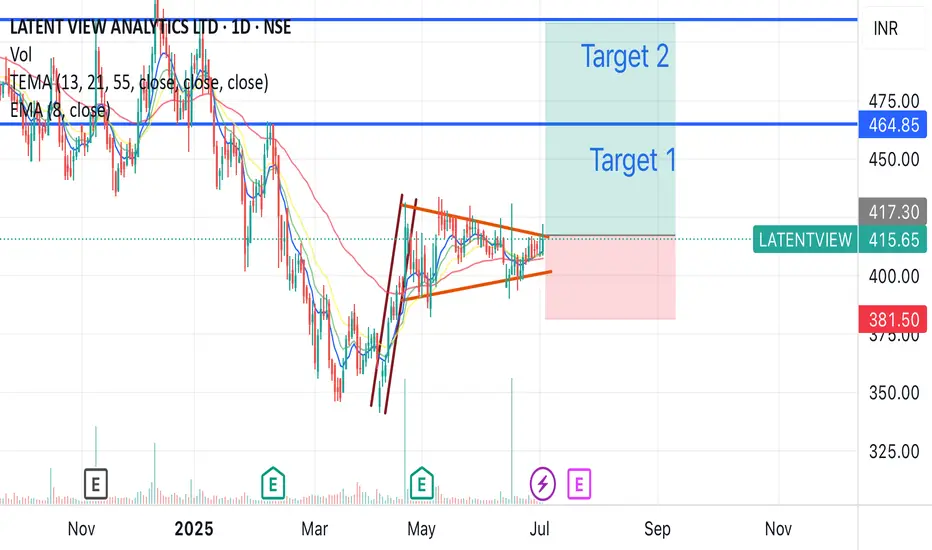
Latent view possible breakout after long consolidationLatent view might give a possible breakout as it is showing a long consolidation with flag and pole pattern, high volume was also seen a week back.
Also 55 Ema is below 8, 13, and 21 ema, which shows potential up movement
Buy around 415-420
Target - 508
Duration - 2-3 months
Punjab National Bank Flag Breakout Setup📈 Punjab National Bank (PNB) – Flag Breakout Setup
Observed a classic flag pattern on the daily chart after a strong pole move in 2023–24.
✅ Breakout above the channel confirmed with price action near 113.
✅ Entry plan: Watch for daily close >113 with volume.
✅ Stop-loss idea: Below 106.
✅ Target 1: 140 (first swing resistance).
✅ Measured move projection targets up to ~198 possible based on full flag pole.
Volume confirmation and broader market context will guide the actual trade trigger.

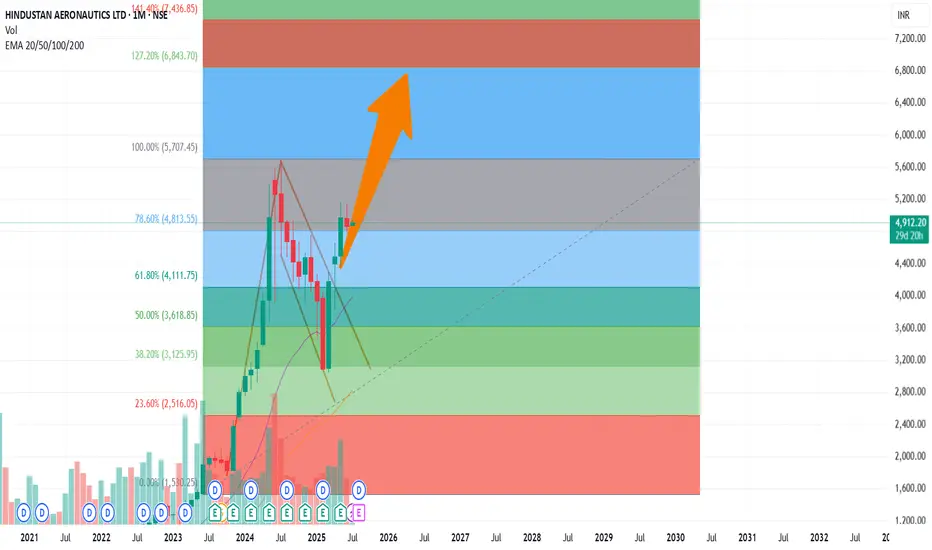
HAL Long - 6400 - Breakout doneThe HAL has broken out of Flag and Pole Pattern.
Breakout done and already on bullish trend.
Target 6400
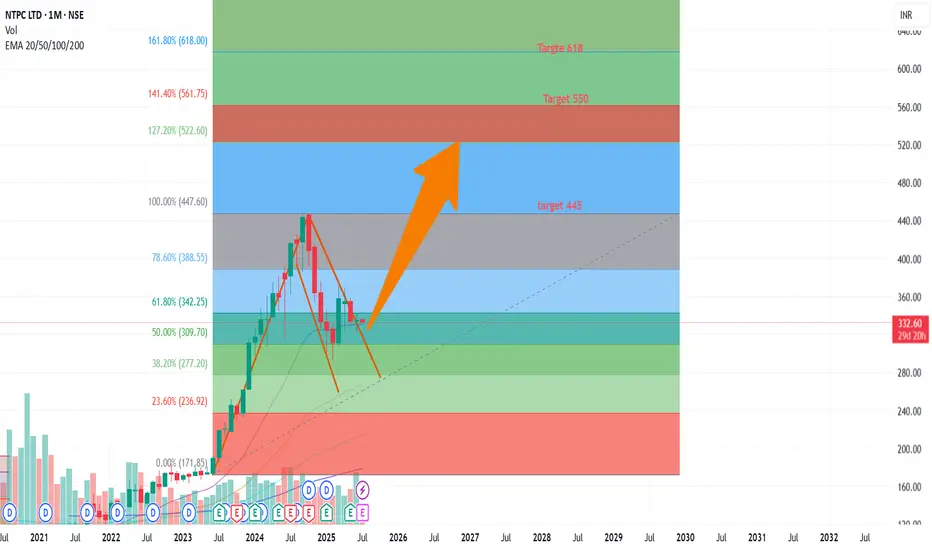
NTPC Long - target 600 - Wait for BreakoutAlmost all major shares are showing flag and Pole pattern on Long term Monthly charts
Wait for breakout. Long term view
Target 1 - 445
Target 2 - 550
Target 3 - 618
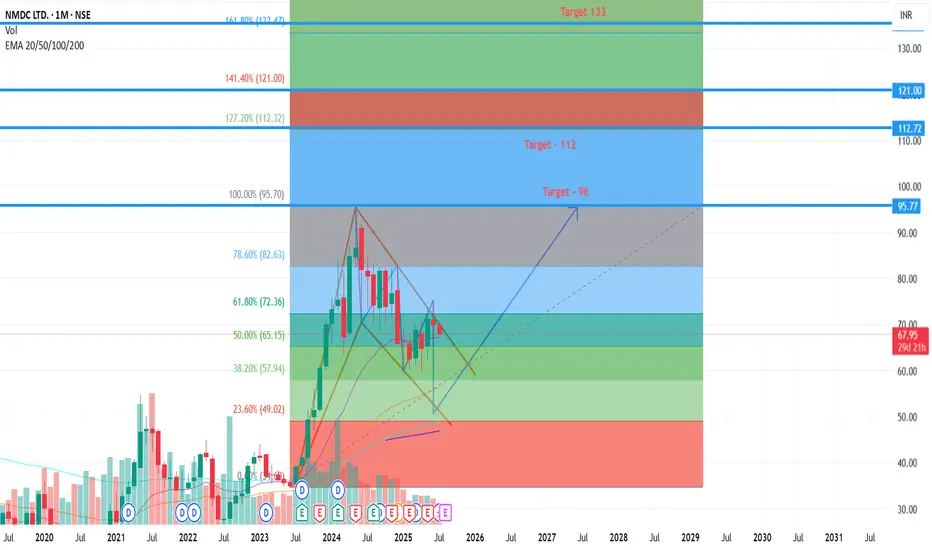
Accumulate NMDC Target - 133 Wait for BreakoutNMDC is currently trading in a channel and flag pattern.
Wait for breakout.
Target 1 - 96
Target 2 - 112
Target 3 - 121
Target 4- 133
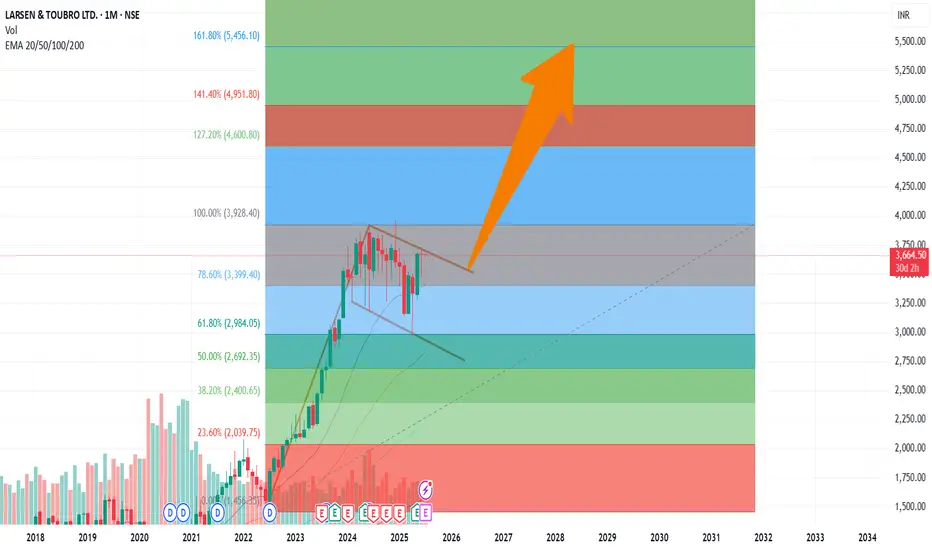
Larsen Accumulate Target 5400 - Wait for BreakoutLarsen is currently in long term channel and the breakout from this will give a rally.
Wait for Breakout from channel.
Target 1 - 3900
Target 2 - 4200
Target 3 - 4800
Target 4 - 5400
No stop loss
This is long term view
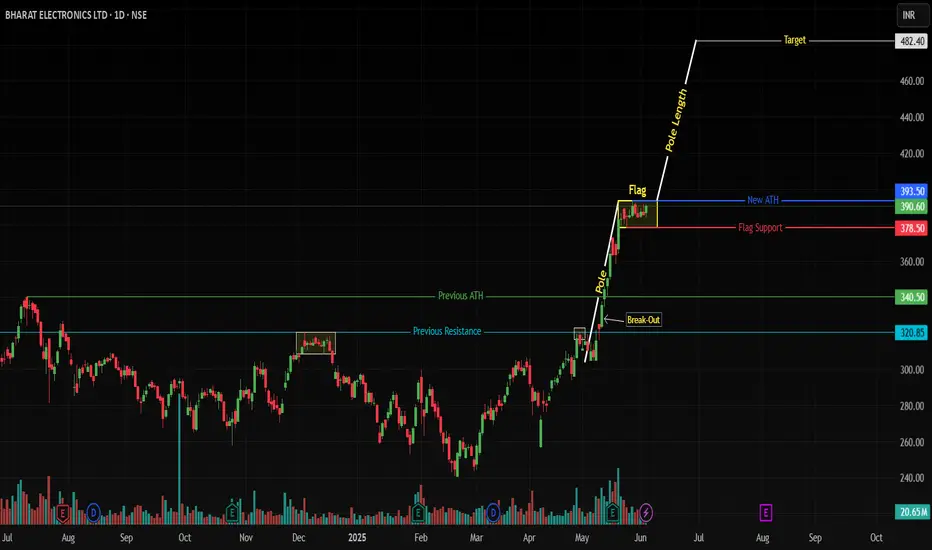
How to Trade ATH Stocks: Harness Explosive Trends with ADX !(BEL Case Study)
NSE:BEL (Daily) - Bull Flag at All-Time Highs
📈 Key Observations
ATH Breakout Confirmed:
Price smashed through ₹340.50 previos ATH, hitting a historic high of ₹393.50.
Consolidation in a tight bull flag (₹378.50–393.50) after a 28.97% surge – classic bullish continuation setup.
ADX: Your Trend Compass 🧭
ADX at 43.95 signals a powerful, directional trend (Readings >25 = strong trend; >40 = explosive momentum).
Ignore oscillator noise: Trends trump RSI/MACD in parabolic moves.
Pattern > Oscillators:
Bull Flag Priority: The pattern’s integrity (lower volume consolidation) outweighs short-term RSI(79)/MACD wobbles.
🚀 Trade Strategy: Trend-First Framework
✅ Entry & Targets
Trigger: Daily close above ₹393.50 (flag resistance).
Add: Retest of ₹393.50 as support.
Targets:
Short-term: ₹420 (5% above ATH)
Measured Move: ₹482 (ATH + pole height: 393.50 + 88.20)
⚔️ Stop-Loss
Conservative: ₹378.50 (flag low breach).
Aggressive: ₹385 (tight stop, honors consolidation structure).
📊 Position Sizing
Risk ≤1% capital per trade.
Reward/Risk Ratio: 4:1 (₹482 target vs. ₹378.50 stop).
💡 Why ADX Trumps RSI/MACD at ATHs
RSI/MACD are lagging in strong trends:
RSI overbought ≠ reversal – it’s fuel for momentum stocks.
MACD crosses often "whipsaw" in high-ADX environments (BEL’s ADX >40 invalidates bearish MACD signals).
ADX is proactive:
"Trends persist until ADX rolls below 30" – Focus on price, not oscillator fears.
🌐 Sector & Fundamental Tailwinds
Defense Sector Strength: India’s capex boost; BEL’s order book increasing.
Institutional Conviction: FIIs increasing stake.
🛡️ Risk Management Checklist
✅ Trade only on confirmed close above ATH.
✅ Use ADX >40 as a momentum green light.
✅ Trail stops at 20-DMA (₹365) once +10% profit.
Chart Markup:
Blue line: Bull flag Resistance at ₹393.50.
Red Line: Bull Flag Support ₹378.50
ADX(14) subchart with 40+ threshold highlighted.
💎 Final Thought: ATH breakouts are trend accelerators, not tops. BEL’s bull flag + ADX >40 frames a high-probability continuation play. Stick with the trend until ADX says otherwise.
Boost this idea if you’re tracking BEL’s breakout!
Follow for high-probability ATH trade setups.
⚠️ Disclaimer
"This is NOT financial advice. Trade at your own risk. Past performance ≠ future results. Always conduct independent research and consult a SEBI-registered advisor. The author holds no position in BEL at time of publication."
LICHSGFIN | Small flag setup (Small but convincing)LICHSGFIN | Small flag setup (Small but convincing)
Looks good for 25- 30% with good risk reward
Keep SL below 530

LONG TATASTEEL Target 247 This is Long Term View as per Monthly charts and need patience to see the target.
Tata Steel has broken out from Flag pattern and ready to make new high
Target 1 - 170
Target 2 - 212
Target 3 - 247

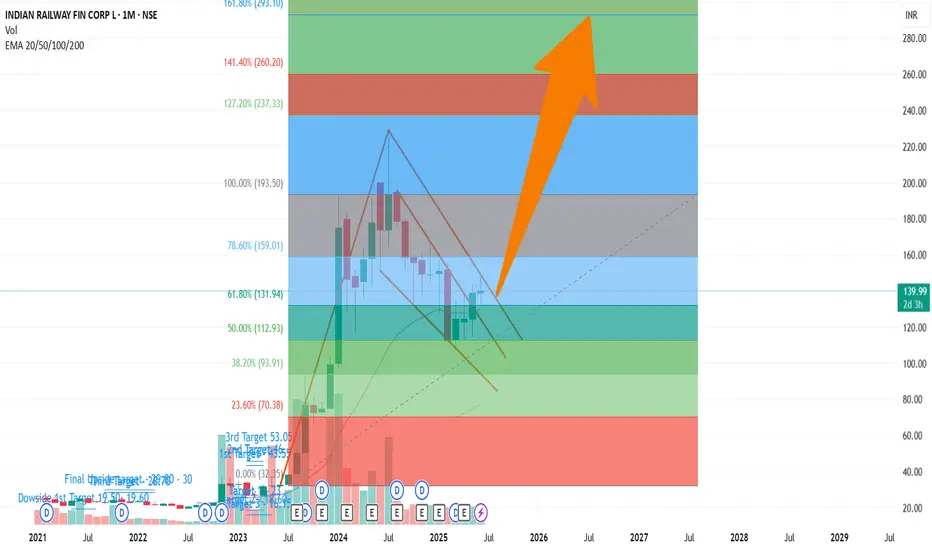
Accumulate IRFC target 293 - Awaiting BreakoutIRFC on Monthly chart is awaiting breakout on charts.
Once the breakout happens from flag pattern then following are the targets
Target 1 - 193
Target 2 - 228
Target 3 - 293
Stop Loss - Bottom of flag channel
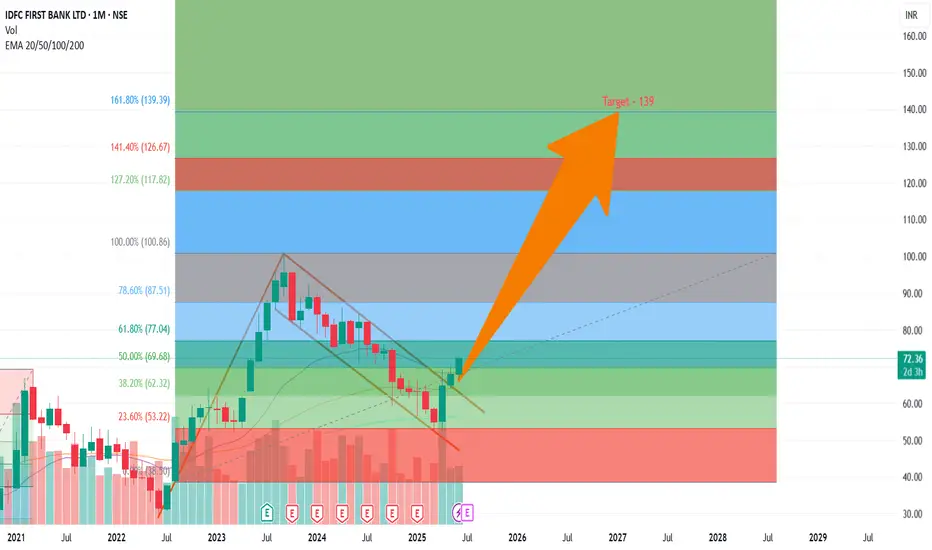
LONG IDFC FIRST BANK - Target - 139On Monthly chart IDFC first Bank has broken out from flag and Pole pattern.
Indicating a strong bullish Momentum.
Stop Loss is 61
Target 1 - 100
Target 2 - 110
Target 3 - 139
Abbott india target 34000On weekly charts Abbott india is forming flag and pole pattern. Looks strong on technical charts till now.
Stop loss will be lower end of following flag channel on weekly closing basis.
Once the pattern breakout occurs. Following are the targets -
Target 1 - 31500
Target 2 - 32600
Target 3 - 34000
Don't fall in FOMO mode and wait.

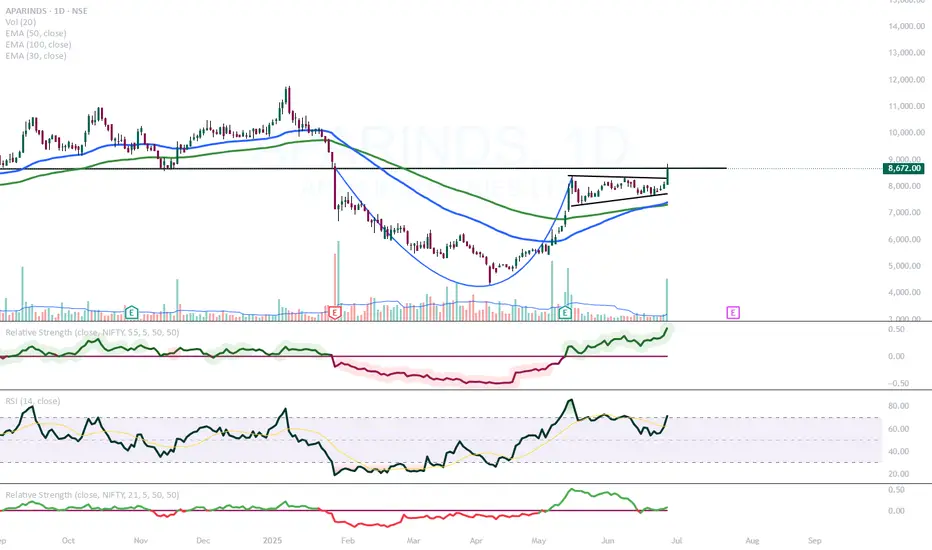
APAR IDUSTRIES on the RadarNSE:APARINDS
Cup and Handle Pattern/ Flag pattern
- Near Important resistance zone
- Weekly RS turning green
- Daily RS is positive
- RSI is well above 60
- Now need some more volume in coming couple of sessions to confirm the breakout.
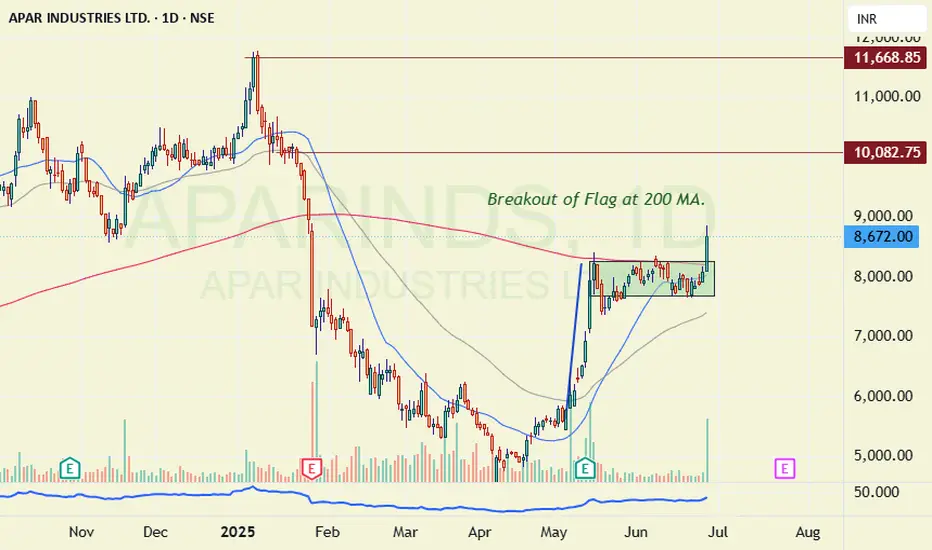
Apar Flag breakoutAs can be seen in Apar industries.
The stock was taking resistance of 200 Moving avg.
It formed a consolidation pattern under 200MA. Which is also good example of flag formation.
First resistance at 10k and next is at ATH of 11600. SL of 8000 Levels can be considered.
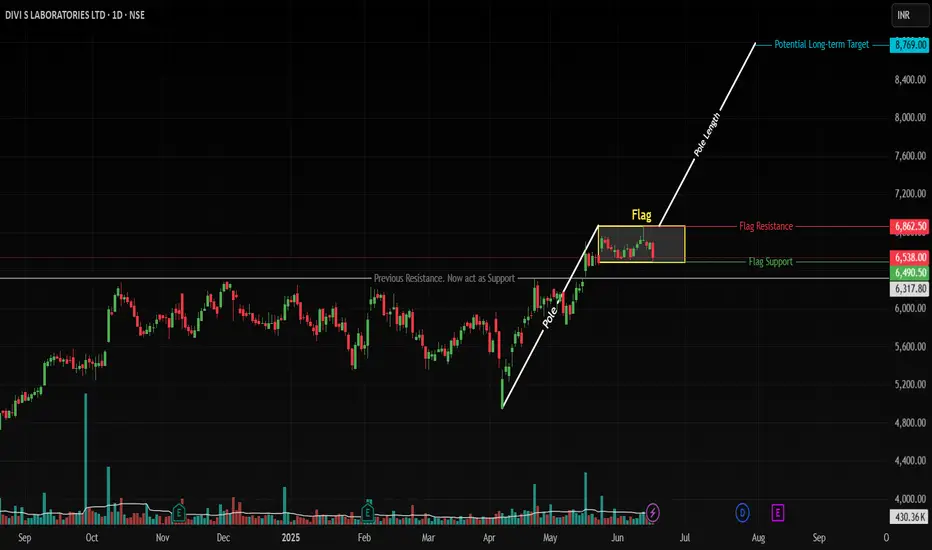
DIVISLAB: Flag & Pole Breakout Setup Targets New ATHsNSE: DIVISLAB | Pharmaceuticals | Large Cap | Updated: June 17, 2025
📊 Technical Structure
Pole Formation: Rally from 4,955 → 6,862 (1,907 points) on high volume
Flag Consolidation: Tight range between 6,490 (support) and 6,800 (resistance)
Key Breakout Trigger: Daily close above 6,862 (ATH)
Pattern Target: 8,769 (6,862 + 1,907 pole length)
Critical Support: 6,300 (confirmed swing low)
🎯 Price Targets & Roadmap
Immediate Target: 7,200 (2024 swing high)
Strong Resistance Zone: 7,600-7,750 (analysts ceiling)
Pattern Target: 8,769 (100% pole extension)
Confirmation Required for 8,769:
• Breakout volume >650K (20% above 20D avg)
• Pharma sector PE >42 (currently 39.2)
⚡ Trade Strategy
Scenario 1: ATH Breakout (Preferred)
Entry: Daily close above 6,862 (6,880-6,900 zone)
Targets:
• 7,200 (book 30% profits)
• 7,600 (book 50% profits)
• 8,769 (full exit)
Stop Loss: 6,700
Scenario 2: Flag Breakdown
Entry: 6,300-6,160 (50-DMA confluence)
Target: 6,800 flag retest → 7,200
Stop Loss: 6,050
Risk Management Essentials: Max 2% capital per trade
⚖️ Fundamental Drivers
Strengths:
• 15.4% ROE (vs sector 12.1%)
• 17% EPS growth (FY26E)
• FII holdings ↑2.1% YoY to 18.01%
Risks:
• High PE 79.2 (sector 39.2)
• Overbought risk above 7,600
⚠️ Critical Risks
Valuation Risk: Profit-booking likely near 7,600
Sector Risk: Pharma index seasonality (+4.91% avg June)
📉 Real-Time Levels
Current Price: ₹6,538 (-2.24% today)
Support: 6,490 (flag base) → 6,300 (swing flip)
Resistance: 6,800 (flag top) → 6,862 (ATH)
Volume Alert: Breakout requires >650K shares
✅ Conclusion
DIVISLAB offers a high-reward setup with defined risk parameters. The flag breakout above 6862 is the preferred play, backed by sector leadership and earnings growth. Always hedge with stops—overvaluation remains a concern.
📜 Disclaimer
This analysis represents my personal market view and not investment advice. Trading carries significant risk of capital loss. Past performance doesn't guarantee future results. Always:
Conduct your own due diligence
Consider your risk tolerance
Consult a SEBI-certified advisor
Verify real-time data before acting
Never risk more than you can afford to lose.
ROTOROTO is showing good strength and currently trading above previous resistance line. It is in to consolidation phase. It seems like accumulation has been observed in recent sessions. Now as long as it is closing above 279 then ROTO is very strong and available at very good risk-reward. One may expect 12% to 21% in next rally once it comes from consolidation phase.

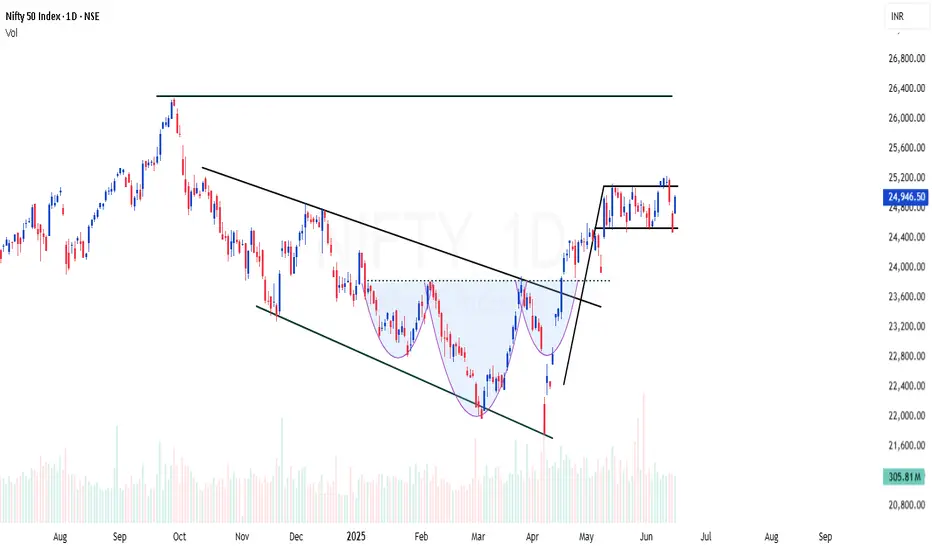
NIFTY | Back to back bullish patternsNIFTY showing back to back bullish signs
Channel breakout - Done
Inverted Head & Shoulder breakout (INHS) - Done
Now forming flag setup
NIFTY shows strength to move another 15% this year
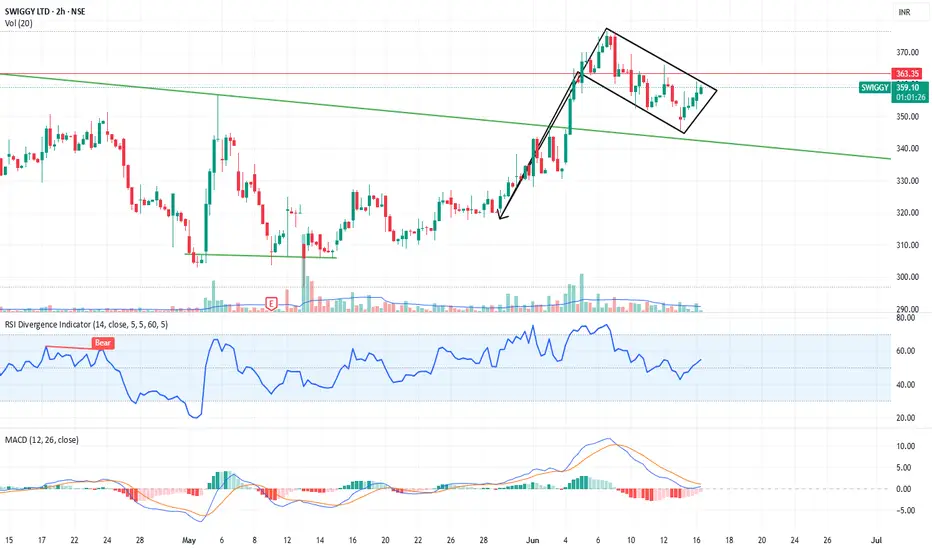
SWIGGY LTD forming a textbook bullish flag on the 2h chartChart Analysis (Study Purpose Only):
Pattern Observed: After a sharp uptrend, the stock has formed a falling channel (bullish flag) — which typically signals a continuation of the trend.
Support/Resistance:
The price is consolidating above a long-term trendline resistance, which is now acting as support.
Resistance zone is near ₹365–₹367, and support is around the ₹340–₹345 range.
Indicators:
RSI is currently at ~60, suggesting mild bullish momentum without being overbought.
MACD is in a bearish crossover but appears to be flattening, possibly preparing for a bullish crossover.
Volume: Declining volume during the pullback suggests weak selling pressure, often a bullish sign in continuation patterns.
🟢 A breakout above the upper channel with volume could confirm a bullish continuation.
NAZARA | Flag and Pole | Breakout | Daily---
## 🚩 **NAZARA TECH – Bullish Flag and Pole Breakout**
### 📍 **Pattern: Flag and Pole**
* **Pole**: A strong vertical rally of **₹333.90** (\~33.7%)
* **Flag**: A downward-sloping consolidation (tight range), indicating **temporary pause**
* ✅ **Breakout from flag** with **volume spike** confirms continuation
---
### 📈 **Price Action & Levels**
* **Pole Base**: \~₹990
* **Pole Height**: ₹333.90
* **Breakout Point**: \~₹1308
* **Target Projection**: ₹1350+ ₹333.90 = **₹1638** 🎯
---
### 📊 **Technical Strength**
* ✅ **All EMAs** (8, 21, 55, 144) are bullishly aligned
* ✅ **Volume** surged on breakout, validating the move
* ✅ **RSI** broke out of downward trendline, resuming upside momentum
---
### 🔍 **Key Levels**
* **Support**: ₹1240 (flag base), ₹1089 (pole base & rectangle top)
* **Resistance**: ₹1342 (current high), then **₹1590+** (target zone)
* **Stop Loss (Swing)**: Below ₹1305 or ₹1240 zone
---
### 🧠 **Bias**: **Bullish Continuation**
Ideal for swing trades; entry on breakout retest or momentum continuation.
