EURUSD – Wave 5 Long SetupIdea: EURUSD has completed a clean Elliott Wave (1-2-3-4) structure on the 1H chart and is now setting up for the final Wave (5) push to the upside. Price has broken above short-term resistance and is aiming for the next liquidity zone.
🔹 Entry: 1.16609
🔹 Target: 1.17015 🎯
🔹 Stop Loss: 1.16271 ❌
✅ Reasons for Long Bias:
Clear Elliott Wave progression with Wave 5 in play.
Strong recovery from Wave 4 support zone.
Next resistance aligns with Wave 5 target around 1.1700 psychological level.
Favorable R:R ratio, keeping risk well defined.
⚠️ Risk Management: Always trade with position sizing that suits your account. Stop loss is placed below Wave 4 to protect from invalidation.
📌 Disclaimer
This is purely for educational purposes and not financial advice. Please do your own research before entering any trades.
Followmeformoresetups!

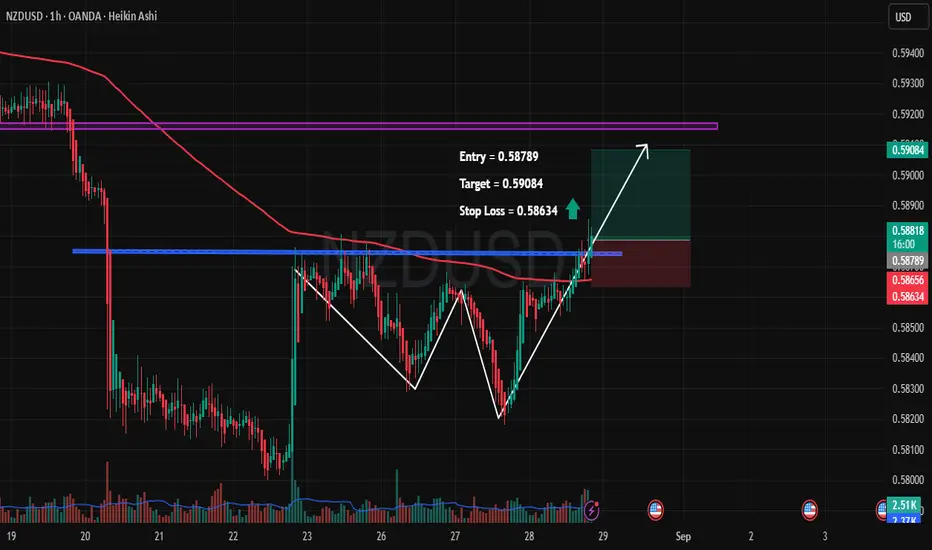
NZDUSD – Breakout Confirmation with Upside Potential🔹 Pair: NZDUSD (1H, Heikin Ashi)
🔹 Entry: 0.58789
🔹 Target: 0.59084 🎯
🔹 Stop Loss: 0.58634 🛑
🔑 Trade Rationale:
✅ Double Bottom Formation – Price respected key support twice, signaling potential reversal.
✅ Breakout Above Resistance – Clean breakout above horizontal resistance (blue line).
✅ 200 EMA Retest – Price is now pushing above the EMA, adding strength to the bullish case.
✅ Volume Spike – Recent surge in buying volume supports the upside move.
📊 Trade Plan:
I’m going long from 0.58789, looking for a quick move toward 0.59084. Risk is limited with a tight SL at 0.58634.
This setup offers a favorable R:R with a technical confluence of breakout + pattern confirmation.
⚠️ Disclaimer: This is not financial advice. Trade at your own risk. Always use proper risk management.
BTCUSD Long Setup – Trend Continuation Play📌 Trade Details
Entry: 113,256.5
Target: 115,317.7
Stop Loss: 111,874.4
📊 Trade Rationale
✅ Trend Continuation: Price has respected the ascending trendline multiple times, indicating strong buyer interest.
✅ Break of Structure: Recent higher highs and higher lows confirm bullish momentum.
✅ Support Flip: Zone around 113,050 acted as resistance earlier and is now being retested as support.
✅ Volume Confirmation: Rising volume supports the bullish continuation bias.
✅ Clean Risk–Reward: With SL below structure and TP near major resistance, this setup offers a favorable RRR.
🎯 Target Zone
The target aligns with the next strong supply zone at 115,300+, where sellers may re-enter.
⚠️ Risk Management
Always size positions wisely, as crypto remains highly volatile. Protect your capital first.
Disclaimer:
This idea is for educational purposes only and not financial advice. Do your own research before entering any trade.

BNB/USDT – Bullish Breakout Trade Idea✅ Entry: 871.564
🎯 Target: 890.455
⛔ Stop Loss: 862.304
🔎 Trade Rationale:
Ascending Triangle Breakout – Price has respected the rising trendline and finally broken above the neckline resistance, signaling bullish continuation.
Volume Confirmation – A notable increase in buying volume supports the breakout strength.
Resistance Flip – The previous supply zone around 870 has turned into support, adding confluence.
📊 With a strong bullish structure and favorable RRR, this setup aims to capture the next push towards 890 zone.
⚠️ Disclaimer: This is not financial advice. Always do your own research and manage risk before trading.

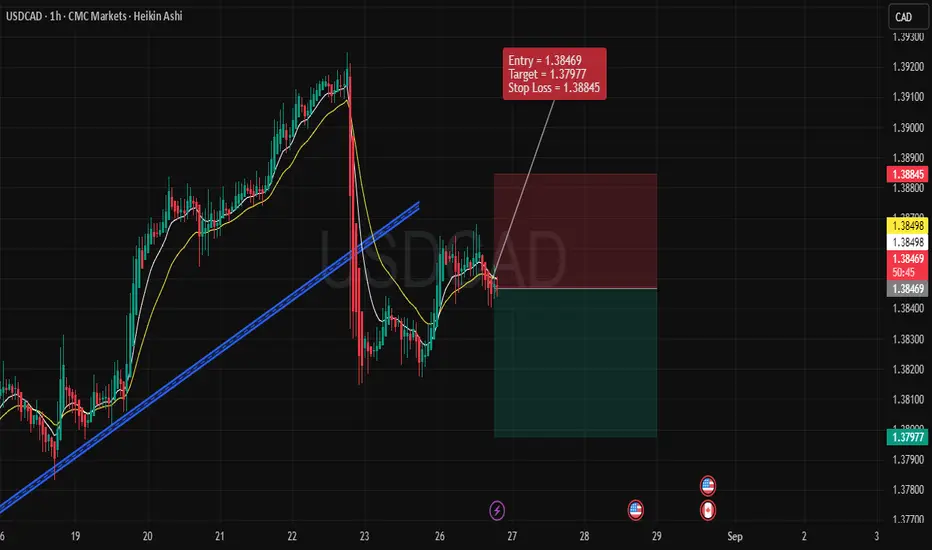
USDCAD – Bearish Trade Setup (1H Timeframe)Trade Details
Entry: 1.38469
Stop Loss: 1.38845
Target: 1.37977
🔹 Technical Reasons for Bearish Bias
Trendline Breakdown
Price recently broke below the rising trendline, indicating that the bullish momentum has weakened.
The failed retest of the broken trendline confirms bearish pressure.
Moving Averages Confirmation
The short-term moving averages (yellow lines) have crossed to the downside, aligning with bearish sentiment.
Price is trading below these moving averages, signaling sellers are in control.
Lower High Formation
After the sharp drop, the latest pullback failed to make a new higher high.
This indicates a shift from bullish structure to a bearish lower-high pattern.
Weak Recovery Attempt
The rebound after the drop is shallow and lacks strong bullish candles.
This suggests the market is unable to regain bullish momentum.
🔹 Risk Management
The Stop Loss is placed above the recent swing high (1.38845), protecting against sudden spikes.
The Target is set at 1.37977, aligning with recent support levels and offering a favorable risk-to-reward ratio.
🔹 Trade Outlook
This setup anticipates continuation of the bearish trend after the trendline break. Unless price reclaims and sustains above 1.3885, sellers remain favored in the short term. A successful breakdown could open the way for deeper downside in USDCAD.
✅ Summary:
Bearish structure confirmed by trendline break, bearish moving average alignment, and weak recovery → Entered short at 1.38469, targeting 1.37977 with stop at 1.38845.
BNB/USDT – Short Setup (1H Chart)BNB is showing weakness after repeated rejections and a break below short-term moving averages. Price action indicates selling pressure, and the recent structure suggests continuation to the downside.
🔹 Entry: 841.825
🔹 Target: 784.770
🔹 Stop Loss: 870.281
The risk-to-reward ratio looks favorable, with sellers gaining momentum as long as price remains below resistance. A breakdown from the current consolidation zone may accelerate bearish momentum toward the target zone.
⚠️ This is a short-term bearish trade idea based on technicals. Always manage risk and adjust positions as per market conditions.

Bearish Setup on BCH/USDOverview:
The market conditions and price action are currently indicating a bearish trend for BCH/USD. Below is the detailed breakdown of the trade setup and why this position is logical:
Market Structure:
The price is in a downward trend, confirmed by the lower highs and lower lows visible on the chart.
A break below key support levels, along with the current price action, suggests that the bearish move is likely to continue.
Entry Level:
Entry = 580.53: The entry has been strategically placed below a key resistance level, which is also near the recent high. This confirms that a breakdown is happening, setting the stage for further downward movement.
We are entering at a point where the price has shown weakness and failed to continue its upward movement, which typically signals a potential continuation to the downside.
Stop Loss (SL):
Stop Loss = 601.45: The stop loss has been placed above a previous swing high, ensuring that the trade will only be invalidated if the price reverses above this level, thus protecting us from a false breakout.
The chosen level ensures the risk is kept under control while still allowing for reasonable price fluctuations within the trend.
Take Profit (TP):
Target = 535.76: The target is set based on recent price action, aligning with previous support levels. This level is where the price is expected to find potential support before making any reversal.
The risk-to-reward ratio here is favorable, with a potential reward much higher than the initial risk, making the setup an attractive swing trade opportunity.
Trend Confirmation:
The price is below the 50-period and 200-period EMAs, indicating that the overall trend is bearish.
The trendline at the bottom, which slopes upward, serves as an additional support that the price is expected to break below before confirming the bearish move.
Volume:
Volume analysis indicates increasing selling pressure, supporting the bearish narrative.
A breakout with higher volume confirms the strength of the downtrend, reducing the chances of a fakeout.
Conclusion:
The overall market structure, confirmed by the price action, trend, and volume analysis, suggests that the market is likely to move lower.
With a favorable risk-to-reward ratio, this setup is logical and worth considering for those looking to enter a short position on BCH/USD.

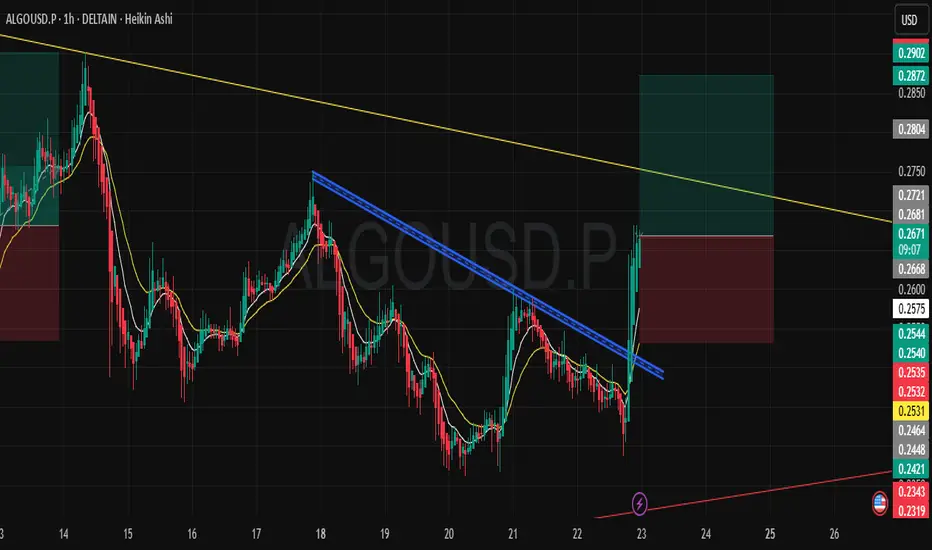
ALGO/USDT – Bullish Breakout Setup (1H)ALGO has shown a clean breakout from the descending trendline (blue) after several days of lower highs. The breakout was backed by strong bullish candles and a close above the short-term EMAs, confirming momentum shift to the upside.
🔹 Trade Plan:
Entry: Around 0.2575 (post-breakout confirmation)
Stop Loss: 0.2540 (below structure & EMAs)
Targets:
First Target: 0.2721
Second Target: 0.2804
Extended Target: 0.2902
🔹 Technical Outlook:
The descending trendline was acting as resistance since August 17 and has now been broken.
EMAs are turning upward and aligning bullishly.
Strong volume push on breakout candle indicates buyers stepping in.
Next major resistance sits near the higher descending yellow trendline – a break above that could open the way toward higher levels.
📊 Bias: Bullish as long as price holds above 0.2540. Watching for continuation toward upper resistance.
Bullish Trade Setup for XRP/USD - Pattern CompletionThis is a bullish setup based on a harmonic pattern completing, with the price approaching a key resistance zone. Our entry, stop-loss (SL), and take-profit (TP) levels are clearly marked on the chart.
Entry: 3.0628
The entry point is marked when the price reaches the ideal level for the pattern completion.
Take Profit (TP): 3.1832
This is the target area where the price is expected to move towards, as per the harmonic pattern and previous price action.
Stop Loss (SL): 2.9627
The stop-loss is placed below the low of the last structure to protect from unexpected price movement.
Technical Analysis:
Pattern Identification:
A clear bullish harmonic pattern is visible, with points X, A, B, C, and D forming a potential Bat or Gartley pattern. This type of setup has historically shown a high probability of reversal or continuation at point D.
Price Action Confirmation:
The price has already shown some signs of reversal at point C, with increasing buying volume at the current levels.
The market sentiment is strong, and we are entering at a point where the pattern completion aligns with the overall bullish market structure.
Volume:
There is a noticeable increase in volume as the price approaches the resistance zone (point X), supporting the idea of a bullish breakout.
Risk-to-Reward (RRR):
The setup offers a 1:2.56 RRR, which is well within an acceptable range, ensuring that the potential reward outweighs the risk taken on the trade.
Why This Trade Makes Sense:
Pattern Confirmation: The harmonic pattern is completing, and price action aligns with the expectations of a move higher.
Key Resistance Break: If the price breaks above the marked resistance, this could signify a strong continuation of the bullish trend.
Solid Risk Management: With a well-placed stop loss, the trade is risk-managed while giving the price room to move.
This setup provides a good risk-to-reward ratio and a high probability of success, based on the technical confluence of the harmonic pattern and price action.

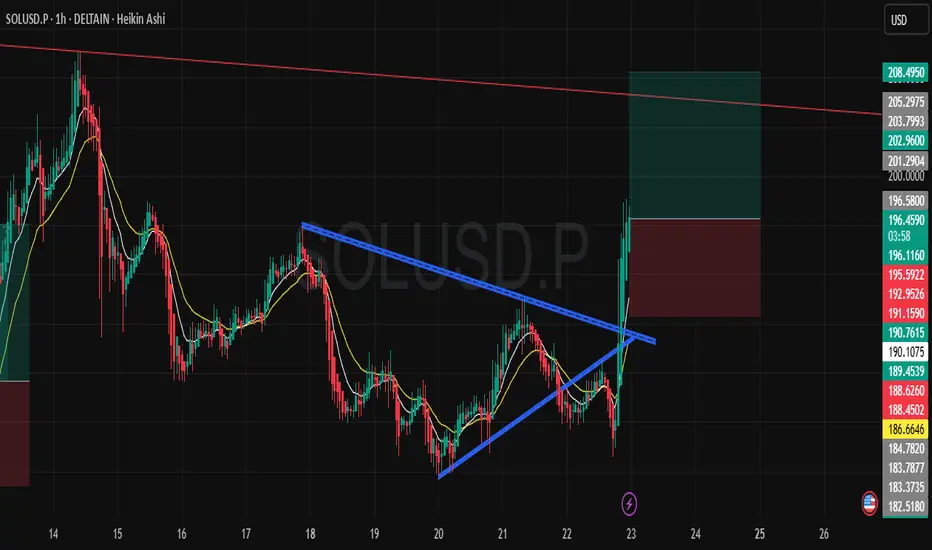
SOL/USDT – Bullish Breakout SetupOn the 1H chart, SOL has broken out of the falling wedge / descending trendline after consolidating for several sessions. The breakout is supported by strong bullish momentum and Heikin Ashi candles showing continuation strength.
Entry: Around current breakout levels (≈196.5)
Stop Loss: 191 (below recent swing low & structure support)
Target: 208 (first major resistance & fib confluence zone)
The risk-reward ratio is favorable, and as long as SOL holds above 191, the bias remains bullish with potential for further upside.
⚠️ This is not financial advice. Please manage risk accordingly.
Bearish ADA/USD Trade Idea: Downtrend Continues1. Market Analysis:
The ADA/USD pair is currently in a strong downtrend. A downward-sloping resistance line is clearly visible, highlighting the continuing pressure on price. The pattern forming is a descending triangle, which is typically a bearish signal when the price breaks below the lower support level.
2. Entry Point:
Our entry point is at 0.8292. This is based on the price action within the triangle pattern, as the market is struggling to break the resistance and is testing the lower boundary multiple times. A breakdown below this level is anticipated, continuing the bearish momentum.
3. Stop Loss:
The stop loss is set at 0.88768. This level represents a recent swing high within the triangle pattern. If price moves back above this level, the trend reversal could be signaled, so it’s crucial to manage risk with this stop.
4. Target:
The target price is set at 0.74165. This is a key support area, previously tested, and the price action indicates that it could act as the next major level of demand. This aligns with our trade objective of riding the trend toward the next significant support.
5. Rationale:
The descending triangle is a bearish continuation pattern, and the breakout below the lower support confirms the downtrend.
Volume has been decreasing as the price approaches the triangle's apex, a common sign that the market is getting ready for a breakout.
The overall trend is bearish, and this setup aligns with the prevailing market sentiment.
6. Conclusion:
This trade idea is based on a well-formed technical pattern, with clear entry, stop loss, and target levels. By entering at 0.8292, setting a stop loss at 0.88768, and targeting 0.74165, we are positioning ourselves to profit from the continuation of the current downtrend in ADA/USD.
Make sure to monitor price action closely, as any deviation from the expected pattern might require adjustments to the trade.

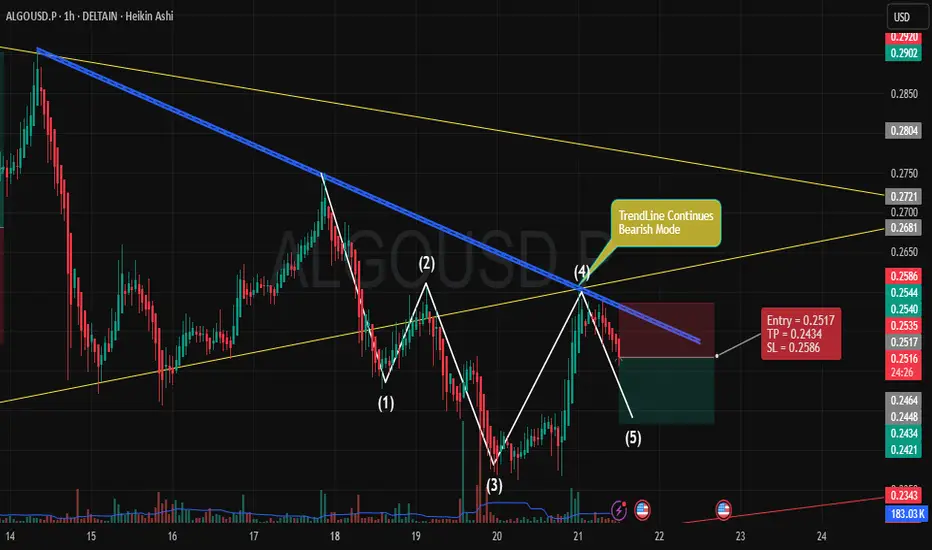
Bearish Continuation for ALGOUSD** IF you like my observation, please boost and follow for more content."
Trade Overview:
Entry: 0.2517
Stop Loss (SL): 0.2586
Take Profit (TP): 0.2434
Key Points:
Trend Analysis:
The price is currently under a bearish trend as indicated by the downward sloping blue trendline. This trendline shows consistent resistance, rejecting price rallies and continuing the bearish bias.
The yellow trendlines represent key support and resistance zones, highlighting the consolidation range where the price has been fluctuating within a defined pattern.
Market Structure:
Price has formed a lower high (marked as point 4), followed by a lower low (point 5), confirming the continuation of the downtrend. This suggests that the market is likely to keep pushing lower towards the target.
The price has retraced upwards but has failed to break the bearish trendline, reinforcing the idea of further downside potential.
Entry Strategy:
Entry Point: We are entering at 0.2517, just below the recent resistance, anticipating the price to continue downward after failing to breach the trendline.
The price action at point (4) suggests weakness in the upward movement, making this a prime opportunity to capitalize on further downside movement.
Risk-Reward Setup:
The Stop Loss is set at 0.2586, just above the last swing high, giving room for minor retracements while protecting against a breakout above the trendline.
The Take Profit is set at 0.2434, targeting the next level of support where the price could potentially find buying interest. This gives a favorable Risk-Reward Ratio of about 2:1.
Volume Confirmation:
Notice the increase in volume during the downward movement, suggesting that sellers are in control. A drop in volume during price retracements further validates the weak bullish momentum and confirms the expected continuation to the downside.
Why This Setup?
The bearish trend, price action, and trendline rejection all align with a continuation trade setup.
The risk-reward is favorable, with a clear structure to exit the trade if the price moves against the position.
The broader market context is also in line with a bearish outlook, making this a high-probability trade setup for the next few hours.
AUD/CHFGoing to the end of this week the CHF pairs are getting stronger and i believe we will be seeing a reverse in momentum so get ready for a bullish trend in going LONG now is better to buy low then low......
