Gold Explodes: Will the Uptrend Continue?News Background:
Recent weak U.S. job data has fueled expectations that the Fed will cut interest rates in September, weakening the USD and bond yields, making gold more attractive. Additionally, trade tensions between the U.S. and India have increased uncertainty, driving capital flows into gold.
Technical Chart:
Resistance: 3,450 USD is a key resistance level. If broken, the price could continue to rise towards 3,500 USD.
Support: 3,360 USD is the nearest support level. A drop below this could lead to a pullback to 3,320 USD.
RSI: Currently at 64.11, close to overbought territory, but not yet too high, suggesting the uptrend could still continue.
Outlook:
Bullish scenario: If 3,450 USD is broken, the price could reach 3,500 USD.
Bearish scenario: If 3,360 USD cannot hold, a pullback to 3,320 USD is possible.
Forex

AUDNZD Buy or Sell? AUDNZD tapped into the 4H Supply zone I’ve been monitoring for some time. On Friday, we also saw a bearish structure flip on the 15-minute timeframe — a potential signal that price may break the current demand zone and shift structure to the downside.
I didn't take any positions on Friday, but going into this week, my focus will be on the 4H Demand Zone for possible long opportunities. I’ll be watching how price reacts there — if we get bullish confirmation, I’ll consider a long setup.
For now, shorts don’t offer a favorable R:R, so I’ll remain on the sidelines unless demand breaks. If that happens, I’ll take the same approach, watching for clean structure and new entry zones.
Patience until the market reveals what it wants to do next.

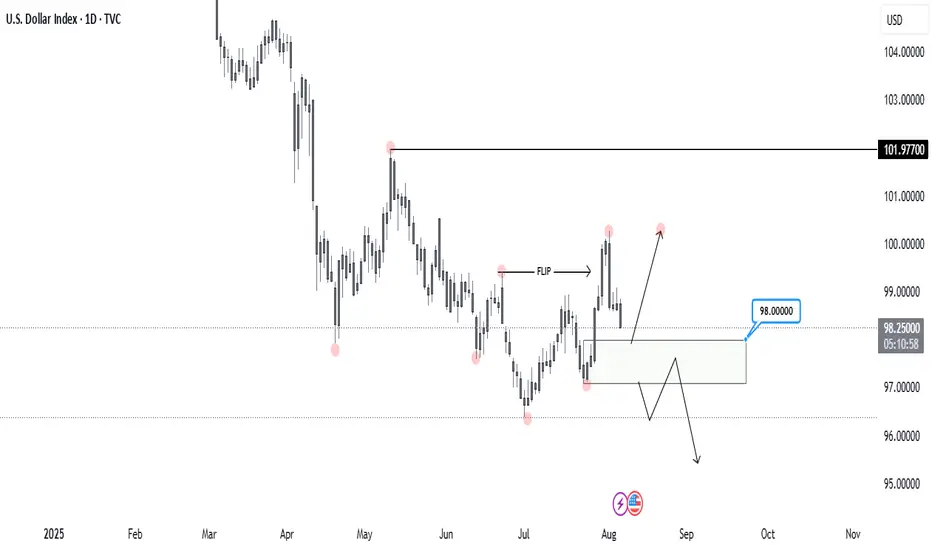
DXY, DAILYLet’s take a look at DXY on the Daily timeframe.
Price recently broke the previous Higher Low, flipping the structure to the downside. This marks a significant shift in momentum.
Now, I'm watching the 98.000 level, which I’ve identified as a Daily Demand Zone. It’s the origin of the move that broke the previous bearish structure, making it a key area of interest.
I’ll be waiting for a reaction from this zone to see if buyers step in again ( most likely ) or if the bearish momentum continues.
That would be my confirmation for xxx/usd shorts.
EURUSD TankThis looks like a very good spot to SELL the EURUSD. Economic factors are showing slightly weak US dollar, but COT reports indicate Commercials still have a lot of LONG contracts. This gives a very nice confluence with a 61.8% retracement of last week's bearish move, also paired with an attractive $1.70 price tag along with it.

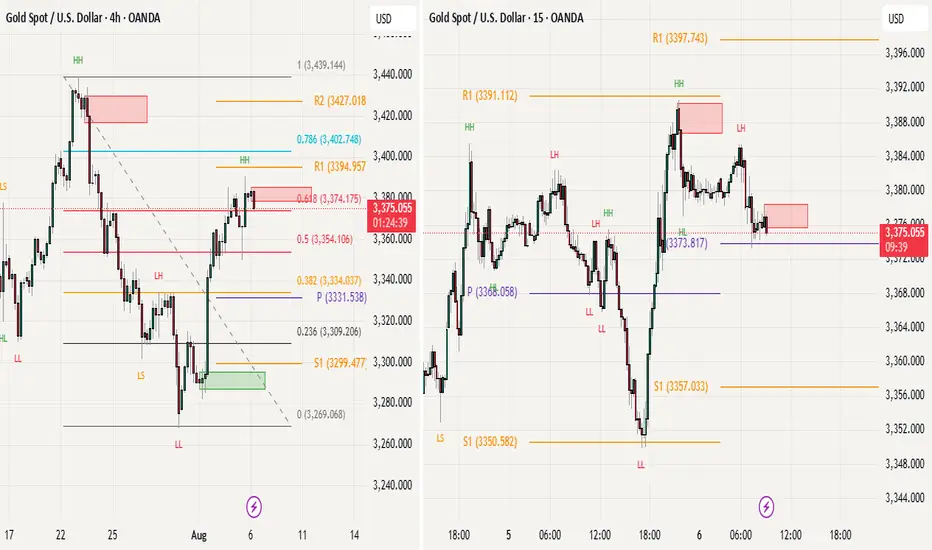
Gold Shows Strength Above Key Fibonacci LevelLooking at the broader time frame, gold has successfully maintained the upward momentum it gained on Friday, with bulls managing to sustain these higher levels. Additionally, the market has broken out aove tbhe important Fibonacci golden zone at the 60% retracement level of 3374, which is a significant bullish sign.
On the lower time frame analysis, we can observe that the 3350 level (Previos day S1) is acting as strong support for gold . Today's pivot is showing an ascending formation pattern, which is clearly visible on the 15-minute time frame chart. The intraday support level for today is at 3357.
From an overall perspective, the larger time frame structure continues to look positive and bullish and currently seems like in consolidation phase. However, if gold manages to print a high low (3335-40 will be good) on the H4 time frame, this would provide an even stronger confirmation signal for the ongoing bullish trend. The combination of sustained momentum, Fibonacci breakout, and ascending pivot formation suggests that gold remains in a favorable position for continued upward movement, provided key support levels hold.
Is gold back on track?Gold is making a strong recovery from the 3,365 USD support zone and is now hovering around 3,380 USD. After a brief correction, the price has bounced back and is heading toward the key resistance area at 3,396 USD. A breakout above this level would likely open the door for a further move toward the 3,428 USD target.
The bullish sentiment is supported by weaker-than-expected U.S. employment data, which has raised expectations that the Federal Reserve (Fed) may cut interest rates sooner. This is boosting demand for gold as a safe-haven asset.
The short-term trend now leans bullish, as long as the price holds above the 3,365 support. A confirmed breakout above 3,396 could be the signal for the next leg higher.

EURUSD – bearish trend remains dominantEURUSD is trading within a clearly defined descending channel. After a slight rebound from the 1.14800 support zone, the price is now retesting the resistance area around 1.16000 – a zone filled with multiple previous Fair Value Gaps (FVGs). If the price fails to break above this level, the bearish trend is likely to continue with a potential move down toward 1.14000.
Latest news:
Weaker-than-expected US job data initially pressured the USD, but growing expectations that the Fed will maintain its tightening stance are helping the dollar recover – putting downward pressure on the euro.
Summary:
If EURUSD fails to break above 1.16000, a continuation of the downtrend toward 1.14000 is likely in the coming days.

Gold Surges on Weak NFPHello everyone, what’s your take on XAUUSD?
Gold prices soared at the end of the last session and are now trading around $3,380. This sharp rise followed a weaker-than-expected U.S. Non-Farm Payrolls (NFP) report, which shifted market sentiment toward expectations that the Fed may delay interest rate cuts. As a result, the U.S. dollar weakened and demand for gold as a safe haven surged.
Technically, gold appears to be forming a cup and handle pattern, with the first resistance target at $3,400, followed by $3,435.
What do you think? Could this rally continue? Let us know in the comments!

XAUUSD GOLD TRADING STRATEGY August 5, 2025: XAUUSD Gold Trading Strategy August 5, 2025:
Yesterday's trading session, gold prices continued to increase sharply due to previous influences. However, the possibility of a short-term correction in gold prices at the end of the week will be very high.
Basic news: According to CME FEDWatch, the probability of the Fed cutting interest rates at its September meeting has now increased to about 84%, reflecting increasing concerns about economic weakness. The market is currently pricing in at least two 25 basis point cuts between now and the end of the year, showing a clear shift in investor sentiment after disappointing employment data.
Technical analysis: Gold's bullish momentum is currently showing signs of weakening. The peak area of 3383 - 3385 may create a double peak pattern on H1, but the possibility of gold prices correcting today is very low. Currently, gold prices are filling liquidity at support areas. The correction of gold prices may take place at the end of the week when buyers take profits.
Important price zones today: 3350 - 3355 and 3330 - 3335.
Today's trading trend: BUY.
Recommended orders:
Plan 1: BUY XAUUSD zone 3350 - 3352
SL 3347
TP 3355 - 3365 - 3375 - 3400.
Plan 2: BUY XAUUSD zone 3330 - 3332
SL 3327
TP 3335 - 3345 - 3365 - 3400.
Plan 3: SELL XAUUSD zone 3420 - 3422
SL 3425
TP 3417 - 3407 - 3387 - 3357 - OPEN (small volume).
Wish you a safe, successful and profitable trading day.🌟🌟🌟🌟🌟

EURUSD remains in a downtrendEUR/USD continues to move within a descending channel, with the 1.1600 area acting as strong resistance. Recent price action suggests the current rebound may be just a retest before the downtrend resumes. The next bearish target is around the 1.1390 support zone.
On the news front, although a strong U.S. PMI puts slight pressure on EUR, the USD faces mixed forces:
Weak NFP data increases expectations of a Fed rate cut.
The new US–EU trade deal imposing a 15% tariff has sharply weakened the euro.
Eurozone PMI improved but remains below 50, indicating a still-fragile recovery.

XAUUSD awaits breakout at confluence zoneGold is consolidating around 3,361 USD after a strong rebound from the key support zone at 3,284 USD — previously a major swing low in the existing bullish structure. Recent price action on the H4 timeframe is forming a potential Cup and Handle pattern, indicating that buying pressure remains present after each retracement.
The 3,351 USD resistance area now acts as a confluence zone, where the descending trendline from July intersects with a key horizontal level. Price behavior at this zone will likely determine the next directional move. A successful breakout would confirm the bullish continuation structure, with room to revisit the previous highs.
Current technical signals suggest that buyers are gradually regaining control, as higher lows emerge and upward momentum builds from the major support area.

NZDJPYValid trade opportunity, trying to get into buys before sells. 4H is bearish but price needs to retrace back up to balance the leg. Let's see how it goes.

Gold regains shine after Fed shiftHey traders! Let’s break down what’s been happening with XAUUSD recently.
Last week, gold made a stunning comeback — tumbling first, then surging nearly 800 pips within just a few sessions. This rapid shift was fueled by dovish signals from the Fed and soft US jobs data, which sparked growing expectations of early monetary easing.
At the same time, a global financial survey shows analyst sentiment toward gold at its highest in months. With ongoing global uncertainty, gold is once again in the spotlight as a go-to safe haven.
Despite the rally, volatility remains elevated. The next move will likely depend on upcoming economic data and fresh comments from Fed officials. Meanwhile, holiday trading could mean slower market activity in the short term.
From a technical perspective, gold has broken out of its previous downtrend channel and is moving rapidly. According to Dow Theory, a short pullback may occur — but if price holds above key support, the bullish wave could extend toward the $3,416 level, marked by the 1.618 Fibonacci extension.
This breakout might just be the beginning of a new bullish phase after weeks of sideways action.
What’s your take — is gold gearing up for something bigger?

EURCAD BUYSPrice flipped the 4H structure on EURCAD, making a new higher high and shifting bullish. I’m watching for a retrace back down into the demand zone around 1.58500 that caused the flip.
Looking for buyers to come in here again and push the price higher. Will wait for some confirmation on the 15-minute chart before entering.

GBPUSD GBPUSD is still holding bullish structure. Price has formed a Higher High, and I’ll now be watching for a retracement into the 4H demand zone to potentially form a buy setup.
As of now, there’s no reason to short — unless structure breaks and demand fails, I’ll stick to the bullish bias. If price pulls back cleanly and gives confirmation in the demand zone, I’ll look to take a long position at 1.32000 aligned with the trend.
Keeping it simple: trade with structure, wait for confirmation, and manage risk.

USDCADStructure has shifted on USDCAD — price broke the previous high and formed a new Higher High (HH), confirming a bullish trend.
I’ll be watching to see if price pulls back into the 4H Supply Zone, potentially offering a rejection and a drop lower. From there, I’ll shift focus to the Demand Zone below, where I’ll be looking for long setups if price gives clear bullish confirmation.

EURNZDEURNZD Market Outlook
The price on EURNZD has recently approached the 4H Supply Zone around the 1.96000 level and has flipped the short-term bearish structure, indicating potential bullish momentum. However, given the presence of supply, I'm monitoring the possibility of a retracement from this zone.
My primary scenario involves a short-term rejection from the 1.96000 Supply Zone, targeting a move down into the 1.94000 Demand Zone. From there, I will look for a sell-to-buy setup, with the intention of positioning for a larger upside continuation, provided bullish order flow confirms.
Alternatively, if buyers prove to be significantly strong and supply fails to hold, price may break through the 1.96000 zone and extend higher towards the daily wick area near the 1.98000 level.
Both scenarios remain valid depending on price action and volume behavior at key levels.
Will be watching 15min structure before entering any trade.

XAUUSD – Gold accelerates: Is the 3,600 target within reach?Gold has made an impressive rally of nearly 720 pips, surging from the recent bottom near 3,260 up to 3,365, following a deeply disappointing U.S. jobs report. Non-Farm Payrolls came in at just 106K, far below expectations, while the unemployment rate climbed to 4.2% — a clear sign that the U.S. economy is slowing down. In this context, the expectation that the Fed will pause rate hikes has become more solid, paving the way for gold to break higher.
Technical analysis on the D1 timeframe shows that XAUUSD remains in a well-established ascending channel that has persisted since late 2024. The recent bounce from the 3,260 support zone was strong, with yesterday's bullish candle confirming that buyers are regaining control.
As long as price holds above the 3,260 support area, the next target lies at the psychological resistance around 3,500, and beyond that — the ambitious 3,600 mark.

GBP/USD: Post-Impulse Sell Setup from Ending DiagonalThe chart depicts a completed 5-wave impulsive structure, culminating at the top of wave (5). The internal wave structure of the final fifth wave forms a classic ending diagonal pattern, typically signaling a trend reversal or deep correction.
After this extended fifth wave, the price has started rolling over, confirming the start of a corrective decline. The wave count now expects an ABC correction targeting the previous wave 4/2 demand zone, highlighted in red.
Target 1 (T1): 1.33608
Target 2 (T2): 1.32436
Stop Loss (SL): 1.35988
Ending diagonal at the top of wave (5) signals exhaustion of bullish momentum.
Clear bearish divergence (not shown here) is commonly seen with this pattern.
The price has broken the short-term structure and is now forming lower highs.
Target zone aligns with previous wave 2 consolidation – a typical retracement zone for post-impulse corrections.

EURUSD – Euro tumbles under strong dollar pressureAfter a brief uptick following the US–EU trade agreement, EUR/USD quickly sank under a wave of strong US economic data. While import tariffs on EU goods were reduced to 15%, the US dollar gained more as capital kept flowing into the US thanks to a Q2 GDP growth above 3%, steady PCE, and a strong ADP report.
On the H4 chart, the bearish structure is clear: EUR/USD broke below key support and formed a series of unfilled FVGs, signaling sellers are still in control. The current pullback towards the 1.14300 resistance zone could act as a bull trap, with the next target eyed near 1.12300 — a likely liquidity zone.
If this area breaks, the 1.1200 mark may be triggered next. Meanwhile, USD strength shows no signs of fading — especially as the Fed maintains a cautious stance with no easing in sight. The euro is no longer seen as a safe haven, and investors are gradually pulling out.

EUR/USD Elliott Wave Count Signals Downside TargetsThe EUR/USD chart is displaying a completed 5-wave Elliott impulse structure, suggesting the potential start of a larger corrective move to the downside. Wave 5 appears to have finished after a classic ending diagonal pattern, with price now breaking below the wave 4 support trendline — a strong confirmation of trend exhaustion.
Currently, price is retracing upward towards the 0.5–0.618 Fibonacci retracement zone of the last impulsive leg, around 1.15912–1.16383, which may serve as the final rejection zone for bears to re-enter. This area aligns perfectly with prior support-turned-resistance and is considered the potential reversal pocket.
If price holds below the 1.17869 invalidation level, the structure supports the beginning of an ABC correction or a larger bearish impulse.
Target 1 (T1): 1.14800
Target 2 (T2): 1.13915
Stop Loss (SL): 1.17869
This scenario remains valid as long as the price does not break above 1.17869. A clean break and close above this level would invalidate the bearish setup and suggest a possible wave extension.

GBPJPYThe 4-hour structure on GBP/JPY has turned bullish following a strong upward move that flipped the previous structure after several days of consolidation and limited volatility.
Price has now entered a Demand zone and is likely to retrace toward the 197.500 level, which aligns with a key psychological handle.
This area may present a high-probability trading opportunity, depending on how price reacts. We'll monitor for confirmation before entering a position.

XAUUSD – Gold jumps as weak US job data boosts bullish sentimentGold prices reacted positively after the US Non-Farm Payrolls came in at only 106K and the unemployment rate rose to 4.2%, signaling a cooling labor market. This weak data has lowered expectations of further rate hikes from the Fed, offering strong support for gold.
On the H4 chart, XAUUSD has formed a bottom around the 3,247 area and is now rebounding within a descending channel. A slight trendline break and a W-pattern near the bottom further reinforce the potential for a continued upward move.
Technical view:
XAUUSD is approaching a key resistance zone around 3,313 – a crucial level that could trigger a breakout. If gold breaks above it with strong buying pressure, it may head toward the upper boundary of the channel.
The RSI is recovering from oversold levels, while EMA34 and EMA89 are starting to converge – suggesting a possible trend reversal ahead.
