USDJPY Breakdown Begins:Elliott Wave Points to Deeper CorrectionThe USDJPY 4H chart shows a completed five-wave impulsive structure, ending at the recent high marked as wave (5). After finishing this full wave cycle, the price has started to break down from the rising wedge pattern, which is a common sign of a trend reversal. The corrective structure from the top suggests the beginning of a larger A-B-C decline, targeting lower levels in the coming sessions. As long as price stays below the invalidation level near 157.68, the bearish outlook remains valid. This setup indicates that USDJPY has likely completed its bullish phase and is now preparing for a deeper corrective move downward.
Stay tuned!
@Money_Dictators
Thank you :)
Forex

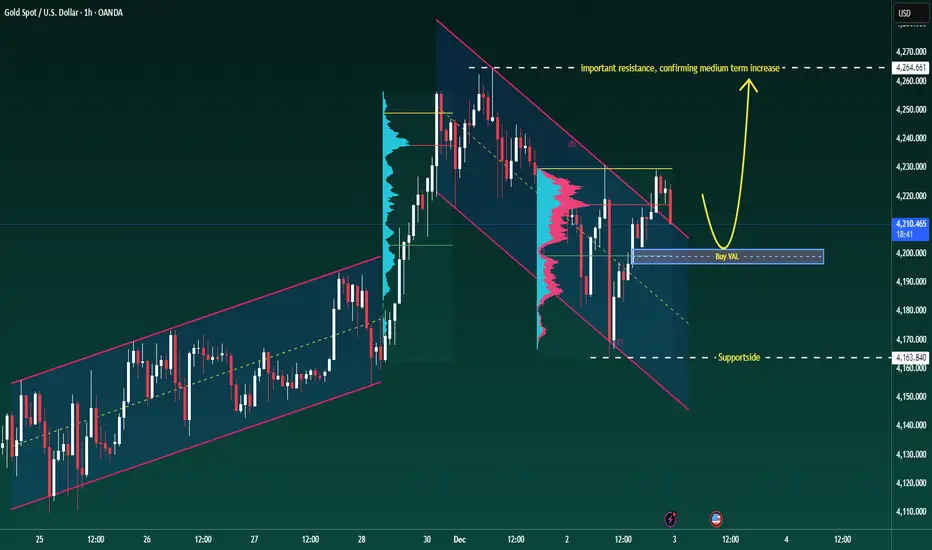
XAUUSD–Volume Profile buy scenario around 4,200, target 4,265+XAUUSD–Volume Profile buy scenario around 4,200, target 4,265+
Brian – Prioritize buying with the trend, use VAL to position entry
Market snapshot
At the end of the US session yesterday, gold had a strong increase and then stabilized, currently moving sideways around 4,216 on H1.
The structure is still an uptrend, the current decline is mainly a technical correction within the value area.
On the chart, the 4,264–4,265 area is marked as important resistance, where if broken, the medium-term uptrend could be unleashed more strongly.
Volume Profile & key price areas
The VAL (Value Area Low) of the Volume Profile is currently around 4,200 – this is an area where the market has previously accepted a large volume of trades, suitable for trend-following buys.
A deeper support area is around 4,164 (Supportsides on the chart), where buyers have previously intervened very clearly.
Above: 4,265 – confirmed resistance, if broken will strengthen the scenario of gold heading to higher price areas, matching the "super cycle 5,000 USD" story in the long term.
Trading plan for next week (according to H1 & Volume Profile)
Priority scenario – Buy at VAL with the trend
Buying area: around 4,200 (VAL of Volume Profile).
Can flexibly range 4,198–4,203 depending on spread and market conditions.
Idea: wait for the price to pull back to the VAL area, observe H1 candle reactions (long lower tail, rejection candles...) before entering the order.
Immediate targets:
TP1: area 4,240–4,245
TP2: 4,265 – important resistance marked as "important resistance, confirming medium term increase".
If the price closes clearly above 4,265 and successfully retests, consider holding part of the position or finding additional entry points, according to the scenario of expanding to higher areas in the new cycle.
Defensive scenario – Deep support
If the 4,200 area does not hold, the 4,164 area will be the next support to watch.
Closing H1/D1 below 4,164 will be a signal to reduce short-term expectations and wait for a new structure instead of trying to "buy every dip".
Fundamental context – Reasons gold is still supported
Gold is heading for its best growth year since 1979, with an increase of over 60% in 2025 – this is the context of a true bull market, not just a recovery wave.
YTD performance of XAU outperforms BTC, showing that large capital flows prioritize stability and gold's safe haven role.
Current supporting factors: US bond yields cooling, USD weakening.
Geopolitical tensions escalating, Russia–US negotiations have not brought clear breakthroughs.
The market prices in nearly a 90% chance of the Fed cutting rates at the next meeting, making non-yielding assets like gold more attractive.
Follow Brian to share the Gold scenario together
XAUUSD (Gold Spot) – Daily & H4 Update | 03 Dec 2025Yesterday’s session delivered exactly the kind of two-way volatility we often see when a strong trend starts to lose momentum. Gold opened with early selling pressure, dropped sharply, and filled the bullish Fair Value Gap (between roughly 4170–4200 before finding buyers. The 4200 psychological round number held firm as dynamic support, and more importantly, yesterday’s daily candle closed comfortably above it, a clear sign that bulls are still defending this zone aggressively for now.However, the broader context remains cautionary. As highlighted yesterday, we printed a very narrow Central Pivot Range positioned near the top of the recent range. Price ultimately closed below this CPR, which is typically a bearish development and suggests the aggressive bullish momentum we saw through November is fading, at least in the short term.Current Technical Structure
Immediate resistance cluster sits at 4245-50. A convincing H4 close above 4230 (Fib level for recent drop) would be the first meaningful sign of renewed bullish strength.
The real confirmation of trend continuation comes only with a decisive break and daily close above 4245–4250 (R1 and the recent range high). Until that happens, the path of least resistance leans lower within this ascending channel.
Key Levels to Watch TodayBullish scenario Hold above 4230 → potential retest of 4250–60
H4 close > 4230 → opens 4245–4250 and possibly 4280 (R2)
Daily close > 4245 → resumes the broader uptrend targeting 4300+
Bearish scenario Failure to sustain today’s CPR (4198–4203) on an intraday basis increases downside risk
Break and close below 4198–4200 → high-probability move toward Previous Day Low ~4165
Loss of 4165 exposes S2 ~4130 and potentially the lower levels
Summary & Bias As long as 4200 hold, the structural uptrend remains valid . That said, the narrow-top CPR, repeated failure at 4245–4250, and yesterday’s close below CPR all point to waning momentum. base case for the next 24–48 hours is continued range-bound/two-way action between 4165–4250 unless we get a clear daily close outside of this zone. A sustained break below 4198–4200 would shift near-term bias to bearish with 4165 and 4130 as logical downside targets. Conversely, bulls need to reclaim and hold 4230+ quickly to keep the November uptrend alive.

EURUSD – Retesting Demand Zone for Potential Upside ReversalPrice has tapped into a well-defined HTF demand zone after a controlled selloff. The latest wick into the zone suggests absorption and potential willingness to push higher.
If the zone continues to hold, I’m expecting bullish orderflow to kick in, leading to a structure shift and an upward continuation toward the next liquidity pool.
Bullish Path:
• Sweep into HTF demand
• Hold above the blue line (micro support)
• Shift in structure
• Continuation toward upside inefficiencies
⚠️ ENTRY CONDITION (IMPORTANT):
I will take the trade only if the LTF replicates the same structure and confirmations I’m anticipating on the HTF. No LTF alignment = No trade.
The idea remains valid as long as price respects the demand zone and doesn’t close decisively below it.

Gold Faces Critical Resistance: Will Bulls Break Through or FadeGold is currently trading around 4,217, , as bulls continue to struggle with a persistent resistance zone that has proven difficult to crack. .
The $4,240-4,250 level has emerged as a significant ceiling for gold price, repeatedly rejecting bullish advances over recent sessions. Multiple attempts by buyers to establish a foothold above this area have been met with aggressive selling pressure, creating major resistance for the current rally.
The repeated failures at this level suggest strong conviction from bears defending this zone.
Today's Central Pivot Range (CPR) formation presents a narrow range, which historically signals an imminent volatility expansion.
A narrow CPR often acts as a coiled spring the tighter the compression, the more explosive the eventual breakout. This technical setup demands heightened attention to risk management and position sizing.
Key Technical Levels to Watch
The ascending trendline (black diagonal) provides dynamic support
Bullish Order Block: $4,170-4,200 zone
Bullish Case:
A convincing breakout and close above 4,250 would invalidate the recent resistance and likely trigger stops from short sellers, potentially fueling a rapid move toward the R2 level at $4,290. The key word here is "sustain" we need to see buyers hold gains above resistance, not just spike through momentarily.
Bearish/Consolidation Case:
Failure to breach 4,250 could lead to profit-taking and a drift back toward the $4,200 level. A break below the ascending trendline would be a more significant warning sign, potentially opening the door to a test of the $4,170-4,200 order block. Loss of this support zone could accelerate selling toward $4,150.
Breakout traders: Wait for a decisive close above $4,250 with strong volume before entering long positions, targeting $4,275-4,300
Range traders: Look for mean reversion plays within the $4,200-4,240 range
Trend followers: Watch for trendline support holds for continuation long entries

XAUUSD Positional Long with SL#Gold Positional Trade Outlook
Gold is currently pulling back after a sharp rally, offering #positional traders an opportunity to build entries gradually with the target upto prev ATH or rejection. Price is approaching key demand zones, so follow a scaled stop-loss (SL) structure to manage risk effectively. Consider building positions in phases as price reacts to each support level:
SL1: 4,008 – Early protective stop for light entries
SL2: 3,930 – Medium-risk level for second build-up
SL3: 3,886 – Deep stop for long-term positional holds
Stick to disciplined risk management, add positions only on confirmations, and allow the trend structure to guide your exposure.

Weekly Gold analysis & 8R scenarioLast week gold closed positively with a strong candle showing positivity and approaching to a strong 4H FVG nested inside weekly quadrant level and making cluster. We may see both buying and selling scenarios.
Gold has also broken 4H trend line and retested it. So we can see a possible move till FVG.
We may also witness a breakout if price violates FVG and breaks all time high with strong volume support.
1. Price is creating higher highs in micro structure level and approaching towards 4hours FVG after breaking and retesting trend line at 4 Hours.
2. Trend line breakout is supported by strong volume.
3. Price is continuously running above EMAs confirming up move for now.
4. We may see a reversal scenario at 4 hour FVG level.
5. Most probably price will take liquidity of FVG/RDRB level and create MSS/CISD/TS/iFVG in LTF.
6. Price should show rejection/reversal in respective LTF (1h/15m) at FVG zone.
7. Take the trade only once clear entry model i.e. turtle soup. iFVG break, CDS or MSS happens on LTF
All these combinations are signalling a high probability and ~8R trade scenario.
Note – if you liked this analysis, please boost the idea so that other can also get benefit of it.
Also follow me for notification for incoming ideas.
Also Feel free to comment if you have any input to share.
Join me on live stream for real time update.
Disclaimer: This analysis is for educational purposes only and does not constitute investment advice. Please do your own research (DYOR) and check with your financial advisor before making any trading decisions.

XAUUSD is skyrocketing after the Adam & Eve pattern!OANDA:XAUUSD is really interesting right now. The price seems likely to rise further after the formation of the Adam & Eve pattern. With such an easy-to-remember name, the Adam & Eve pattern is one of the most memorable. Below, I’ll explain the reasons and how to easily recognize it.
The Adam pattern is characterized by a sharp drop, followed by a quick recovery, forming a "V" on the chart. High, sharp, and aggressive! You could say it's more "masculine."
On the other hand, the Eve pattern develops more slowly. The price becomes more rounded, forming a wider and smoother base before rising again, creating a shape similar to the letter "U." Softer, more curved, and more "feminine."
Combining these two elements gives us the Adam & Eve pattern, which often signals a potential trend reversal. Especially when accompanied by fundamental analysis or other strong technical indicators.
This pattern will stick in your mind when you connect its shapes to the male and female aspects. A pattern that's truly hard to forget.

CADJPY could keep rising furtherOANDA:CADJPY The market has been on a clear upward trajectory for some time, with each swing reaching higher peaks and forming higher lows. The rising trendline has been the driving force behind this momentum.
Following the recent surge, the price has pulled back slightly, forming a textbook bullish flag pattern.
This is the kind of price action you want to see in a strong uptrend—a controlled retracement with a minor dip, without any aggressive selling pressure.
The bears have failed to break the low, and the bullish momentum remains intact. As a result, the overall trend continues to hold steady.
Right now, the price is breaking out of the flag pattern, and it looks like this trend is poised to continue.
As long as the price stays above the trendline and doesn’t breach the flag's low, my outlook remains bullish.
My target is set at 113.150.

XAUUSD – Ascending Channel in Play, Upside Target Towards 4,240
Brian – Focusing on buying the dip, watching for short setups near upper resistance
Market overview & structure
On the H4 chart, gold is moving neatly inside a well-defined ascending channel, with higher highs and higher lows. The current leg is pointing towards the 4,237–4,240 region, which aligns with:
The upper boundary of the channel.
A key resistance zone.
The 1.618 Fibonacci extension and resting liquidity above recent highs.
This keeps the broader bias bullish, but as price approaches 4,240, the probability of profit-taking and short-term selling pressure naturally increases.
Wave & technical context
The current move is an extension of the previous bullish structure after price broke out of the old bearish channel and started to consolidate in a new bullish one.
Liquidity levels around 4,193 and above suggest that the market has been building positions and has room to drive price into higher resistance.
The buy zone highlighted near the lower boundary of the channel, around 4,154–4,157, is where buyers are likely to step back in to defend the trend.
As long as price holds above 4,150–4,154, the scenario of a continuation towards 4,240 remains the higher-probability path.
Key zones & trading plan
Primary scenario – Buy with the trend inside the channel
Buy zone: 4,154–4,157 (channel support + marked buy zone).
Idea: Wait for a pullback towards the lower boundary of the channel, or a brief liquidity sweep into this zone, followed by a clear rejection candle on H1/H4 before entering long.
Targets:
Short-term: 4,190–4,200 (mid-channel / interim liquidity).
Extended: 4,237–4,240 (major resistance + 1.618 Fibonacci extension).
This is a trend-following “buy the dip” setup suitable for swing or short-term positional traders.
Secondary scenario – Short-term sell from 4,237–4,240
Sell zone: 4,237–4,240 – the confluence of strong resistance and the 1.618 Fibonacci extension.
Idea: If price tags this zone and shows clear rejection (long wicks, bearish reversal pattern on H1/M15), it may offer a counter-trend short back towards the mid-channel or 4,190–4,200 support.
This is a short-term, counter-trend idea, so:
Position size should be smaller than the main long setup.
Stop loss should be kept tight above 4,240 and not dragged wider out of emotion.
News & broader context
Liquidity conditions may thin out towards the end of the day due to the ongoing Thanksgiving holiday period in the US, which can lead to sudden spikes and stop hunts, especially around obvious liquidity pools.
On the political side, headlines such as Mr. Trump’s comments about “permanently suspending immigration from third-world countries” add to general policy uncertainty, but the impact on gold is mostly indirect through broader risk sentiment.
Another interesting point: silver has been rallying strongly, supported by solar-energy demand and supply concerns. It is acting like a “silent workhorse”, attracting fresh capital. This does not remove gold’s role, but shows that precious metals as a whole are gaining attention.
Strategy & risk management
For now, my focus remains on buying dips around 4,154–4,157 in line with the ascending channel, and only looking for short, tactical sell setups if price clearly rejects 4,237–4,240.
I prefer to avoid entering fresh trades when US liquidity is very thin or right into major holiday sessions, as spreads can widen and price action can become erratic.
Once price closes decisively below the buy zone and breaks the channel structure, this bullish plan loses validity, and it is better to step aside and reassess rather than forcing trades.
What do you think – does this channel still favour the bulls, or are you expecting a deeper correction from the 4,240 region? Feel free to share your view in the comments.

GOLD XAU/USD – Testing Supply Zone! Possible Pullback SetupGold extended its bullish momentum but is now showing signs of exhaustion as it tests the 4190–4200 supply zone, where price has reacted previously.
I’ll be watching for potential short opportunities near 4185, as long as 4194 remains a protective upside barrier.
If sellers step in, possible downside targets are:
🔽 4178
🔽 4172
🔽 4168
Structure remains valid as long as the 4194 zone holds. A breakout above may invalidate the pullback idea and open the door for further bullish continuation.
⚠️ Disclaimer:
This is a technical analysis idea for educational purposes only, not financial advice. Always manage risk and follow your own trading plan.
Your feedback drives our content and keeps everyone trading smarter. Let’s make those pips together! 🚀
Happy Trading,
– The InvestPro Team

XAUUSD Outlook: Recent Gains Have Been Quite Steady!The market outlook for XAUUSD remains clearly optimistic. The latest price movement has shown a steady recovery, pushing towards the upper boundary of the newly forecasted price channel. This presents another excellent opportunity to get involved.
The market may be in the early stages of a strong new bullish leg. We could also see some consolidation or a short-term pullback before continuing towards the upper boundary, but I believe the second scenario is more likely.
My target would be 4,350.

Adani Ports & Special Economic Zone LtdCurrent price shown: ₹1,450.50, up ₹7.40 (+0.51%).
The chart displays a strong uptrend from late August onward.
A rising trendline (blue, upward-sloping) supports the price from the lows of September through November.
Price has recently pulled back slightly but is still near the upper resistance zone.
Major resistance zone highlighted: around ₹1,515–₹1,530.
Support level marked near ₹1,467–₹1,480 (shaded lower red area).
The price is currently trading close to resistance.
Volume bars at the bottom show moderate trading activity, with occasional spikes.
No abnormal volume at the latest price area.

XAUUSD – H1 uptrend channel, short-term downside risk increasingXAUUSD – H1 uptrend channel, short-term downside risk increasing Brian – Prioritize short selling at the channel peak, wait to buy back at lower support
I. Strategy Summary Gold is trading in an uptrend channel on H1, but the rise around 4.160 shows signs of weakening, increasing short-term correction risk.
Preferred Scenario: Short sell at the channel peak 4.162–4.164, targeting support areas 4.145 – 4.130 – 4.115 – 4.100.
After the correction, the 4.100–4.080 area may become the foundation for the next rise in the larger trend.
Important price areas to watch: 4.139 – 4.127 – 4.110 – 4.088.
II. Macro Context & News 27/11
02:00 – Fed releases Beige Book This document updates the Fed branches' assessment of the US economic situation.
Describing slower growth, cooling price pressures will further reinforce expectations that the Fed will soon cut interest rates → supporting gold.
Conversely, if the Beige Book describes the economy as still “resilient,” the market may temporarily slow down pricing in rate cuts → causing a short-term adjustment for gold.
19:30 – ECB releases October meeting minutes
If the minutes lean towards the scenario of keeping high interest rates longer, the EUR may be supported, indirectly affecting the USD and gold inflows.
However, the impact is usually not as strong as US data, mainly affecting the overall risk-on/risk-off sentiment.
General Context: Gold has surpassed 4.160 USD/oz as the market increasingly expects the Fed to cut interest rates as early as December, reducing the appeal of interest-bearing assets and increasing the allure of gold – a non-yielding asset. This creates a support foundation for the medium-term uptrend, but after a hot rise, technical adjustments on H1 are normal.
III. Technical Structure – H1 uptrend channel
The price is within the H1 uptrend channel, with rising peaks and troughs, but the upper area near 4.160 coincides with:
The upper boundary of the price channel. The “Sell POC” area on the chart – where liquidity and sell orders are concentrated.
Preferred scenario on the chart: The price may slightly rebound to the POC area 4.162–4.164, then be rejected and slide to the important support area around 4.110 before extending the adjustment down to 4.100–4.080.
The lower trendline of the uptrend channel also acts as a short-term buy area if a clear candle reaction appears.
Notable price areas on H1: Resistance: 4.162–4.164 (channel peak + POC). Intermediate support: 4.139 – 4.127 – 4.110. Deep support: 4.088 – 4.080 – 4.100 (area that may form the bottom for the next rise).
IV. Trading Plan 1. Preferred Scenario – Short sell at the channel peak Idea: Short sell when the price rebounds to the upper boundary of the H1 uptrend channel and POC 4.162–4.164, expecting a correction to support.
Sell: 4.162–4.164 SL: 4.168 TP targets: TP1: 4.145 TP2: 4.130 TP3: 4.115 TP4: 4.100
This is a counter-move order in the uptrend channel, only targeting a short-term correction, not a major trend reversal scenario.
2. Supplementary Scenario – Short buy at support trendline Idea: When the price hits the lower trendline of the H1 uptrend channel and a nice candle reaction appears, consider a short-term buy according to the channel, prioritizing areas:
4.139 – 4.127 – 4.110 – 4.088
Specific Entry/SL levels will depend on the actual price reaction at the trendline, but the general principle:
Buy close to the trendline,
SL placed below the immediate support area,
TP aimed at the middle of the channel or the nearest resistance.
V. Risk Management & Notes
Do not open new positions right before or at the time of the Beige Book and ECB minutes release, as volatility may suddenly increase, widening spreads.
The sell order at 4.162–4.164 is a short-term counter-trend order in the uptrend channel, requiring moderate volume and strict adherence to SL 4.168.
If the price clearly breaks and holds above the 4.170 area, the H1 correction scenario weakens – in that case, stay out, wait for a new structure instead of trying to maintain a sell view.

A Short Gold Sell Opportunity You Can't MissLooking at the chart, gold continues to move steadily within a clear downtrend channel, with each peak and trough forming progressively lower levels over time. Currently, the price is approaching the upper boundary of the channel and interacting with the same resistance area where sellers have stepped in multiple times before, forcing the market to reverse. This behavior strongly indicates that the potential for a continued corrective move downward, in line with the main trend, remains intact.
With this in mind, I believe a price decline toward the 4,080 level is a reasonable and logical target for the current correction. As long as the price hasn’t clearly broken through the upper boundary of the channel, I will continue to favor the scenario where the bearish trend remains dominant, viewing any upward movement as a mere pullback within the overall structure.
This is not financial advice, but simply my personal perspective based on the current price action.

Brian – Gold game plan for the US sessionBrian – Gold game plan for the US session
Gold’s rally yesterday shook a lot of traders out of position – the move was slow, steady and unforgiving, making it hard both to get in and to get out. For now, the short-term trend is clearer on H1, while H4 is still in transition.
Fundamental view – the Fed is confusing everyone
Fed expectations for December have been on a roller-coaster:
The market went from pricing a 25 bp cut in December at over 90%,
Then collapsed those odds to below 30%,
And has now swung sharply back again – all within about a month.
That kind of violent repricing in rate expectations usually creates two things for gold:
underlying support as soon as the market believes in easier policy again, and
choppy two-way volatility around each new data print or Fed comment.
So the macro backdrop still leans supportive for gold, but you do not want to ignore intraday whipsaws.
Technical view – H1 bullish, H4 testing the top of structure
On the H4 chart:Price is trading above the rising medium-term trendline from late October, keeping the broader structure constructive as long as 4,000 holds.
We are now pushing up towards the descending trendline and a H4 supply/FVG band between roughly 4,160 and 4,200.
Higher up sits a larger FVG / resistance block around 4,280–4,330 – if price ever accepts above the current downtrend line, that zone becomes a realistic upside magnet.
On H1:Structure is clearly bullish with higher highs and higher lows after yesterday’s impulsive move.
The current leg is extended, so I prefer to buy dips into support or a clean retest, rather than chase at the top of the candle.
Core bias: still prefer buys with the trend. Shorts are tactical, only at clear reaction zones.
Key levels
Resistance / sell zones
4,167–4,169: short-term reaction zone at the descending trendline and FVG
4,200–4,220: upper part of the same supply area
4,280–4,330: major H4 FVG / supply above
Support / buy zones
4,110–4,113: intraday support and potential retest area
4,080–4,070: minor support from recent consolidation
4,040–4,020: deeper pullback zone
4,000: key structural support; a break here would damage the bullish case
3,884: level that would confirm a medium-term bearish shift if price breaks and holds below
Trade scenarios (reference only, not financial advice)
Scenario 1 – Primary long: buy the dip into 4,110
Idea: stay with the bullish H1 structure, use the first decent pullback to get a better entry.
Entry: 4,110–4,113
Stop: 4,105
Targets: 4,125 → 4,140 → 4,180 → 4,200
I want to see price pull back into this zone after a push higher, ideally with a rejection wick or bullish candle confirming buyers are still in control.
Scenario 2 – Tactical short: fade the trendline at 4,167–4,169
Idea: counter-trend scalp from a clean confluence of resistance and FVG.
Entry: 4,167–4,169
Stop: 4,175
Targets: 4,155 → 4,140 → 4,120 → 4,105
This is not a swing short – it is a tactical trade against the intraday trend. Size should be smaller, and I would look to lock in profit or move to breakeven quickly if price reacts in our favour.
Scenario 3 – Breakout long if the trendline gives way
If gold pushes through the descending trendline and holds above the 4,170–4,180 zone:
I will shift back to a breakout-continuation mindset, looking to buy pullbacks above the broken trendline.
The next upside magnets then become 4,220 first and eventually the 4,280–4,330 FVG.
As long as 4,000 holds, I respect the upside and prefer to position with the trend, not against it. If we ever see a daily close below 4,000 and then 3,884, the whole story flips and I’ll start treating rallies as selling opportunities.
Trade the structure in front of you, not the headline noise. Manage risk around the shifting Fed expectations, and let the levels do the heavy lifting.
If this breakdown helps with your game plan, follow Brian for more gold updates during the US session and drop your own view in the comments so we can compare scenarios.

GU Intraday setup on GU
Going with the structure and bullish orderflow.
First target 4H high and will look to take some partials on 15min most recent high.
Brian – Gold Money Flow Map for the US Session TodayBrian – Gold Money Flow Map for the US Session Today
Technical analysis – trendline, FVG, and two clear scenarios
On H4, gold is still maintaining a medium-term uptrend line drawn from the end of October. The decline in the Asian session this morning was not strong enough to break the structure; the price touched the trendline and then bounced up, indicating that the sellers have not yet "crushed" this support area.
Current structure: The price is accumulating around the 4,050–4,080 area in a sideways candle cluster, lying on the uptrend line and above the 4,000 support.
Above, the 4,120–4,170 area is an FVG + important supply zone; higher is a larger FVG around 4,280–4,330 – if "filled," it is a potential area for a strong profit-taking move.
Below, the 4,000 mark is a key support; losing this mark, the price could quickly slide to the 3,884 area – marked on the chart as the level confirming a medium-term downtrend if breached.
Until 4,000 is broken, I consider this an accumulation area with a high possibility of "fake breaks" on both sides – so prioritize trading according to the trendline, not guessing tops and bottoms in the noise area.
Key levels
Resistance / sell zone: 4,100–4,110: buy confirmation zone, if rejected will become short-term supply
4,170–4,173: FVG / supply, medium-term short zone
4,280–4,330: large FVG above
Support: 4,048–4,050: trendline + intraday breakout zone
4,022–4,005: next support if the price slides off 4,040
4,000: psychological and structural support
3,884: final support; breaking down will confirm a medium-term downtrend
Trade scenarios (for reference, not investment advice)
1. Sell break intraday – follow the trend if the trendline breaks
Entry: sell when the price breaks the short trend at 4,048–4,050
SL: 4,056
TP: 4,040 → 4,022 → 4,005
Idea: if the price breaks below the current accumulation cluster and short trendline, I want to follow the initial selling force, targeting the adjacent support area 4,022–4,005. When the order goes right, SL can be moved to BE around 4,040.
2. Sell “premium” – short at the upper FVG zone
Entry: 4,170–4,173
SL: 4,178
TP: 4,160 → 4,145 → 4,122 → 4,100
This is a price zone I consider "beautiful" for medium-term trading if the market gives a deep retracement. FVG + H4 resistance converge; if the price is strongly rejected here, the TPs are successively the lower demand zone and the current range bottom.
3. Buy only after clean breakout – do not rush to catch the bottom
I am only interested in buy orders when the market structure truly confirms:
Trigger: H1/H2 candle closes clearly above 4,100
Entry: buy right around 4,100 after breakout
SL: 4,092
TP: medium-term towards the 4,145 → 4,170 → 4,230+ depending on momentum
This scenario considers 4,100 as the "exit door" from the current accumulation area. If this area holds as new support, buyers will have a clearer advantage and the money flow could push the price up to gradually fill the upper FVGs.

Gold Trading Strategy for 500 Pips!Hey traders,
As we roll into a brand-new week, gold is showing some impressive stability. XAUUSD is hanging right around the 4,050-dollar mark, and despite the quiet price action, there’s a lot happening beneath the surface that’s worth paying attention to.
The market right now is in “wait-and-see” mode as everyone watches the Federal Reserve’s next moves. Over the past few days, expectations have started to shift—more traders believe the Fed may slowly pivot toward a softer stance and potentially move closer to cutting rates by the end of the year. Because of that, bond yields have been drifting lower, the dollar is losing some of its strength, and demand for safe-haven assets like gold is starting to rise again. All of these elements together create a strong backdrop for potential upside in the short term.
On the technical side, XAUUSD is tightening inside a clean triangle structure, and for those who follow price action closely, you know what that usually means: the market is building pressure. When price consolidates this way, it often sets the stage for a strong breakout. If buyers can push through the upper boundary of this triangle, the next logical target sits up near the 4,500-dollar zone — right in line with the momentum we saw during the last bullish move.
How about you? What’s your take on this setup? Are you leaning toward another leg up, or do you think the market is prepping for a pullback first?
Wishing you a great week of trading—focused, confident, and full of solid opportunities.

Gold Stuck Between 4050-4100. Now What?Gold price is currently trading in classic range-bound behavior on the daily timeframe, with price action consolidating between the 4050-4100 area (On closing basis ) as marked by the rectangle on the chart.
Based on the current technical setup, I'm anticipating continued consolidation for approximately 6-7 weeks from this point. However, this isn't likely to be a simple sideways move the consolidation is expected to carry a bearish undertone, meaning we may see more pressure toward the lower end of the range during this period.
after mid-January, conditions appear favorable for a fresh buying rally to develop. This consolidation phase may simply be the market gathering momentum for the next leg higher, allowing for profit-taking and position adjustments before the next bullish impulse.
While range trading can be tempting during consolidation phases,., buying on dips remains the more favorable approach.

Gold at a Crossroads: Up or Down?If we zoom in and carefully observe how the GOLD price is moving, it becomes immediately clear:
The market has just shown a very strong upward impulse, but now something interesting is happening. The price is tightening and forming a small, narrow triangle, which indicates that the market is accumulating energy. In these situations, there are usually two possible directions, but given the clearly bullish context, I feel that a breakout to the upside is much more likely.
What do you think? Do you agree with me?
Leave your thoughts in the comments. And trust me, being part of the TradingView community will help you improve every day as a trader.
Of course, this is not financial advice, just my personal view on the chart.

BTC strong down trend and high RnR sell scenario..BTC is in strong down trend and broke ~ 90K level and targeting further downside levels of 82K and 75K. Price is continuously forming lower highs and BoS. Price has formed a BOS on hourly chart and approaching 1h FVG. We may expect a rejection pattern in LTF inside FVG and further downfall.
1. Price is in strong down trend and formed 1H FVG after creating BOS.
2. FVG is formed on weekly quadrant level, making it more significant,
3. Price is now approaching FVG
4. Most probably price will take liquidity of FVG/RDRB level and create MSS/CISD/TS/iFVG in LTF.
5. Price should show rejection/reversal in respective LTF (5m/15m) at FVG zone.
6. Take the trade only once clear entry model i.e. turtle soup. iFVG break, CDS or MSS happens on LTF
All these combinations are signalling a high probability and ~8R trade scenario.
Note – if you liked this analysis, please boost the idea so that other can also get benefit of it.
Also follow me for notification for incoming ideas.
Also Feel free to comment if you have any input to share.
Join me on live stream for real time update.
Disclaimer: This analysis is for educational purposes only and does not constitute investment advice. Please do your own research (DYOR) and check with your financial advisor before making any trading decisions.

The Gold Bullish Setup You Can't Miss!OANDA:XAUUSD The price is clearly approaching a critical support zone, one that has previously triggered positive reactions in the market. This zone also aligns closely with the psychological level of $4,000, which tends to capture the market’s full attention.
Given the current momentum, there’s a strong possibility that buyers will step in and push prices higher. A confirmation, such as a solid rejection pattern, a bullish engulfing candle, or a long lower shadow, would significantly increase the likelihood of a rebound. If my analysis proves accurate, and buyers regain control, we could see the price rise to around $4,070.
However, if the price breaks below this key support, it would negate the bullish outlook and could lead to further declines.
Please note, this is not financial advice!
