XAUUSD (GOLD) | BREAKOUT VS BREAKDOWN LEVEL | 29th Jan'2026XAU/USD (Gold) Outlook | 29 Jan 2026
Gold (XAU/USD) is trading near 5513, maintaining a strong bullish structure across daily, weekly, and monthly timeframes. Price is holding well above key moving averages, indicating sustained buying momentum. As long as gold stays above the 5515–5495 support zone, the upside bias remains intact with potential continuation toward 5555–5590. A decisive break below 5495 may trigger short-term corrective pressure, but the broader trend remains positive.
Breakout & Breakdown Levels
Bullish Breakout: Above 5555 | Bearish Breakdown: Below 5495
Disclaimer: This content is for educational purposes only and not financial advice. Trading involves risk; manage your position size wisely.
Forexmarket

XAUUSD (Gold) | Technical Outlook | 12th Jan'2026XAUUSD (Gold Spot) | Technical Outlook | 12th Jan'2026
Gold is trading near 4,593, gaining +1.83% intraday and holding close to record highs around 4,601. The overall trend remains strongly bullish across all timeframes, with price well above all major moving averages. Momentum indicators continue to support the upside, while short-term indicators show overbought conditions, hinting at possible intraday pullbacks or consolidation before the next move higher.
Key Decision Zone: 4,570 – 4,585
Above 4,585, bulls stay in control with upside targets at 4,600–4,605, followed by 4,620 and 4,650. Below 4,570, short-term profit booking may extend toward 4,550, 4,520, and 4,500. Shorts should be treated as intraday only, as the higher-timeframe trend remains bullish.
Above 4,585 → Bullish 🐂
Below 4,570 → Short-term Bearish 🐻
⚠️ Disclaimer:
This analysis is for educational purposes only. Not a buy/sell recommendation. Trade with proper risk management.

XAUUSD (Gold) | Technical Outlook | 9th Jan'2026XAU/USD – Gold Technical Outlook (Jan 9, 2026)
Gold (XAU/USD) is trading near 4,474 and continues to show a strong bullish structure across intraday and higher timeframes. Price is holding firmly above all major moving averages (MA 5–MA 200), signaling sustained buying strength.
Momentum indicators remain supportive with RSI around 59, MACD positive, and ADX above 30, confirming trend continuation rather than exhaustion.
As long as price holds above 4,470, the upside remains favored toward 4,481 → 4,489 → 4,501. Any dip toward 4,462–4,450 may be viewed as short-term profit booking, while the broader trend stays bullish unless 4,430 breaks decisively.
⚠️ Disclaimer: This content is for educational purposes only. Not financial advice.

XAUUSD (Gold) | Technical Outlook | 7th Jan'2026Gold (XAU/USD) is trading near 4,465, witnessing a healthy pullback after testing the 4,500 resistance zone. Despite short-term consolidation, the overall trend remains strongly bullish across Daily, Weekly, and Monthly timeframes. Price continues to hold above key moving averages, indicating buyers are still in control.
Key Levels
Resistance: 4,500 – 4,525 – 4,550
Support: 4,450 – 4,415 – 4,380
Bullish Scenario:
Holding above 4,450 keeps the upside open toward 4,500+. A breakout above 4,505 may accelerate buying momentum.
Bearish Scenario:
A sustained break below 4,440 could trigger a corrective move toward 4,415–4,380, while the broader trend remains bullish above 4,360.
Intraday Strategy:
✔ Buy on dips near 4,450–4,435
✔ Buy breakout above 4,505
✔ Sell only below 4,440 (short-term)
Macro Triggers to Watch:
• US Dollar Index & Bond Yields
• Inflation data (CPI/PPI)
• Fed speeches & FOMC signals
• Geopolitical developments
⚠️ Disclaimer:
This analysis is for educational purposes only. Gold trading involves risk. Always use proper risk management and consult your financial advisor before taking trades.

EURUSD – 15M | Liquidity Sweep → Demand Reaction →Mean ReversionPrice delivered a clean sell-side liquidity sweep into a higher-timeframe demand zone.
Displacement down exhausted, followed by acceptance and stabilization inside value.
Current structure suggests:
Sell-side taken ✔️
Price reacting from HTF demand ✔️
Expectation: mean reversion toward premium / EQ highs
Plan:
Longs favored only after confirmation on LTF
Ideal entry: sweep + reclaim of intraday lows
Targets aligned toward prior supply / liquidity resting above
Invalidation: clean breakdown and acceptance below demand
Bias stays bullish as long as demand holds.

EUR/USD Decision PhaseEUR/USD Decision Phase
Recent candles indicate a slowdown in upside follow-through, implying that short-term positioning may be crowded. This pause does not immediately invalidate the broader constructive tone but introduces the risk of a corrective rotation as liquidity is rebalanced. The projected move on the chart highlights a scenario where price may seek efficiency before determining the next directional leg.
Overall conditions suggest the market is transitioning from expansion into evaluation. Continuation higher would require renewed participation, while failure to attract follow-through could lead to a deeper reset driven by profit-taking and short-term repricing. Patience is advised as the market reveals whether this phase resolves through continuation or corrective realignment.
Price action reflects a market that has recently expanded after a prolonged phase of balanced participation. The sequence of higher intraday pushes shows growing initiative from buyers, supported by repeated structure continuation and shallow pullbacks, suggesting confidence rather than urgency. Momentum has remained constructive, with price spending more time advancing than correcting, a sign of controlled accumulation rather than emotional buying.
Recent candles indicate a slowdown in upside follow-through, implying that short-term positioning may be crowded. This pause does not immediately invalidate the broader constructive tone but introduces the risk of a corrective rotation as liquidity is rebalanced. The projected move on the chart highlights a scenario where price may seek efficiency before determining the next directional leg.
Overall conditions suggest the market is transitioning from expansion into evaluation. Continuation higher would require renewed participation, while failure to attract follow-through could lead to a deeper reset driven by profit-taking and short-term repricing. Patience is advised as the market reveals whether this phase resolves through continuation or corrective realignment.

EURUSD – Clean HTF Discount Zone Re-test With Bullish ContinuatiPrice has returned into a deep HTF discount zone, and the reaction from this area aligns well with my overarching bullish narrative. The marked zones represent the regions where I want to see LTF confirmational behavior before considering any long entries.
The structure remains intact as long as price holds above the lower boundary of the zone. A decisive close below that level will invalidate the bullish bias completely and shift the entire directional expectation.
Bullish Path:
• Price taps into the discount zone
• LTF confirms accumulation / BOS
• Price pushes toward the mid-structure continuation level
• Final objective lies near the upper liquidity pool (DOL), assuming underlying conditions remain unchanged
Key Levels Noted on the Chart:
• Entry Interest: All highlighted zones (LTF confirmation required)
• Mid-structure Expectation: Level where I want price to show EDD for continuation
• Final DOL Target: Only if macro conditions remain aligned
• Bias Invalidation: A clean close below the lower major zone
⚠️ ENTRY CONDITION (IMPORTANT):
I will execute the trade only if the LTF mirrors the structural behavior I’m expecting from the HTF.
No LTF confirmation = No trade.

EURUSD – Retesting Demand Zone for Potential Upside ReversalPrice has tapped into a well-defined HTF demand zone after a controlled selloff. The latest wick into the zone suggests absorption and potential willingness to push higher.
If the zone continues to hold, I’m expecting bullish orderflow to kick in, leading to a structure shift and an upward continuation toward the next liquidity pool.
Bullish Path:
• Sweep into HTF demand
• Hold above the blue line (micro support)
• Shift in structure
• Continuation toward upside inefficiencies
⚠️ ENTRY CONDITION (IMPORTANT):
I will take the trade only if the LTF replicates the same structure and confirmations I’m anticipating on the HTF. No LTF alignment = No trade.
The idea remains valid as long as price respects the demand zone and doesn’t close decisively below it.

USDJPY Vulnerable to Deep Pullback After Wave 5USDJPY has completed a full 5-wave rising structure inside a clear wedge pattern, which usually signals exhaustion. The final Wave (5) shows weakening momentum, and price is beginning to slip below the wedge support — an early sign that the trend may be reversing. This suggests the pair is likely entering a deeper corrective decline, potentially retracing toward 150 or lower in an impulsive A-B-C move. In simple terms: uptrend looks tired → wedge breakdown could trigger a strong downside correction.
Stay tuned!
@Money_Dictators
Thank you :)

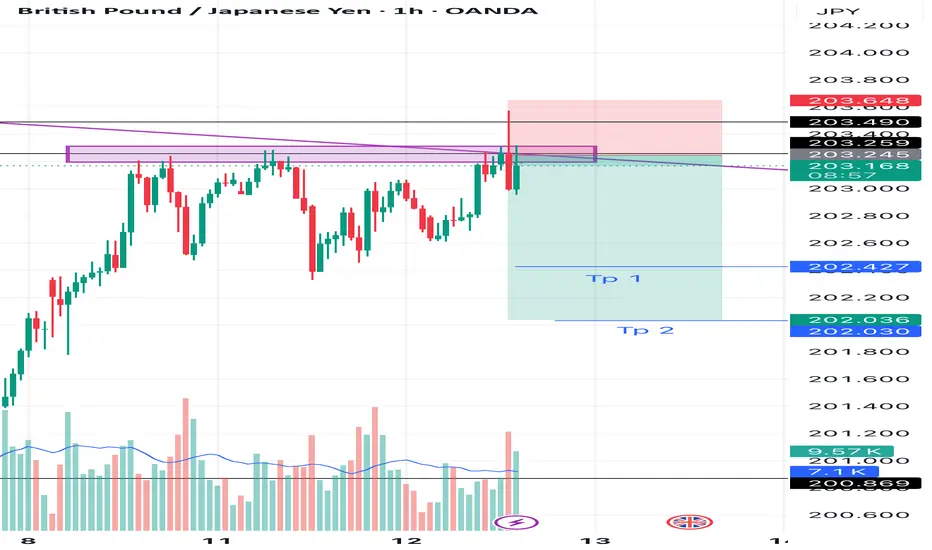
GBPJPY SHORT 1H TIME FRAME I am sitting in short of GBPJPY on 1H Time frame
Logic :- i can clearly see a good rejection with huge volumes from resistance and buyers are trapped, Sellers are gaining control so i am going for 1:2/3.
Let’s see one can take with proper SL gand targets given ✅
Trust the process 🚀, A lot more to come
Thank you guys, Like and comment for more uploads
EUR/JPY Sell Momentum BuildsEUR/JPY has officially transitioned into a sell-side trend following clear exhaustion of its previous bullish cycle. The market structure shows consecutive lower highs and strong downside displacement, confirming that sellers are now in control of short-term momentum.
Recent liquidity sweeps above prior highs were quickly rejected, signaling institutional distribution and profit-taking. Order flow dynamics continue to favor the downside, with bearish impulses showing higher efficiency than any corrective rebounds.
Momentum and sentiment both align with sustained selling pressure. The pair is operating within a redistribution phase, and the market tone remains defensive as participants seek lower value zones.
Overall outlook: Bearish bias remains dominant. The market is expected to extend lower while maintaining controlled volatility until meaningful demand re-enters the market.

EUR/USD Outlook: Buyers Regain ControlThe EUR/USD market is beginning to show early signs of recovery momentum as sentiment gradually turns constructive. After an extended period of controlled weakness, the pair is attracting renewed interest from institutional participants positioning for a potential upward rotation in the coming sessions.
Market tone has shifted from defensive to cautiously optimistic. Liquidity distribution across recent sessions indicates accumulation behavior at lower price zones, often a precursor to a bullish transition. Traders appear to be building exposure in anticipation of improved Euro-area sentiment and potential easing of dollar strength, both of which may provide the foundation for a broader corrective advance.
Price action suggests that selling pressure is losing effectiveness as downside extensions are quickly absorbed. The slowdown in bearish momentum combined with increased buying participation signals a developing phase of re-accumulation, where stronger hands begin to dominate short-term flows.
Confidence is gradually improving, supported by expectations that market equilibrium is tilting back toward Euro favor. While volatility remains moderate, structural patterns imply that the market may be preparing for a sentiment-driven expansion to the upside. The tone of order flow has shifted toward buy-side liquidity, pointing to a constructive environment for continuation of the upward phase once momentum fully confirms.
In summary, EUR/USD appears to be entering the early stage of a bullish rotation characterized by accumulation, strengthening sentiment, and declining downside conviction. The pair is poised for potential medium-term appreciation as market positioning aligns with renewed optimism toward the Euro’s relative outlook.

EURUSD Outlook: Dollar Dominance Extends as Euro WeakensThe EURUSD pair remains under downward pressure as investors continue favoring the U.S. dollar amid global economic uncertainty. The Federal Reserve’s consistent stance on keeping interest rates higher for longer has reinforced the dollar’s appeal, while weak Eurozone data — including sluggish industrial output and fading consumer confidence — has weighed on the euro’s recovery.
Market sentiment shows limited bullish strength for the euro, with traders closely monitoring upcoming U.S. inflation and ECB policy comments. Unless the Eurozone presents stronger economic momentum or fiscal support, the euro is likely to remain on the defensive.
Overall, the fundamental tone supports continued USD dominance. The broader market structure reflects bearish tendencies for EURUSD in the medium term, with investors preferring dollar exposure as a safer bet amid global uncertainty.

"Bullish Breakout Potential for Gold (XAU/USD) Above Key ?Key Observations:
The price is currently rising and is reaching a key resistance level.
A potential breakout is shown above the resistance at approximately 3,723.
A blue support zone between 3,686 and 3,690 suggests that the price has recently bounced off this level, implying bullish momentum.
The target price shown in the chart (with the green box) is positioned around 3,730, indicating that the trader is expecting further upward movement.
The stop-loss is placed just below the support zone, around 3,672, which suggests that the trader is managing risk.

XAU/USD – Captain Vincent Weekly Plan🔎 Captain’s Log – Context
📈 Main Trend : Strong uptrend after BoS.
📊 Price moving sideways within the rising channel, staying below Weak High 3674 .
📌 EMA 50 > EMA 200 → bullish trend remains solid.
🎯 Captain’s Map – Trading Scenarios
1️⃣ Golden Harbor (BUY – Main Priority)
🎯 Entry:
FVG Dock: 3602 – 3593
FVG Deep: 3567 – 3560
OB Harbor: 3535 – 3540
⛔ SL: below 3520
✅ TP1: 3674 (sweep Weak High)
✅ TP2: 3720 – 3740
2️⃣ Quick Boarding (Short-term SELL – Counter-trend)
Condition: If price breaks 3674 first → watch for false break.
🎯 Entry: 3670 – 3680
✅ TP: back to 3602 – 3567
⚠️ Note : scalp only, don’t hold long.
3️⃣ Storm Breaker Alert (Bearish Scenario)
If 3535 breaks → short-term uptrend invalidated.
🎯 Bearish target: 3480 – 3500
Captain’s Note ⚓
“The golden sail still catches the wind after BoS, leading the captain and crew on the bullish tide. Golden Harbor 🏝️ (3593 – 3560 – 3535) remains the preferred docking point to load cargo and continue the voyage. Quick Boarding 🚤 at Storm Breaker 🌊 (3670 – 3680) is only a short ride when the ship sweeps liquidity at Weak High 3674 . Should 3535 break, the ship might be dragged toward 3480 – 3500, but as long as it anchors at Golden Harbor, the grand journey still heads north toward 3720+.”

XAU/USD – FED, Tariffs & NFP Today | Captain Vincent🔎 Captain’s Log – Context & News
The probability of a FED rate cut in September has risen to 99.4% (from 96.6%) → almost certain.
FED’s Cook is under fraud investigation , combined with weak prior economic data → further strengthens momentum for Gold.
US–Japan deal : US reduces chip import tariffs to 15%, in return Japan invests 550B USD + purchases 8B USD in agricultural products. Although positive, it does not change the main outlook as markets remain focused on interest rates & inflation.
Trump : Threatens tariffs on all chip/semis companies not entering the US → raises geopolitical concerns.
NFP & Unemployment Rate (UR) tonight at 19:30 → key event, may trigger strong volatility.
⏩ Captain’s Summary:
Capital flow still leans towards BUY Gold thanks to FED rate cut expectations, but short-term shakeouts may occur before/after the news.
📈 Captain’s Chart – Technical Analysis
M30 BOS: Gold has just formed a Break of Structure, overall trend remains bullish.
Captain’s Shield (Support): 3484 – 3486 (Main Buy Zone).
Storm Breaker (Resistance): 3575 – 3593 (aligned with Fibo 0.5 – 0.618).
If it breaks 3591 – 3593 → pathway to new ATH 3608 – 3610 or higher.
If it fails at Storm Breaker → price may retest Golden Harbor (3484) before bouncing back.
🎯 Captain’s Map – Trade Scenarios
✅ Golden Harbor (BUY – Priority)
Entry: 3484 – 3486
SL: 3478
TP: 3490 → 3493 → 3497 → 3505 → 35xx
⚡ Quick Boarding (SELL Scalp – Short-term)
Entry: 3575 – 3577
SL: 3585
TP: 3570 → 3565 → 3560 → 3555 → 35xx
🌊 Storm Breaker (SELL Zone – Resistance)
Entry: 3591 – 3593
SL: 3600
TP: 3588 → 3585 → 3580 → 3575 → 35xx
⚓ Captain’s Note
“The Golden ship sails smoothly as FED is almost certain to cut rates in September. Golden Harbor 🏝️ (3484) is the safe anchorage to continue riding the bullish tide. Storm Breaker 🌊 (3575–3593) may create big waves for short Quick Boarding 🚤 , but the main current still carries us North.”

AUDJPY – High Probability Short Setup (15M)
📊 Market Insight:
AUDJPY has broken intraday structure and is now retracing into the 95.44 – 95.60 supply zone. This level is key for potential downside continuation.
🔑 Setup Details:
Supply Zone: 95.44 – 95.60
Entry Zone: 95.40 – 95.55 (confirmation required)
Targets:
TP1: 95.00
TP2: 94.85 – 94.90
Stop Loss: Above 95.60
🎯 Trading Approach:
I look for rejection or bearish confirmation candles before entering. Strict stop-loss placement and structured exits ensure controlled exposure, a must in fund management.
⚖️ Risk Management Philosophy:
Every trade is positioned with calculated risk allocation to safeguard client capital while compounding returns. Consistency and discipline form the backbone of my strategy.
📩 For Managed Accounts & Professional Trading Guidance
insta@ the_sohailarhaan

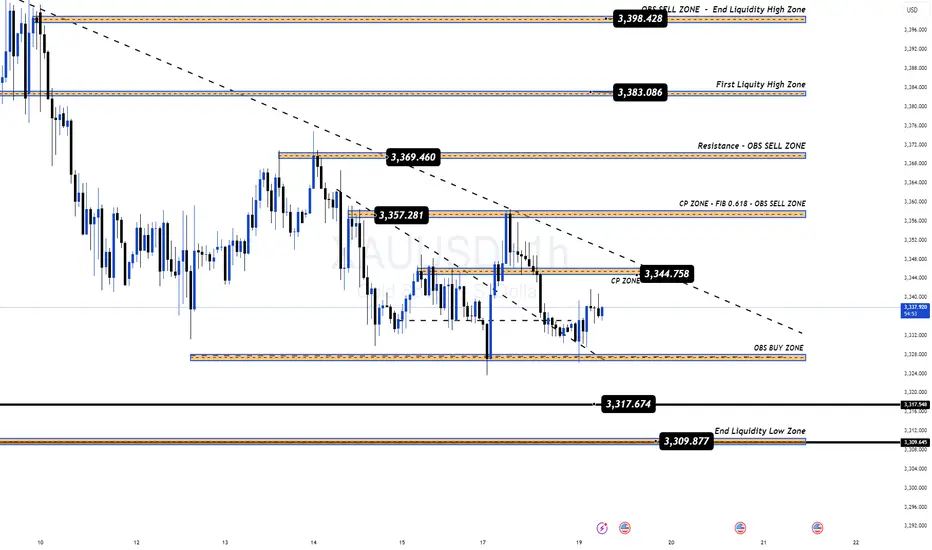
🇮🇳 Gold Under Pressure | Key Levels to Watch TodayGold continues to move in line with our weekly outlook. Despite strong rebounds from liquidity zones, the market still faces heavy selling pressure, unable to break out of the 335x – 336x resistance area.
With no major news events scheduled today, price action is expected to remain within range, making KeyLevels the most important zones to trade from.
📌 Trading Bias Today
Priority remains on SELL setups at upper resistance zones. Adjust entries slightly for better risk–reward.
For BUY positions, wait for deeper entries to avoid liquidity sweeps around 333x – 332x, which have been tested multiple times recently.
🔑 Key Market Levels
Resistance: 3346 – 3357 – 3370 – 3383
Support: 3324 – 3316 – 3309
📌 Trading Plan for India Traders
✅ BUY Zone: 3316 – 3314
SL: 3310
TP: 3320 – 3324 – 3328 – 3332 – 3336 – 3340 – 3350 – 3360+
✅ SELL Zone: 3356 – 3358
SL: 3362
TP: 3352 – 3348 – 3344 – 3340 – 3330 – 3320
⚠️ Summary
Gold remains inside a bearish channel, waiting for a clear breakout. Until major news like the FOMC hits, expect sideways price action within today’s KeyLevels.
👉 Watch reactions closely around 333x – 336x for the next potential move.
Stay disciplined, trade the levels, and let the market show its hand.
Gold Eyes Breakout from Ascending Channel Toward $3,500📈 Chart Analysis
1. Rising Channel Structure
Gold (XAU/USD) has been trading within an upward-sloping channel, marked by the blue trendlines connecting interior lows and highs, culminating at point C (~$3,497). The latest bounce off the lower channel near “B” reinforces bullish bias – if this trendline holds, another leg higher toward resistance around $3,497–$3,500 is likely.
2. Support & Resistance Confluence
The purple trendline and the dotted horizontal green level (~$3,498) converge near the projected breakout point. This synergy provides a strong pivot zone — a successful breakout would validate targets near channel highs.
3. Harmonic Pattern in Play
The chart displays a bullish harmonic structure (likely a Bat or Gartley formation), with retracement ratios (0.719, 1.627) anchoring reversal areas. These reinforce the bounce at B and the potential move toward point C.
4. Trade Scenarios
Bullish Scenario (primary): A bounce off the trendline triggers a rally to the channel top and resistance zone ($3,497–$3,500).
Bearish Caution: A drop below the trendline invalidates the pattern, potentially bringing prices back to horizontal support around $3,296 or even $3,120, as indicated at point A.
🛠️ Technical & Market Context
Technicals: Daily trend remains bullish as long as price holds above ~$3,340–$3,350, with resistance forming in the $3,380–$3,400 range
.
Fundamentals: Geopolitical tension (e.g., Middle East conflict) and safe-haven inflows continue to underpin gold — though Citi expects prices to eventually correct toward $3,300–$3,500 mid‑term
Sentiment: Some analysts advocate “selling the rallies,” especially into the $3,450–$3,500 zone . But central banks’ ongoing buying and potential Fed rate cuts support a stronger floor
.
✅ Trade Strategy
Scenario Entry Zone Target Stop Loss Placement
Play the Bounce ~$3,350–$3,360 $3,497–$3,500 Below trendline near B zone (~$3,320)
Breakout Trade On momentum above $3,400 $3,497–$3,550 Below breakout (sub-$3,380)
Bearish Trigger Break & close below trendline Back to $3,296 / 3,120 Just above trendline ($3,360)
🔍 Summary
Gold remains in a structurally bullish setup inside an ascending channel. The confluence of harmonic reversal, strong trendline support, and pending fundamental catalysts presents a high-probability opportunity to push toward the $3,500 area—provided the trendline and $3,340–$3,350 support hold. A drop below would invalidate the bullish outlook and favor deeper retracement.

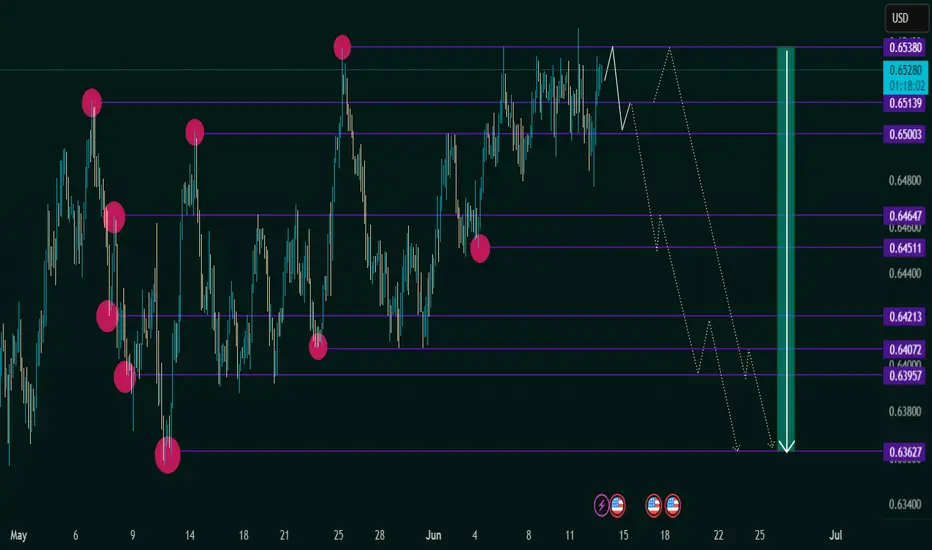
AUD/USD at Critical Resistance — Bearish Outlook Below 0.65381. Major Resistance Zone: 0.65380
Price is currently testing a strong horizontal resistance level at 0.65380, a level that has been tested multiple times (as shown by the pink circles).
This level has acted as a historical turning point, which increases its significance.
2. Price Structure: Lower Highs and Equal Highs
The chart reveals a potential double top or distribution pattern, forming under the 0.65380 resistance.
This suggests weakening bullish momentum and increases the probability of a bearish reversal.
3. Projected Bearish Path (White Dotted Lines):
If price fails to break above 0.65380 decisively, the expected move is a stepwise decline.
The projected path targets several support levels:
0.65003
0.64647
0.64213
0.63957
Final target: 0.63627, a key support from early May.
4. Support & Resistance Zones:
Resistance Levels:
0.65380 (Major)
0.65003
Support Levels (Sequential Targets):
0.64647
0.64213
0.63957
0.63627
5. Confluence with Fundamentals:
U.S. economic events (highlighted at the bottom with calendar icons) may act as volatility triggers, potentially accelerating this move.
✅ Summary & Trading Implications:
Bias: Bearish below 0.65380
Trade Idea: Watch for rejection at resistance or break below 0.65003 for confirmation.
Bearish Targets: Gradual move toward 0.63627 with key pauses at intermediate support levels.
Invalidation: Daily close above 0.65380 would negate the bearish setup and open potential for new highs.
NZDUSD - APPROACHING KEY LIQUIDITY & RESISTANCE ZONESymbol - NZDUSD
CMP - 0.6017
NZDUSD rebounds from the ascending support line, initiating a distribution phase toward the liquidity zone situated above 0.6030
A significant resistance zone is observed between 0.6020 and 0.6030, corresponding to a liquidity pool. Should the current distribution pattern persist, the market may reach a state of exhaustion, potentially resulting in a false breakout. The market currently lacks a clear trend and remains range-bound, indicating that prevailing bearish pressure could impede further upward movement.
Resistance levels: 0.6030
Support levels: 0.5969, 0.5932
In the context of a weakening US dollar, the currency pair may sustain its upward trajectory and test the 0.6030 level in the near term. However, considering the structural nature of the current price action, a downward correction appears probable thereafter.

NZDJPY - FALSE BREAKOUT IN PLAYSymbol - NZDJPY
CMP - 87.21
NZDJPY is encountering resistance within the context of a broader downtrend. The pair appears unprepared to sustain upward momentum and is currently exhibiting signs of a potential local reversal.
Within the framework of the prevailing global downtrend, the currency pair is undergoing a corrective countertrend movement and is currently testing the resistance level at 87.40, The liquidity concentration situated above this threshold has not yet permitted a continuation of the upward move. In the absence of sufficient bullish momentum, the price has reverted back into the established range, forming a false breakout above resistance. Given that the pair remains within the range and has returned below the resistance boundary, sustained bearish pressure at the 87.40 level (the upper limit of the trading range) could initiate a renewed decline, thus resuming the overarching downtrend.
Key Resistance Level: 87.40
Key Support Levels: 86.50, 85.26
A confirmed consolidation of the price below the 87.40 resistance level would reinforce the view that bullish continuation is not imminent. Additionally, the weakening US Dollar Index is contributing to strength in the Japanese Yen, which may exert further downward pressure on the NZDJPY pair.

EURAUD EYES A REBOUND - CAN THE BULLS HOLD THE SUPPORT?Symbol - EURAUD
Amid a broader global bullish trend, the EURAUD pair is currently undergoing a corrective phase, approaching the support zone of the established trading range. Market participants are observing efforts by buyers to defend the 1.7750 level.
The pair remains within a broad consolidation range. Price action near the lower boundary has exhibited signs of a false breakout and subsequent liquidity absorption, which could potentially trigger a rebound toward the midpoint of the range or even a move toward the upper resistance levels.
Sustained consolidation above the 1.7750 mark, coupled with the emergence of a local reversal pattern, may serve as a catalyst for renewed upward momentum. While the overarching trend remains bullish, the current move reflects a local correction. Fundamentally, conditions remain uncertain. However, the US Dollar Index continues to correct after a recent sharp decline.
Key Resistance Levels: 1.7855, 1.7987
Key Support Levels: 1.7750, 1.7695
Should bullish momentum prevail and price remain above the critical 1.7750 support - marking the lower boundary of the range, there is potential for a rebound targeting liquidity pools situated above resistance levels.
