XAUUSD – Bullish Reversal from Demand Zone (H1)Gold (XAUUSD) was previously trading inside a well-defined ascending channel, indicating a strong bullish trend. After reaching the upper boundary, price faced a sharp bearish correction and broke down from the channel.
Following this drop, price found strong support near the 5,000 demand zone, where buyers entered aggressively. From this area, price formed a V-shaped / rounded bottom recovery, signaling a shift in momentum from bearish to bullish.
Currently, price has reclaimed and is holding above the demand zone, showing strong bullish continuation. As long as price remains above this zone, the upside bias remains intact.
Trade Bias: Bullish above the demand zone
Entry Zone: Demand zone retest or bullish continuation
Targets:
Target 1: 5,120
Target 2: 5,198
Invalidation:
A strong break and close below the demand zone would invalidate the bullish setup.
This setup aligns with demand–supply dynamics, trend continuation, and a momentum shift, favoring buyers in the near term.
Forexpower

Forex (Currency) Trading: A Comprehensive OverviewIntroduction
Forex, short for “foreign exchange,” is the largest and most liquid financial market in the world. Unlike stock markets, Forex operates 24 hours a day, five days a week, and involves the trading of currencies. It is a decentralized global marketplace where currencies are bought, sold, and exchanged at fluctuating prices. Forex trading is essential for international trade, investment, and global business, as it allows companies, governments, and individuals to convert one currency into another.
The Forex market is unique because it is over-the-counter (OTC), meaning transactions occur directly between participants, usually via electronic trading platforms or over the phone, rather than centralized exchanges like the NYSE or NASDAQ.
How Forex Trading Works
In Forex trading, currencies are quoted in pairs, such as EUR/USD, USD/JPY, or GBP/USD. The first currency in the pair is called the base currency, and the second is the quote currency. The price of a currency pair represents how much of the quote currency is needed to buy one unit of the base currency. For example, if EUR/USD = 1.1000, it means 1 Euro costs 1.10 US dollars.
Key Concepts:
Bid and Ask Price:
The bid price is the price at which the market is willing to buy a currency.
The ask price is the price at which the market is willing to sell a currency.
The difference between them is called the spread, which represents the broker’s profit.
Leverage and Margin:
Forex brokers offer leverage, allowing traders to control large positions with a small amount of capital. For example, 50:1 leverage allows a trader to control $50,000 with just $1,000.
Margin is the amount of money a trader must deposit to open a leveraged position. While leverage can amplify profits, it can also magnify losses, making risk management critical.
Lot Sizes:
Forex trades are executed in standard sizes called lots:
Standard Lot: 100,000 units of base currency
Mini Lot: 10,000 units
Micro Lot: 1,000 units
Nano Lot: 100 units
Choosing the right lot size is essential to balance potential profits with risk.
Pips and Pip Value:
A pip (percentage in point) is the smallest price movement in a currency pair. Most currency pairs are quoted to four decimal places, so 0.0001 USD is one pip for pairs like EUR/USD. Traders use pips to measure gains or losses.
Participants in the Forex Market
The Forex market includes a wide range of participants:
Central Banks and Governments:
They intervene to stabilize their national currency or implement monetary policy. For example, the Federal Reserve may buy or sell dollars to influence the USD’s value.
Commercial Banks and Financial Institutions:
They provide liquidity and trade on behalf of clients or for proprietary profit.
Corporations:
Companies engaged in international trade use Forex to hedge currency risk. For example, an Indian exporter receiving payments in USD might convert it to INR.
Retail Traders:
Individual traders speculate on currency price movements to profit. Retail Forex trading has grown rapidly thanks to online platforms and leverage.
Types of Forex Trading
Forex trading can be approached in multiple ways:
Spot Forex:
The immediate exchange of currencies at the current market price. Most retail traders participate in the spot market.
Forward Forex Contracts:
Agreements to exchange currencies at a future date and at a predetermined rate. Often used by corporations to hedge risk.
Futures Forex Contracts:
Standardized contracts traded on exchanges like CME, specifying the amount, price, and delivery date for currencies.
Options and CFDs:
Options give the right, but not the obligation, to buy or sell a currency at a future date.
CFDs (Contracts for Difference) allow speculation on currency movements without owning the actual currency.
Major, Minor, and Exotic Currency Pairs
Currencies are categorized based on liquidity and popularity:
Major Pairs:
Include the most traded currencies, always involving USD, e.g., EUR/USD, USD/JPY, GBP/USD, USD/CHF.
Minor Pairs (Crosses):
Pairs that do not include USD, e.g., EUR/GBP, AUD/NZD.
Exotic Pairs:
Combinations of a major currency with a currency from an emerging market, e.g., USD/TRY (US Dollar/Turkish Lira). Exotics tend to be more volatile and less liquid.
Factors Affecting Currency Prices
Currency prices fluctuate due to multiple factors:
Economic Indicators:
GDP growth, employment data, inflation, and trade balances influence currency value.
Central Bank Policy:
Interest rates and monetary policy decisions impact currency strength.
Political Stability:
Elections, geopolitical tensions, and policy changes create volatility.
Market Sentiment:
Traders’ perceptions, speculation, and risk appetite drive short-term movements.
Global Events:
Natural disasters, pandemics, and trade agreements can cause sharp currency swings.
Trading Strategies
Technical Analysis:
Traders analyze charts, trends, support/resistance levels, and indicators (RSI, MACD, moving averages) to predict price movements.
Fundamental Analysis:
Focuses on macroeconomic data, interest rates, and geopolitical events to make trading decisions.
Trend Following:
Traders follow prevailing market trends, buying in an uptrend and selling in a downtrend.
Range Trading:
Profiting from price fluctuations within defined support and resistance levels.
Scalping and Day Trading:
Short-term strategies focusing on small price movements, often using high leverage.
Risks in Forex Trading
While Forex trading offers opportunities, it is high-risk:
Leverage Risk:
Amplifies both profits and losses. A wrong trade can wipe out an account quickly.
Market Risk:
Unpredictable economic or geopolitical events can cause sudden swings.
Interest Rate Risk:
Changes in interest rates affect currency valuations.
Liquidity Risk:
Some exotic currencies may lack liquidity, leading to difficulty entering or exiting positions.
Psychological Risk:
Emotions like fear and greed can lead to impulsive trading decisions.
Advantages of Forex Trading
High Liquidity:
Trillions of dollars are traded daily, ensuring easy entry and exit.
24-Hour Market:
Traders can trade around the clock, accommodating different time zones.
Leverage Opportunities:
Allows small capital to control large positions.
Diverse Strategies:
Forex supports long-term investing, day trading, swing trading, and scalping.
Conclusion
Forex trading is a dynamic and complex financial market that offers vast opportunities for profit, hedging, and international business operations. However, its decentralized nature, high leverage, and rapid fluctuations make it a high-risk endeavor requiring knowledge, discipline, and a robust risk management strategy. Successful Forex traders combine technical and fundamental analysis, stay updated with global economic events, and maintain emotional control to navigate the market effectively.
In today’s digital era, retail traders have unprecedented access to Forex through online platforms, brokers, and educational resources. While it can be rewarding, Forex trading is not a “get-rich-quick” scheme—it demands patience, continuous learning, and practical experience. Understanding market mechanics, currency behavior, and risk management is key to achieving long-term success in this fast-paced and fascinating financial world.

XAUUSD – Potential Reversal Zone Forming After BOS & CHoCH StrucChart Analysis
Based on the structure shown in your TradingView screenshot:
1. Market Structure
The chart shows a clear bullish trend leading into the current price.
Multiple Break of Structure (BOS) marks confirm buyers have been in control.
The earlier CHoCH indicates a temporary shift, but price reclaimed bullish momentum afterward.
2. Current Zone
Price has pushed into a potential reversal or supply area, shown by the shaded region around the “ENTRY” label.
This suggests you are planning a sell (short) position from that zone.
3. Premium/Discount Logic
Price is currently in the premium zone of the swing leg.
The “50% TP” line marks the midpoint of the recent bullish impulse—typical target when expecting a corrective move.
4. Short Setup Elements
Entry: At the top of the shaded zone (likely an imbalance or order block).
Stop-Loss: Presumably above the swing high inside the grey shaded area.
Take-Profit: At the 50% retracement of the previous impulse, which aligns with structure.
5. Momentum & Candlestick Behavior
The latest candles show slowing momentum into your entry zone—wicks and smaller bodies indicate weakening buyer pressure.
This supports the idea of a potential short-term reversal.
6. What Would Invalidate the Setup?
A decisive close above the upper boundary of the shaded zone → would signal continuation upward and invalidate the short.
7. What Strengthens the Setup?
Rejection wicks
Bearish engulfing from the entry zone
Lower time-frame BOS to the downside as confirmation

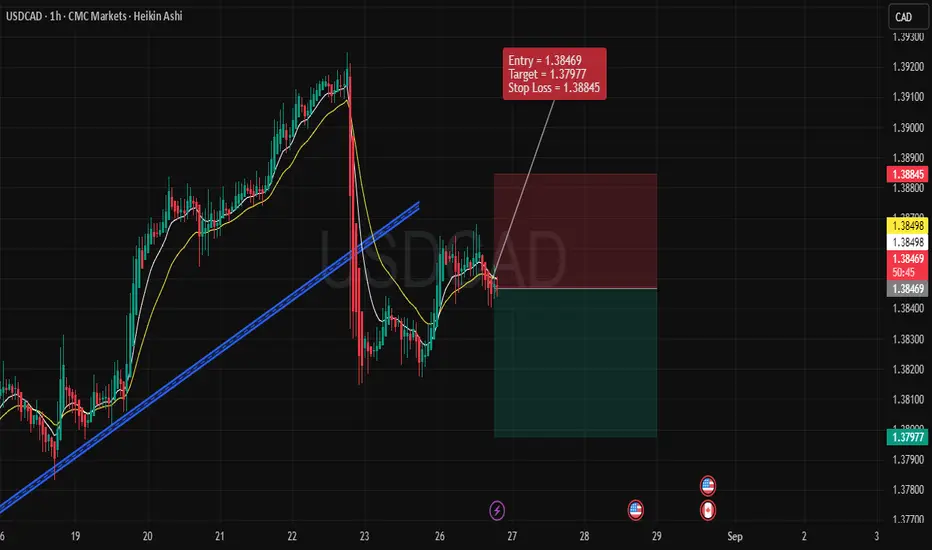
USDCAD – Bearish Trade Setup (1H Timeframe)Trade Details
Entry: 1.38469
Stop Loss: 1.38845
Target: 1.37977
🔹 Technical Reasons for Bearish Bias
Trendline Breakdown
Price recently broke below the rising trendline, indicating that the bullish momentum has weakened.
The failed retest of the broken trendline confirms bearish pressure.
Moving Averages Confirmation
The short-term moving averages (yellow lines) have crossed to the downside, aligning with bearish sentiment.
Price is trading below these moving averages, signaling sellers are in control.
Lower High Formation
After the sharp drop, the latest pullback failed to make a new higher high.
This indicates a shift from bullish structure to a bearish lower-high pattern.
Weak Recovery Attempt
The rebound after the drop is shallow and lacks strong bullish candles.
This suggests the market is unable to regain bullish momentum.
🔹 Risk Management
The Stop Loss is placed above the recent swing high (1.38845), protecting against sudden spikes.
The Target is set at 1.37977, aligning with recent support levels and offering a favorable risk-to-reward ratio.
🔹 Trade Outlook
This setup anticipates continuation of the bearish trend after the trendline break. Unless price reclaims and sustains above 1.3885, sellers remain favored in the short term. A successful breakdown could open the way for deeper downside in USDCAD.
✅ Summary:
Bearish structure confirmed by trendline break, bearish moving average alignment, and weak recovery → Entered short at 1.38469, targeting 1.37977 with stop at 1.38845.
EUR/USD 1-Hour Rising Channel – Support Zone & Potential Upside!Chart Breakdown & Technical Insights
Rising Channel Structure
The chart clearly shows EUR/USD trading within a rising channel, marked by higher highs (red arrows) and higher lows (green arrows) forming parallel support and resistance trendlines.
Key Support Zone & Bounce Potential
The price is currently sitting near the ascending trendline support, highlighted by the shaded gray box and emphasized with a circled area. Many analysts note that this lower boundary—around the 1.1690 level—serves as crucial support on a broader time frame
.
Short-Term Momentum Indicators
According to recent technical calls, EUR/USD maintains a short-term bullish bias in the rising channel. However, some momentum indicators, such as RSI, hint at weakening strength—particularly when higher price highs are not matched with higher RSI peaks, suggesting a bearish divergence
.
Potential Upside Trajectory
Should the lower channel support hold, the chart suggests a rebound toward mid-channel or potentially up to the upper boundary. Analysts highlight the 1.1720–1.1750 area as a near-term resistance, with the upper channel boundary closer to 1.1850
.
Alternative Scenario – Breakdown Risk
If EUR/USD breaks below the channel (below ~1.1690), the bullish structure may falter. That could expose the pair to deeper pullbacks, possibly testing lower support levels around 1.1650 or lower
.
** Summary Table**
Scenario Likely Outcome
Bounce off support Move up toward mid-channel (~1.172) or channel top (~1.185)
Breakdown below support Decline toward lower support zones (1.1650 and below)
Conclusion & Strategy Snapshot
The price is positioned at a critical support within a well-defined rising channel.
The bullish favored path: a rebound from the lower trendline toward resistance levels.
The bearish risk: a breakdown would shift momentum, possibly leading to deeper retracements.
Monitor for price action signals (e.g. bounce, candlestick patterns), RSI behavior, and behavior around these key levels.

Part 1: How to Analyze Events in the Forex Market?
The forex market is one of the most dynamic and volatile financial markets in the world. It is deeply influenced by global events, economic data, and geopolitical developments. Traders who understand how to analyze these events can make informed decisions and capitalize on market movements.
Influence Of the Global Events:
The forex market is directly linked to global economic health. Since currencies represent the economies of their respective countries, any significant event like an interest rate decision, inflation data, or geopolitical conflict. It can cause major fluctuations in currency prices. Here’s global events play important role:
- Central Bank Policies: When the Federal Reserve (Fed) or European Central Bank (ECB) changes interest rates, it impacts global liquidity and investment flows.
- Economic Data Releases: GDP growth, inflation, and employment reports provide insights into economic stability, affecting investor confidence.
- Geopolitical Events: Wars, elections, trade agreements, and diplomatic conflicts impact currency demand and risk sentiment.
What Happens When News Is Published?
When a major economic event or news release occurs, the forex market reacts instantly. Here’s the typical stages of events:
Stage 1: Market Expectations: Before the news release, traders anticipate the outcome based on forecasts. The market often prices in expectations.
Stage 2: Immediate Volatility: If the actual data differs from the forecast, there’s a sharp price movement in the affected currency pairs.
Stage 3: Liquidity Fluctuations: Spreads widen, and liquidity dries up momentarily as traders rush to execute orders.
Stage 4: Short-Term Correction: After the initial reaction, the market stabilizes, and price action follows the broader trend.
Major Events:
Central Bank Meetings – Institutions like the Fed, ECB, BoJ, and BoE set monetary policies. Interest rate hikes strengthen a currency, while rate cuts weaken it. Forward guidance also plays a role in shaping long-term trends.
Inflation Reports (CPI & PPI): These measure inflation levels, influencing central bank decisions. Higher inflation often leads to interest rate hikes, strengthening the currency, while lower inflation may result in monetary easing, weakening it.
Employment Data (NFP & Job Reports) – The US Non-Farm Payrolls (NFP) report is a key indicator. Strong job growth supports a stronger USD, while weak employment data signals economic trouble.
GDP Growth Reports –:A higher-than-expected GDP growth rate boosts investor confidence and strengthens the currency, while economic contraction leads to depreciation.
Political & Geopolitical Events: Elections, government policies, trade wars, and conflicts create uncertainty, often pushing investors toward safe-haven currencies like the USD, JPY, or CHF.
One's Loss, Another's Win:
When the U.S. releases strong economic data, such as higher-than-expected GDP growth, strong job reports (NFP), or an interest rate hike by the Federal Reserve, The demand for the U.S. dollar increases. This leads to USD appreciation against other currencies, including the euro.
For example,
---> EUR/USD falls : USD is gaining strength, it takes fewer dollars to buy 1 euro, causing the EUR/USD exchange rate to drop.
---> USD/EUR rises : USD is now wortth more, the inverse exchange rate (USD/EUR) increases, meaning 1 USD can now buy more euro.
Key strategies for trading events:
•Stay Ahead with an Event Calendar: Keep track of important economic events and central bank meetings to anticipate potential market-moving news.
• Gauge Market Expectations: Understand forecasts and market sentiment before the event to predict how the market might react.
• Implement Stop-Loss Orders: Protect your trades from excessive risk by setting stop-loss orders to cap potential losses during volatile moves.
• Wait for Market Stability: Allow the market to settle after the event to avoid getting caught in the initial volatility and better assess the trend.
• Evaluate the Market’s Response: Assess the immediate market reaction to the event to identify if the initial price move is sustainable or a short-term spike.
Drawbacks of Trading News:
High Volatility & Whipsaws: Prices can spike in both directions before settling on a trend, leading to stop-loss hunting.
Widened Spreads: During news releases, brokers often widen spreads, increasing trading costs.
Slippage: Rapid price movements can lead to orders being executed at unexpected prices.
Emotional Trading: Sudden market swings can trigger impulsive decisions, leading to losses.
Market Manipulation: Big players and institutions often move the market unpredictably before major news releases.
In the next part, we will focus on the specific events and strategies.

GBPUSD SETUP TRADE WIH 1:5 RISK REWARDGBPUSD SETUP TRADE WIH 1:5 RISK REWARD
A good selling setup detected on GBPUSD
It's showing a BEAR MOVE due to these reason
1. It's following THE 60 M trendline here
2. It's ready to break the neckline
3. In day chat it's showing the heavy BEARISH pressure
Just grab out will your own risk
With a small amount
Stay connected
Stay happy
Bande mataram
GBPUSD SETUP TRADE WIH 1:5 RISK REWARD
A good selling setup detected on GBPUSD
It's showing a BEAR MOVE due to these reason
1. It's following THE 60 M trendline here
2. It's ready to break the neckline
3. In day chat it's showing the heavy BEARISH pressure
Just grab out will your own risk
With a small amount
Stay connected
Stay happy
Bande mataram

Gold is waiting for market fluctuationsGold costs will remain caught until "some thing shakes up the marketplace as a whole."
to get better again to 2,340 USD/ounce. This absolutely offset final week`s losses.
Investors need to now no longer promote at the moment due to the fact "in case you are preserving gold long-term, there's no purpose to promote due to the fact the charge remains above 2,2 hundred USD/ounce".
maximum humans are having impartial predictions gold
The US economic system is slowing down, inflation is vulnerable and americaA Federal Reserve (Fed) is much less dovish. These affects lessen call for for gold, that may cause a huge promote-off.
If you're preserving gold, there's no purpose to promote due to the fact the charge remains above 2,2 hundred USD/ounce.
The marketplace might also additionally have few transactions, because of this that the hazard of big fluctuations. Geopolitical trends consisting of escalation in Ukraine or the Middle East ought to disrupt the marketplace, Grady said.

XAU rises despite weak US economic dataUS economic data on June 27 was not very positive: the number of applications for unemployment benefits reached the highest level since November 2021, the number of durable goods orders showed a bad signal for Q2 GDP, sales Pending home sales hit a record low, and finally, the Kansas Fed's manufacturing activity stagnated for the 21st straight month.
Keeping policy rates steady “for a while” may be enough to control inflation, but reiterate “a readiness to increase borrowing costs if necessary”.
Analysts say that world gold prices will likely find it difficult to break out in the short term, at least until there is clearer information about the Fed's monetary policy.
The weakening USD has pushed gold prices up above 2,300 USD
According to some experts, this is a way of pricing based on factors that do not yet exist. If the AI craze continues and the market bubble has not burst, the current price may still be considered cheap compared to future growth potential. However, because this index depends on expectations, the final results are still highly subjective.

USD is dominating the marketGold fees are forecast to range strongly withinside the last days of the week. In the fast term, the treasured steel`s help stage is 2,three hundred USD/ounce and the resistance stage is 2,340 USD/ounce.
This treasured steel is attracting cash managers and hedge funds. Look at this need
Fed Governor Michelle Bowman on Tuesday reiterated her view that maintaining coverage quotes steady “for a while” will probably be sufficient to manipulate inflation, however additionally reiterated that she is open to growing spending Loan charges if necessary.
The marketplace has tilted toward the dollar after the discharge of financial facts highlighting the resilience of americaA economy, growing an possibility for the Fed to preserve excessive hobby quotes for longer.

The market has tilted towards the greenback following the releasGold prices are forecast to fluctuate strongly in the remaining days of the week. In the short term, the precious metal's support level is 2,300 USD/ounce and the resistance level is 2,340 USD/ounce.
This precious metal is attracting money managers and hedge funds. Look at this need
Fed Governor Michelle Bowman on Tuesday reiterated her view that keeping policy rates steady “for a while” will likely be enough to control inflation, but also reiterated that she is open to increasing spending Loan fees if necessary.
The market has tilted towards the greenback after the release of economic data highlighting the resilience of the US economy, creating an opportunity for the Fed to maintain high interest rates for longer.

SELL XAU/USD @ 2031 With objective of 2017 Nose Dive.Today we are short on Gold, The Friday selling impulse after the NFP data should continue today, And looking to match our targets of 2017 soon in the US session.
The second wave was a reversal of that after the Friday jobs data, in which bonds were sold off heavily in the aftermath. That led to 10-year Treasury yields rising back above the 4% mark:

LONG ON XAU/ USD GOLDI am considering a potential entry point for a purchase on XAU/USD in the vicinity of the 2030 region. I will be monitoring market conditions closely for favorable signals before making any trading decisions. Stops will be below 2026 with an objective of 150 pips

SELL WTI (XTI/USD) 77.15 , With 180 PIPS OBJECTIVEWe are going short on Crude Oil, Due to adjustment of sentiments, and expect to move lower.
News: Drone Strike Heightens Supply Fears
Crude oil prices witnessed a surge on Monday due to increased tensions in the Middle East. A drone attack targeting U.S. forces in Jordan, believed to be orchestrated by Houthi rebels, has raised concerns over potential disruptions in oil supply. This situation is compounded by repeated assaults by the Houthis on vessels navigating the Red Sea, notably impacting a fuel tanker operated by Trafigura. Traders are now awaiting a response from the United States that could escalate the turmoil in the area.
The price action has been volatile early in the session with crude oil jumping substantially on the opening, but then pulling back more than $1.00 as traders sold the initial rally. The lack of speculative buying to sustained the price surge likely led to its intraday collapse.
The price is likely to collapse again when the dust settles.

LONG ON GOLD XAU/USD from 2020, with an upward swing objectiveThe sentiments has changed and hence now we are long on gold from 2020 region with an Upward target of 2038 , the fib retracements also point to 2038, Hopefully we will hit the intraday targets today.

A New leg Lower Till atleast 2016I am short on Gold since Friday with the expection of reaching to 2016 and extended 2009 , The market sentiments remained the same, Dxy is almost flat. Stops should be at 2032

XAU/USD- Idea Update FridayHi, We are still short on Gold, This is an Update to yesterday's Idea the Gold market rebounded due to technical shreading of Sellers, The New sell orders are heavy in 2030 region for an attempt to retest 2009 region, Our intraday projection is Gold should reach the target of 2009 -2005 by EOD.

Looking For Buying opportunity on USD/JPYBond market is Moving Up, We are looking for Buying opportunities at around 147.80 with stops below 147.00 For an upward projection of 148.80 , The trend is medium to Bullish in the Daily Timeframe.

Ascending Triangle PatternChart Type : Candlestick,
Monthly Chart,
Pattern : Ascending Triangle Pattern.
@forex
Bullish View.
Eurgbp
Target : 0.9300, 1.30580+++
SL : 0.84900
Risk is yours and Reward is too yours totally

Usdjpy short possible Usdjpy sell now @145.787
Sl 152.000
Target one 143.723
Target two 141.180
Target three 138.638
Target four 135.019
Target five 130.409
Target six 127.500
Target seven 117.095
Open this trade with 0.01 lot each position open seven positions i recommend all of you only open this trade if u have equity more than 500 usd then only open this trade otherwise ignore but if u r opening this one then sureshot i am guaranteed that u will make 1000 usd plus profits with my this forex signals open this trade and thanks me later
#forexsignals
#forextrader
#forexsignals
#forexanalysis

eur/usd time to short and follow for moretime to short @forextrading_fb @forex @eur-usd @forexmarket #trading

MY ANALYSIS ON GBPUSDHere is my analysis on GBPUSD, what do you think? Will it go as have predicted or not?

EURUSD FORECASE 13TH MARCH 2023This morning, the EUR/USD was up 0.73% to $1.07169. A bullish start to the day saw the EUR/USD rally from an early low of $1.06638 to a high of $1.07369. The EUR/USD broke through the First Major Resistance Level (R1) at $1.0702.
The EUR/USD needs to avoid a fall through R1 and the $1.0638 pivot to target the Second Major Resistance Level (R2) at $1.0765. A move through the morning high of $1.07369 would signal a bullish session. However, the EUR/USD would need hawkish ECB chatter and risk-on sentiment to support a breakout session.
In the case of an extended rally, the bulls will likely test resistance at $1.08. The Third Major Resistance Level (R3) sits at $1.0892.
A fall through R1 and the pivot would bring the First Major Support Level (S1) at $1.0575 into play. However, barring a risk-off-fueled sell-off, the EUR/USD pair should avoid sub-$1.0550 and the Second Major Support Level (S2) at $1.0511. The Third Major Support Level (S3) sits at $1.0384.
Looking at the EMAs and the 4-hourly chart, the EMAs send bullish signals. The EUR/USD sits above the 200-day EMA ($1.06609). The 50-day EMA closed in on the 100-day EMA, with the 100-day EMA narrowing to the 200-day EMA, delivering bullish signals.
A hold above R1 ($1.0702) and the 200-day EMA ($1.06609) would give the bulls a run at R2 ($1.0765) and $1.08. However, a fall through the 200-day ($1.06609) and 100-day ($1.06324) EMAs would bring the 50-day EMA ($1.06117) and S1 ($1.0575) into play. A fall through the 50-day EMA would send a bearish signal.
