“Gold Base Holds — Ready for Breakout?”📊 Technical Chart Analysis (XAU/USD)
📌 Key Levels
Strong Support Zone (Red Box) – Price has been respecting this area and has bounced multiple times — signaling accumulation/support.
Mitigated FVG & CHoCH Area (Green Zone) – This area shows prior imbalance and a possible change of character, now acting as resistance.
Higher Resistance Region (Dark Grey) – A key supply zone the price may target if bullish momentum continues.
Important Horizontal Levels:
• Around ~4300—support (green line)
• Around ~4258—deeper support (red horizontal)
📈 Bullish Scenario (Preferred)
✔ Price is holding above support.
✔ A potential CHoCH (Change of Character) indicates buyers may be stepping in.
✔ The mitigated FVG zone above ~4375/4400 is a logical target if bullish momentum resumes.
✔ The black dashed path on your chart suggests a retest of the support before continuation.
Bullish Path:
Retest support
Bounce and clear local resistance
Rally up toward the grey supply zone above ~4400–4500
📉 Bearish Alternative
If support breaks decisively:
Price could revisit the deeper support ~4258 (red horizontal)
Then possibly resume higher momentum from that level (red dashed path)
🧠 Fundamental Reasons Supporting Bullish Gold (2026)
Here are core macro drivers that could push gold prices higher:
✔ 1. Central Bank Buying & Safe-Haven Demand
Major central banks have been accumulating gold reserves aggressively, reinforcing structural demand and reducing available supply.
The Times of India
✔ 2. Anticipated Monetary Easing
Markets increasingly expect interest rate cuts or easier policy from major central banks in 2026. Lower rates reduce the opportunity cost of holding gold (which doesn’t yield interest).
State Street Global Advisors
✔ 3. Weakening U.S. Dollar
Gold is priced in USD — a weaker dollar typically boosts gold due to increased purchasing power for foreign buyers.
State Street Global Advisors
✔ 4. Geopolitical & Economic Uncertainty
Inflation risk, geopolitical tensions, and global macro instability have historically driven capital into gold as a hedge and safe-haven asset.
Financial Times
✔ 5. Portfolio Diversification & ETF Inflows
Record flows into gold ETFs and strategic institutional allocations have supported price strength.
Morgan Stanley
🟢 Bullish Fundamental Summary
Gold’s fundamentals point to a continued structural bull cycle — even if price consolidates in the short term. Central bank demand, possible rate cuts, USD weakness, and geopolitical uncertainty all provide strong backing for a continued uptrend into 2026.
State Street Global Advisors
+1
📌 Technical + Fundamental Confluence
Bullish Scenario is stronger if:
• Support holds above ~4300–4258
• Price breaks above mitigation zone around ~4400
• Volume increases on upward moves
Forexsignal

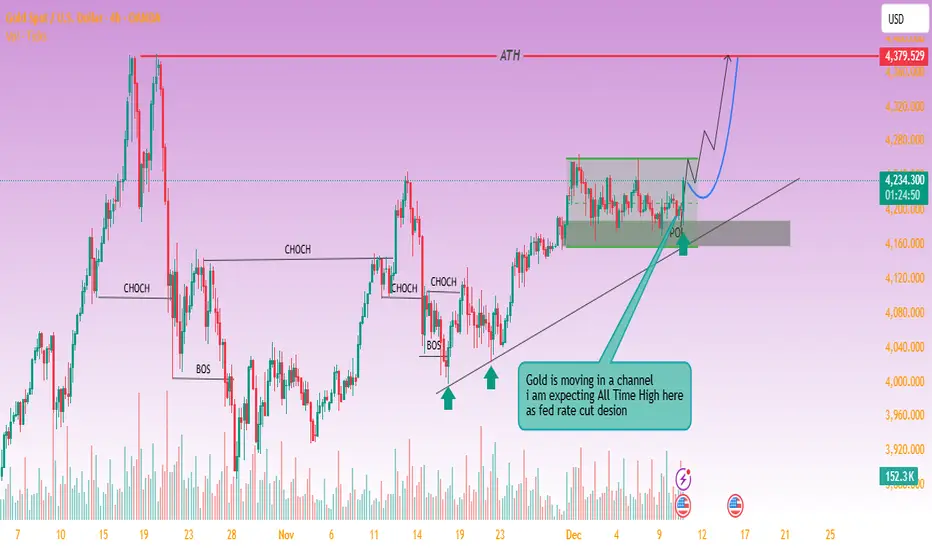
Gold Looks Prime for All-Time High Breakout📈 Technical Analysis of the Chart
The chart shows XAU/USD (Gold vs. USD) moving in what appears to be an upward-sloping channel — higher lows are marked by trend-line support.
Price recently revisited the lower boundary (support zone + trendline) and appears to have held firm — a bullish signal (i.e. a “retest & bounce”).
The annotation “POI” (Point of Interest) near that bounce suggests a probable pivot from support → initiating the next leg up.
On the upside, the chart projects a move toward a new all-time high (ATH) — the red horizontal line — implying a breakout of the current consolidation zone.
If gold breaks above current resistance and stays above the channel’s upper boundary, that increase could accelerate with bullish momentum. This aligns with typical breakout + retest strategies often used in gold trading.
Conversely, if price fails to hold this support zone and drops below the trendline, the bullish setup would be invalidated — a risk to watch, especially if sentiment shifts.
Technical conclusion: The chart shows a classic channel-retest setup — if upward momentum continues, a move toward the all-time high is well justified. The current bounce from support provides a favorable entry setup for bulls, with manageable risk if a stop-loss is set just below the channel support.
🌍 Fundamental & Macro Context
Gold’s recent strength is driven by expectations of lower interest rates: as a non-yielding asset, gold tends to benefit when rates fall because the opportunity cost of holding gold decreases.
A weaker U.S. dollar — often accompanying potential rate cuts — makes gold cheaper for foreign buyers, adding further demand support.
Broad economic context: unsteady global growth, geopolitical uncertainty, and rising demand for safe-haven assets help maintain strong gold demand.
Market forecasts remain bullish: some analysts see gold reaching as high as $4,950/oz by 2026, with a more likely base-case target around $4,500/oz — assuming rate cuts and continued macroeconomic uncertainty.
That said, the key risk remains in a potential rebound of the U.S. Dollar or abrupt shift in monetary policy (e.g. fewer rate cuts than expected) — either could undercut gold’s rally.
Fundamental conclusion: The macro backdrop — rate-cut expectations, weak USD, and global uncertainty — strongly supports a continuation of gold’s upward trajectory. If these tailwinds persist, gold’s push toward new highs is fundamentally justified.
✅ What This Setup Means & What to Watch
If bullish scenario plays out
Expect price to challenge the all-time high. A breakout may target or even exceed prior ATHs.
A bounce-and-run scenario may attract momentum traders, fueling further upside.
Key triggers to monitor
Keep an eye on announcements from Federal Reserve: rate-cut decisions or dovish signals accelerate gold demand.
Watch USD strength: a strong dollar could cap gains or reverse the uptrend.
Monitor global risk sentiment — geopolitical events or economic slowdown fears tend to push money into gold.
Risk control considerations
Use the channel support / trendline as a stop-loss anchor. A breakdown below could invalidate the bullish bias.
Consider that strong moves in the dollar or surprising inflation data might compress gold’s upside or spark a pullback.
Gold (XAU/USD) 30-Minute: Liquidity Grab Setup with Order Block1. Current Price Structure
Price is trending upward on the 30-min timeframe.
Recent candles show higher highs and higher lows, indicating short-term bullish pressure.
2. Liquidity Zone & Order Block
The grey shaded area marked as “liquidity + orderblock” is a confluence zone where stops and institutional orders are likely clustered.
Expect price to revisit this area for a shake-out of weak hands before moving higher.
The up arrow suggests that this zone could act as a launchpad for the next bullish leg.
3. Potential Pullback and Continuation
The scrawled black path shows a probable scenario:
Minor pullback to liquidity/order block area
Support test on the trendline or zone
Followed by a rejection and bullish continuation
4. Key Indicators
EMA 9 (blue) is below current price — supports short-term bullish momentum.
Ichimoku cloud is mostly supportive, with price above key lines (suggests trend stamina).
5. Resistance Ahead
The horizontal red zone near ~4,353 to 4,382 is a major supply area.
A breakout above this would confirm bullish continuation.
However, failure there could lead to deeper pullbacks.
🔥 Summary Bias
Bullish (higher probability setup)
Price is likely to:
Pull back to the support or order block area
Grab liquidity
Rally toward or above the resistance zone
🎯 Key Levels to Watch
Level Significance
~4,353 – 4,382 Major resistance / breakout target
Order Block Zone Liquidity grab & support
Trendline (rising) Dynamic support
EMA 9 Short-term support

XAU/USD Bullish Continuation Setup Toward 4,223 After Liquidity 1. Market Structure
The chart highlights a COCH (Change of Character) followed by a BOS (Break of Structure), signaling a shift from bearish to bullish structure.
Several smaller coch points confirm internal bullish structure building.
2. Liquidity & POI Zones
There is a clear liquidity sweep near the PDL (Previous Day Low), where price dipped into a demand zone to collect orders.
An Extreme POI (Point of Interest) sits below current price — this acted as the strong reaction zone for the bullish move.
PDH (Previous Day High) is marked as an early short-term target/liquidity area.
3. Expected Move
The projection (zig-zag line) indicates bullish continuation after a pullback into the POI zone.
The target is marked around 4,223.629, matching the red horizontal resistance line.
The EMA (9) serves as dynamic support, showing price respecting the bullish trend.
4. Probability Outlook
As long as price stays above the trendline and POI, the bias remains bullish.
A break below the POI would invalidate the setup and open the lower liquidity region again.

Gold Maintains Uptrend, Watch for Pullback to Buy with Cash Flow🔍 Context & Market Structure
After a strong upward impulse from a low liquidity area, the price has broken the downtrend structure and formed a bullish BoS on H1.
Currently, gold is accumulating above the Support Zone at 4,183 USD after creating a new peak and leaving a FVG just below the current price .
Above is the Liquidity Zone $$$ around 4,232 USD – a concentration of sell-side stop losses and buy-side profit-taking orders, likely to create a “final push” that attracts liquidity.
=> Overall: the main trend remains bullish , prioritising waiting for a pullback to discount levels to buy with the trend rather than chasing orders at high levels.
💎 Key Technical Zones
Liquidity Zone $$$: around 4,232 USD – upper liquidity area, prone to profit-taking reactions.
Current FVG: price gap area just below the current price (around 4.20x) – expected to “fill the gap” before continuing.
Support Zone 1: 4,183 USD – nearest support, confluence with the area where the upward impulse began to slow.
Support Zone 2: 4,140 USD – stronger support, aligning with the old structure.
Liquidity Clear: 4,101 USD – lower liquidity area, if swept, it would be a very attractive discount for swing buyers.
📈 Proposed Trading Scenarios
1️⃣ Main Scenario – Buy with the trend at FVG / 4,183 USD
Priority to wait for the price to:
Either fill the FVG around 4.20x and show a rejection candle,
Or clearly retest Support 4,183 USD with a bullish reversal signal on M15–H1.
When a confirmation signal appears:
→ Consider buying (BUY) around 4.19x – 4.18x .
Stoploss: below 4,175 USD (below the nearest low and support).
TP reference:
TP1: 4,210 USD
TP2: 4,232 USD (Liquidity Zone $$$)
TP3: trailing if the price breaks through 4,232 and maintains the bullish structure.
2️⃣ Alternative Scenario – Deeper Pullback Before Continuing Upward
If the price clearly breaks 4,183 USD and closes an H1 candle below:
→ Avoid buying hastily, wait for the price to continue adjusting to Support 4,140 USD or even Liquidity Clear 4,101 USD .
At these zones, if there appears:
strong rejection candles,
or small reversal structures (bullish ChoCH on M15),
→ Then consider buying at a discount with better RR, targeting a return to 4,183 → 4,210 → 4,232 USD.
3️⃣ Short-term Sell Scenario (for experienced scalpers only)
If the price hits Liquidity Zone 4,232 USD but shows strong rejection (long wick, high sell volume):
→ Consider short-term sell scalp back to the 4.20x – 4,183 USD area.
This is a counter-trend trade, so:
keep the volume small,
short TP,
tight SL above the newly formed peak.
⚠️ Risk Management Notes
Do not FOMO buy when the price is testing near the 4.23x area – this is a prone-to-sell area.
Prioritise waiting for a pullback to FVG / Support for a better entry point and RR.
Always adjust volume according to actual SL, avoid over-leverage during strong market volatility.
“Buy the dip in liquidity zones, do not chase orders at the peak – that's how to go with the big money flow.”

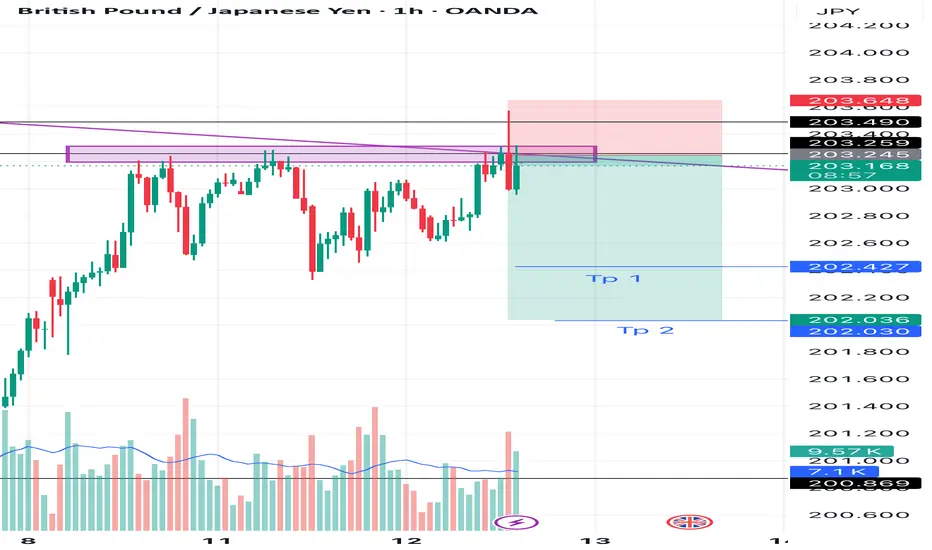
GBPJPY SHORT 1H TIME FRAME I am sitting in short of GBPJPY on 1H Time frame
Logic :- i can clearly see a good rejection with huge volumes from resistance and buyers are trapped, Sellers are gaining control so i am going for 1:2/3.
Let’s see one can take with proper SL gand targets given ✅
Trust the process 🚀, A lot more to come
Thank you guys, Like and comment for more uploads
GBP/USD Rising Wedge Breakdown PotentialThe GBP/USD 30-minute chart shows price moving within an ascending trendline but recently stalling near resistance around 1.3550–1.3560. The Ichimoku cloud suggests weakening bullish momentum, with price struggling to sustain above the support line.
Bearish Setup: A breakdown below the ascending trendline and cloud support around 1.3500 could trigger stronger downside pressure.
Targets: If selling momentum continues, price may test the 1.3420 and 1.3395 support levels.
Stop Loss: A safe invalidation zone lies above 1.3550–1.3560, where further upside would invalidate the bearish scenario.
🔎 Overall, GBP/USD looks vulnerable to a short-term pullback unless it reclaims strong bullish momentum above 1.3550.

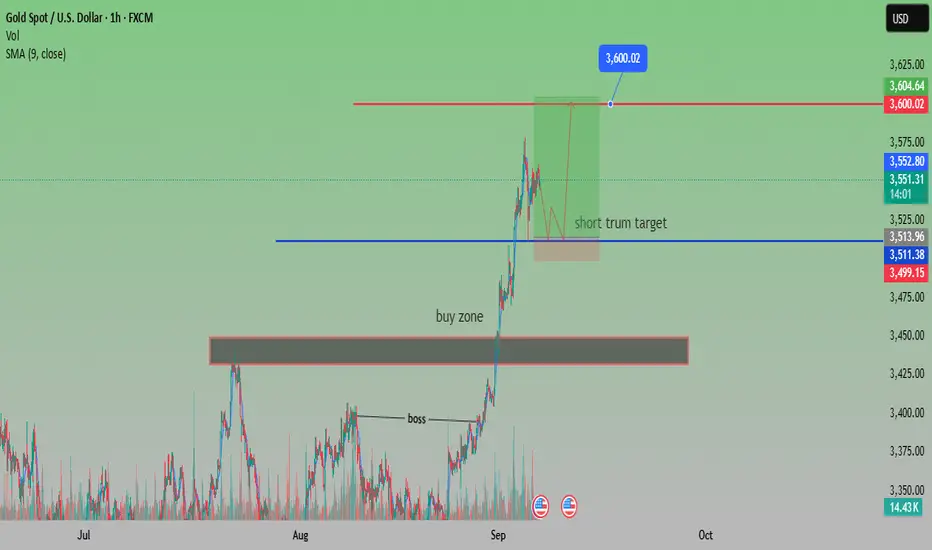
Gold Targets $3,600 After Strong BreakoutAnalysis:
Gold (XAU/USD) continues its bullish rally after breaking above the buy zone near $3,440 and holding strong momentum. The market has recently made higher highs, with price consolidating slightly below the resistance zone.
Currently, gold is trading at $3,548, with the short-term target identified at $3,600. The chart suggests potential consolidation in the highlighted area before another upward push. The SMA (9) at $3,552 is acting as dynamic support, keeping the bullish bias intact.
If buyers maintain control, a clear breakout above $3,552 – $3,560 could confirm a move toward $3,600 – $3,604. However, if momentum weakens, support lies at $3,511 and $3,499, with a deeper pullback possible toward the $3,440 buy zone.
Overall, the sentiment remains bullish, and gold looks positioned to test the $3,600 psychological resistance in the near term.
Gold (XAU/USD) Short-Term Bearish Setup1. Well-Defined Resistance Zones
Two horizontal shaded areas labeled Resistance R1 and Resistance R2 mark zones near $3,360–$3,380, where price repeatedly failed to break higher.
Trading ideas from analysts on TradingView reinforce that the immediate resistance lies around $3,364–$3,370. As long as price stays below that, sellers remain in control
TradingView
+1
.
2. Descending Channel & Bearish Momentum
The chart highlights a shift from an earlier ascending channel (green), followed by breakdown and decline — a classic reversal from bullish to bearish.
In line with this, there’s also mention of a bearish flag pattern forming on the 30-minute (M30) timeframe, offering a potential shorting opportunity
TradingView
+1
.
3. Key Support Levels & Targets
Multiple support levels annotated: Support S2 (at two levels) and Support S3, with notable levels around $3,315, $3,301–$3,302, and $3,300.
The annotated price action indicates projected declines toward those levels—especially highlighting $3,314.94, $3,301.55, and $3,300.96 as intermediate and key targets.
Ultimately, the red “High support area” below suggests a broader demand zone, perhaps around $3,280–$3,300, where stronger support may emerge.
4. Trading Plan Illustrated
White arrows depict a descending trajectory: from current levels down to each support, suggesting a sell-on-rally approach.
Blue markers denote possible bounce points for pullbacks before continuation lower.
Broader Market Context
Gold prices have recently been tracking in the $3,330–$3,350 range, facing resistance near $3,350–$3,360 and support near $3,300. Analysts caution that a break below that could push it toward $3,245 or $3,150–$3,120
TradingView
+1
.
Overall momentum has turned cautious or bearish—bearish engulfing patterns, weakening rally strength, and below-average technical indicators emphasize the risk of further declines
FXEmpire
+2
FXEmpire
+2
.
Weak U.S. economic indicators or dovish signals from Fed officials (like Powell) could offer brief relief rallies; but failure to reclaim resistance may extend the slide
FXEmpire
+1
.
Key Levels at a Glance
Level Type Price Range Notes
Resistance ~$3,350–$3,360+ Strong ceiling—decline confirms bearish bias
Support S1 ~$3,315–$3,320 First potential reaction zone
Support S2 ~$3,301 Intermediate target for sellers
Support S3 ~$3,300 Psychological barrier; near high support zone
High Support Area ~$3,280–$3,300 Zone where bullish buyers might regroup
Conclusion
Your chart effectively captures a short-term bearish trend in gold (XAU/USD), showing:
Failed attempts to overcome resistance near $3,360.
A bearish flag breakout signaling potential continuation downward.
Clearly plotted support targets, with bounce zones drawn out.
A visual trade plan suggesting sell-on-rallies targeting declining support levels until reaching a strong demand zone.
To succeed with this setup, traders might wait for a brief rally into one of the identified sell zones (e.g. ~$3,314 or $3,325) before entering shorts, with stop-loss placements above the resistance areas and profit objectives aligned with support levels ($3,301 or near $3,300).

EUR/USD 1-Hour Rising Channel – Support Zone & Potential Upside!Chart Breakdown & Technical Insights
Rising Channel Structure
The chart clearly shows EUR/USD trading within a rising channel, marked by higher highs (red arrows) and higher lows (green arrows) forming parallel support and resistance trendlines.
Key Support Zone & Bounce Potential
The price is currently sitting near the ascending trendline support, highlighted by the shaded gray box and emphasized with a circled area. Many analysts note that this lower boundary—around the 1.1690 level—serves as crucial support on a broader time frame
.
Short-Term Momentum Indicators
According to recent technical calls, EUR/USD maintains a short-term bullish bias in the rising channel. However, some momentum indicators, such as RSI, hint at weakening strength—particularly when higher price highs are not matched with higher RSI peaks, suggesting a bearish divergence
.
Potential Upside Trajectory
Should the lower channel support hold, the chart suggests a rebound toward mid-channel or potentially up to the upper boundary. Analysts highlight the 1.1720–1.1750 area as a near-term resistance, with the upper channel boundary closer to 1.1850
.
Alternative Scenario – Breakdown Risk
If EUR/USD breaks below the channel (below ~1.1690), the bullish structure may falter. That could expose the pair to deeper pullbacks, possibly testing lower support levels around 1.1650 or lower
.
** Summary Table**
Scenario Likely Outcome
Bounce off support Move up toward mid-channel (~1.172) or channel top (~1.185)
Breakdown below support Decline toward lower support zones (1.1650 and below)
Conclusion & Strategy Snapshot
The price is positioned at a critical support within a well-defined rising channel.
The bullish favored path: a rebound from the lower trendline toward resistance levels.
The bearish risk: a breakdown would shift momentum, possibly leading to deeper retracements.
Monitor for price action signals (e.g. bounce, candlestick patterns), RSI behavior, and behavior around these key levels.

3330 Liquidity Zone – A Fresh Bullish Structure is Emerging!The 3330 liquidity zone continues to prove its strength as gold rebounds sharply from this level, forming a clean new bullish structure on the M30 timeframe. Buyers are now pushing price to trade around 334x, and if this momentum holds, the next upside targets lie at the FIB – CP Zones above 335x and 336x.
On the higher timeframe, the corrective wave is still in play, but short-term price action is opening opportunities for both BUY & SELL setups, provided we time our entries with precision.
Market Context & Key News
Today, the market will be watching the Trump–Putin meeting, which could trigger sharp geopolitical-driven moves.
This Friday also brings the usual liquidity sweep, adding to potential volatility.
That’s why MMFLOW recommends observing the trend closely to pick safe entry points and avoid getting caught in false breaks.
Trading Plan
1. SELL Zones
3355 – Prime OBS SELL ZONE, expecting strong reaction.
3362 – Higher resistance, aligned with the descending trendline. Note: Best to take entries here if reached during Asia or early London; late London/NY session tests are prone to false break traps.
2. BUY Zones
Watch 3334 – 3336 for early BUY entries on lower timeframes.
Safe stop-loss: below 3330.
If 3330 breaks → wait patiently for BUY opportunities around 331x.
Action Strategy
Prioritise early BUYs at 3334–3336 with confirmation signals.
SELL at 3355 or 3362 if clear rejection occurs.
Manage risk strictly – SL below 3330 for BUYs and above 3365 for SELLs.
💡 MMFLOW NOTE: This is gold – volatility can erupt at any moment. Control your emotions, wait for precise setups, and you’ll gain the edge.

Gold Price Faces Key Resistance — Can Bulls Break $3,440?The XAU/USD (Gold vs. USD) 1-hour chart shows a strong bullish structure within an upward channel, supported by higher highs and a recent ATH (All-Time High) retest.
Resistance Zone: $3,410 – $3,440 is acting as a significant supply area. Price may face selling pressure here.
Support Levels: First support lies near $3,300 (supply zone), followed by the $3,225–$3,250 demand zone.
Trend: The price is respecting the upward trendline, but a break below could trigger a retest of the green supply zone.
Bullish Scenario: A breakout and close above $3,440 could lead to a continuation toward $3,475+.
Bearish Scenario: Rejection from the resistance zone with a break below $3,300 could push price toward the $3,225 support.
Overall, gold is currently in a bullish trend, but needs to overcome the $3,440 barrier for further upside momentum.

Gold (XAU/USD) in Symmetrical Triangle – Short‑Term Squeeze,Price Structure & Technical Setup
Gold is consolidating within a symmetrical triangle, showing lower highs and higher lows—a classic precursor to breakout in either direction
Fxglory Ltd
+5
TradingView
+5
Babypips.com
+5
TradingView
+2
Babypips.com
+2
TradingView
+2
.
Trendlines converge tightly around $3,326–$3,334, hinting at imminent directional acceleration
Investopedia
+4
TradingView
+4
TradingView
+4
.
🎯 Key Levels & Targets
Scenario Trigger Confirm Area Targets Stop Loss
Bullish Breakout above $3,344–$3,350 $3,369 → $3,396 → $3,422–$3,550 ~$3,340
Bearish Breakdown below ~$3,326–$3,320 $3,320 → $3,300 → $3,297 → $3,255 ~$3,335–$3,340
A breakout above $3,344–$3,350 validated with volume may drive prices toward $3,400+, with extended targets up to $3,550 or higher in bullish conditions
Traders Union
Time Price Research
.
A drop below $3,326–$3,320 risks further decline, targeting $3,300, $3,297, and eventually $3,255 if breakdown momentum builds .
📉 Market Context & Drivers
U.S. dollar strength, easing safe-haven demand, and optimistic trade sentiment are constraining gold’s upside unless breakout forces emerge .
Key upcoming catalysts: FOMC guidance, U.S. macro data (GDP, inflation), and geopolitical developments—their tone could tip the bias direction .
⚙️ Trade Rules & Risk Management
Wait for a confirmed breakout or breakdown—do not trade mid-range.
Confirm break with at least one close outside the triangle and rising volume .
Position sizing: Risk 1–2% per trade, adjust stop-loss to price structure ($8–$15 depending on volatility).
Take profits in stages: scale out at minor milestones (first targets), trail stop for extended targets.
Avoid chasing price within the middle of the triangle—risk/reward is unfavorable.
🧠 Why This Plan?
Follows textbook symmetrical triangle trading methodology: entry on breakout, stop beyond pattern opposite side, projection based on triangle height .
Aligns with broader outlook: bearish unless convincing upside breakout appears, consistent with analyst consensus hedging current bull exhaustion and wait‑and‑see on policy signals .
✅ Summary
Gold is coiling inside a tight triangle range near $3,326–$3,334, with breakout potential identified to either side:
Bullish breakout over $3,344–$3,350 targets up to $3,550 or beyond.
Bearish breakdown under $3,326–$3,320 risks slide towards $3,300–$3,255.
Wait for confirmation, apply disciplined risk controls, and let volume validate the move.

XAU/USD 1H – Range Consolidation Below Ichimoku Cloud. Chart Review & Technical Insight
1. Ichimoku Cloud & Overall Structure
Price is below the Ichimoku Cloud, with the cloud ahead sloping downward—indicative of bearish short‑term momentum and resistance overhead as long as the cloud holds above price.
The Kijun-sen (blue) line is above the Tenkan-sen (red), reinforcing the bearish bias on this timeframe.
2. Price Action & Key Zones
A support zone around 3,327–3,330 USD/oz is visible, underpinned by multiple rejection taps and price consolidation (“$$$” zone). A clean break below could open the path toward the 3,320’s or lower imbalance region.
On the upside, resistance lies near 3,339–3,340, backed by the cloud’s lower boundary and the Kijun-sen level.
The highlighted green rectangle appears to signal a potential bullish breakout target zone toward 3,365–3,392, contingent on recovery above the cloud.
3. Momentum & Trade Considerations
Momentum is weak, with price moving sideways inside a low‑volatility rectangle on diminishing volume and few directional impulses.
Possible ABC corrective structure is forming as marked, suggesting price may oscillate sideways or continue correcting within established bounds.
A bullish scenario would require clearing the Ichimoku Cloud and resistance at 3,340–3,360 USD.
Conversely, a bearish breakdown below ~3,327 could confirm continuation deeper into the 3,320s or toward the next significant demand zone near 3,300 USD.
✅ Summary
Bias: Slightly bearish to neutral until price can clear the Ichimoku Cloud.
Key Levels to Watch:
Support: 3,327–3,330 (immediate), then 3,320–3,300.
Resistance: 3,339–3,365, cloud top near 3,365, further target zone 3,392.
Scenarios:
Bullish breakout: Close above cloud → potential rally toward 3,365–3,392.
Bearish breakdown: Close below 3,327 → deeper correction toward 3,320 and lower imbalance areas.

Gold (XAU/USD): Supply Zone Rejection & Bearish Breakdown Chart Breakdown:
Supply zone rejection: Gold revisited the “supply zone” (light green/grey area) and failed to break above — a classic signal of seller dominance.
Uptrend invalidated: A sharp rise (steep black trendline) ended with a peak marked by the green arrow, followed by a decisive breakdown.
Ichimoku Cloud test: Prices slipped through the Ichimoku components, reinforcing the shift to bearish sentiment.
Potential targets: The red/green risk‑reward box highlights a short position, targeting ~3,347 then ~3,318 levels (blue labels) as initial support zones.
Strong supply base: The extensive grey zone below marks a "stronger supply zone" — this could cap any modest bounce and keep the downtrend intact.
🔍 Interpretation:
Bias: Bearish — sellers have taken control after a failed breakout.
Strategy: Short on rallies toward the mid‑green/red box (~3,373–3,380), targeting ~3,347 first and then ~3,319. Watch for support at the strong supply region (~3,292) for potential reversal or consolidation.
Risk management: Keep stop above the red zone—above recent highs (~3,380+) to limit risk.
🚀 In a nutshell: After failing to break supply and losing its short‑term uptrend, gold appears poised for a pullback. The next key levels to watch are ~3,347 and ~3,319—where buyers might step back in, or the downtrend continues toward the deeper supply base.

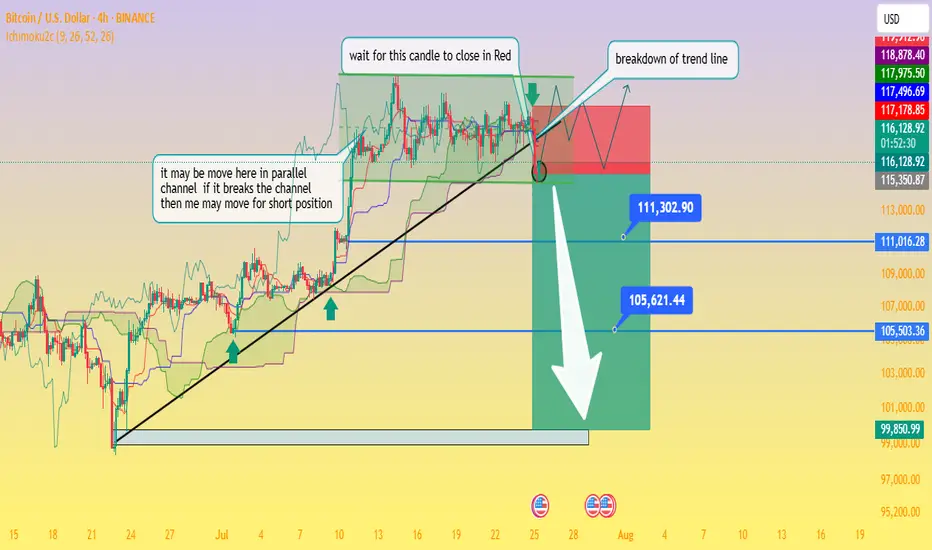
Critical Breakdown: BTC/USD Poised to Fall — Waiting on H4 CloseAnalysis of the BTC/USD 4‑Hour Chart
From the chart you provided, here's how the technical situation looks:
Ascending trendline support has been tested multiple times and was recently breached this afternoon, signaling a possible shift from the bullish setup to a bearish continuation.
The price is now trapped within a descending triangle formation beneath a well‑defined swing high resistance zone. This reflects indecision in the market, with neither buyers nor sellers in clear control
Business Insider
+15
Fxglory Ltd
+15
Bitcoin News
+15
.
Key levels to monitor:
Support zone: ~$115,500, extending down to ~$111,300 and ~$105,600 as deeper targets if bearish momentum strengthens.
Resistance zone: ~$119,000–120,000 area, forming strong overhead supply
Economies.com
DailyForex
Bitcoin News
.
The chart’s annotations align with a classic breakout strategy—with the caveat: wait for a confirmed close below the trendline before considering short positions (as noted in your “wait for this candle to close in red” comment).
Breakout confirmation would likely pave the way toward your indicated profit zones near ~$111k and ~$105k, with a larger potential down to ~$99.8k if further downside pressure builds.
🔍 What the Broader Market Signals
Technical sentiment from sources covering today’s analysis shows BTC/USD hovering just under $120,000, stuck within the defined range of $115.5k support to $120k resistance
Economies.com
.
While there’s still neutral momentum in indicators like RSI and MACD, the short-term direction leans bearish if the breakdown is confirmed on the H4 timeframe
Fxglory Ltd
.
Analysts emphasize that sustained movement above $116.5k could retarget resistance near $119–120k. A failure there and a move below $115.5k may thrust price deeper toward your downside zones
DailyForex
.
✅ Trading Strategy Overview
Scenario Trigger Target Levels
Bearish Breakdown H4 candle closes below trendline ~$115.5k $111.3k → $105.6k → possible $99.8k zone
Bullish Rejection Bounce back above ~$116.5k and trending above resistance $119k–120k retest, potential breakout if sustained
Neutral / Wait-and-see No decisive candle close yet Hold for confirmation
⛳ Final Thoughts
chart highlights a critical point: don’t act prematurely. Wait for a decisive H4 candle close below the trendline before committing to shorts. Confirmed bearish action around the breakout could open the path to the lower targets you identified. However, if price rebounds above support and climbs above $116.5k, a short-term retest of $119k–120k is still in range.
Traders should maintain prudent risk management—watching the unfolding price action around these pivot points without overreaching. Let me know if you'd like help crafting entry/exit zones or risk profiles for this setup!
Gold Eyes Breakout from Ascending Channel Toward $3,500📈 Chart Analysis
1. Rising Channel Structure
Gold (XAU/USD) has been trading within an upward-sloping channel, marked by the blue trendlines connecting interior lows and highs, culminating at point C (~$3,497). The latest bounce off the lower channel near “B” reinforces bullish bias – if this trendline holds, another leg higher toward resistance around $3,497–$3,500 is likely.
2. Support & Resistance Confluence
The purple trendline and the dotted horizontal green level (~$3,498) converge near the projected breakout point. This synergy provides a strong pivot zone — a successful breakout would validate targets near channel highs.
3. Harmonic Pattern in Play
The chart displays a bullish harmonic structure (likely a Bat or Gartley formation), with retracement ratios (0.719, 1.627) anchoring reversal areas. These reinforce the bounce at B and the potential move toward point C.
4. Trade Scenarios
Bullish Scenario (primary): A bounce off the trendline triggers a rally to the channel top and resistance zone ($3,497–$3,500).
Bearish Caution: A drop below the trendline invalidates the pattern, potentially bringing prices back to horizontal support around $3,296 or even $3,120, as indicated at point A.
🛠️ Technical & Market Context
Technicals: Daily trend remains bullish as long as price holds above ~$3,340–$3,350, with resistance forming in the $3,380–$3,400 range
.
Fundamentals: Geopolitical tension (e.g., Middle East conflict) and safe-haven inflows continue to underpin gold — though Citi expects prices to eventually correct toward $3,300–$3,500 mid‑term
Sentiment: Some analysts advocate “selling the rallies,” especially into the $3,450–$3,500 zone . But central banks’ ongoing buying and potential Fed rate cuts support a stronger floor
.
✅ Trade Strategy
Scenario Entry Zone Target Stop Loss Placement
Play the Bounce ~$3,350–$3,360 $3,497–$3,500 Below trendline near B zone (~$3,320)
Breakout Trade On momentum above $3,400 $3,497–$3,550 Below breakout (sub-$3,380)
Bearish Trigger Break & close below trendline Back to $3,296 / 3,120 Just above trendline ($3,360)
🔍 Summary
Gold remains in a structurally bullish setup inside an ascending channel. The confluence of harmonic reversal, strong trendline support, and pending fundamental catalysts presents a high-probability opportunity to push toward the $3,500 area—provided the trendline and $3,340–$3,350 support hold. A drop below would invalidate the bullish outlook and favor deeper retracement.

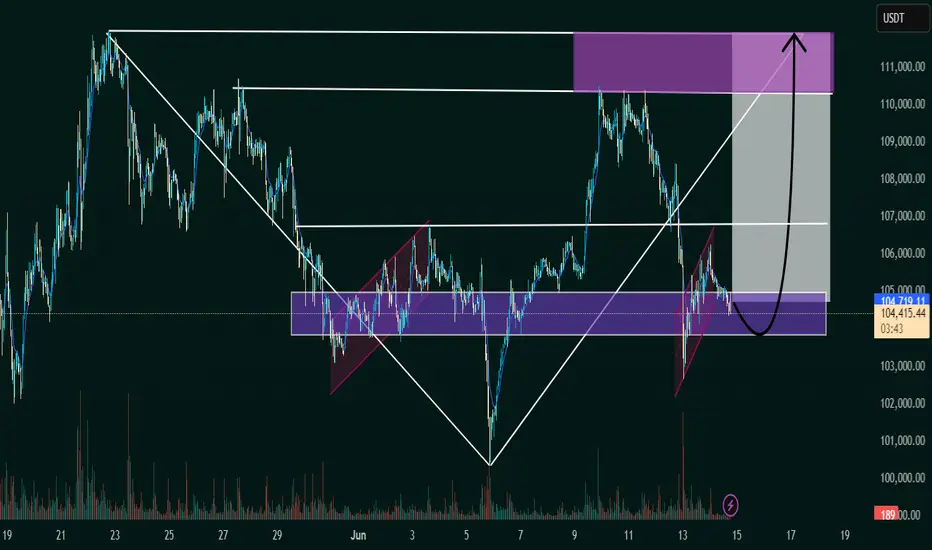
BTC/USDT Bullish Reversal Zone AnalysisSupport Zone:
The horizontal purple box (~104,000 USDT area) has acted as a strong support/resistance flip zone multiple times.
Falling Wedge Breakout:
The price action broke out of a falling wedge pattern earlier, confirming bullish momentum.
Flag Formation (Current):
A smaller bullish flag/pennant appears to be forming, and a breakout above could trigger a strong upward move.
Projected Move:
The black arrow indicates a potential bounce from this support zone, with the price targeting the 111,000–112,000 USDT zone (highlighted in the top purple box).
Volume Spike:
Notable volume spike near the bottom supports the idea of accumulation and possible reversal.
📈 Conclusion:
If the support zone holds and price breaks above the minor flag, a bullish continuation is likely toward the 111,000–112,000 resistance area. Traders should watch for confirmation of a breakout and volume increase for validation.
Basics of RSIThe Relative Strength Index (RSI) is a momentum oscillator that measures the speed and magnitude of price changes, helping traders identify potential overbought or oversold conditions, oscillating between 0 and 100.

US Dollar Index (DXY) – Pre-FOMC Update💥 US Dollar Index (DXY) – Pre-FOMC Update: Expert Analysis and Trading Strategies 💥
In just a few hours, the Federal Reserve (Fed) will announce its interest rate decision and update its economic projections in the Summary of Economic Projections (SEP). This is a highly anticipated event that will shape trading decisions in the coming weeks. The US Dollar Index (DXY) is currently fluctuating within the 103.00 - 104.00 range, reflecting investor caution ahead of the critical updates.
1. Interest Rate Decision and Its Impact on DXY
The policy rate is expected to remain unchanged at 4.25% - 4.50%. However, the market is more focused on signals about future rate cuts, particularly in 2025.
Chair Jerome Powell's post-meeting speech will be the key driver. The market will closely watch for hints on monetary policy, inflation, and the US economic outlook.
If the Fed adopts a hawkish tone (indicating sustained high rates or even further hikes), the DXY could rally strongly. Conversely, a dovish signal could weaken the USD.
2. Technical Analysis of DXY
🔴 Key Support: 103.18
The DXY is currently under pressure at the 103.18 support level. A break below this level could push the index further down to 103.00 or even 102.50.
This is a crucial zone, as failure to hold here would signal continued USD weakness in the short term.
🟢 Major Resistance: 105.00 and 105.57
If the DXY rebounds from current support levels, the next challenges will be the resistance zones at 105.00 and 105.57.
The 50-day and 200-day Moving Averages (MA) on the daily chart are also key indicators to watch. A break above these MAs could reinforce the bullish trend.
📉 Short-Term Trend:
On the 4H chart, the DXY is in a downtrend, with lower highs and lower lows. However, upcoming macroeconomic factors (the rate decision and Powell’s speech) could trigger a reversal or increased volatility.
Technical indicators like the RSI and MACD are in neutral territory, suggesting the market is awaiting clearer signals.
3. Trading Strategy Before and After the FOMC Decision
🔍 Before the Fed Announcement:
Caution is key. The market may experience mild fluctuations during the wait. Traders should avoid large positions and wait for clearer signals.
Closely monitor key support and resistance levels: 103.18 (support) and 105.00 (resistance).
🔥 After the Fed Announcement:
Scenario 1: Fed Holds Rates and Signals Hawkish Tone
The DXY could rally strongly, targeting resistance levels at 105.00 and 105.57.
Strategy: Look for buy opportunities when the DXY bounces off support or breaks above resistance.
Scenario 2: Fed Signals a Dovish Tone
The DXY could drop sharply, breaking below 103.18 and heading toward 102.50.
Strategy: Look for sell opportunities when the DXY breaks support or fails to surpass resistance.
Scenario 3: Fed Holds Rates Without Clear Signals
The DXY may continue to fluctuate within the 103.00 - 104.00 range.
Strategy: Trade within the range, using identified support and resistance levels.
4. Advice for Investors and Traders
📊 Risk management: Always set appropriate stop-loss and take-profit levels to protect your capital. Post-FOMC volatility can be intense, so prepare mentally and have a solid trading plan.
📰 Stay updated: Keep a close eye on Fed updates and market reactions. Jerome Powell’s speech could create significant trading opportunities.
🛠️ Use technical tools: Combine indicators like RSI, MACD, and Fibonacci to identify precise entry points.
5. Conclusion
Tonight’s FOMC meeting will be a decisive factor for the DXY’s short-term direction. With clear support and resistance levels identified, traders should prepare their strategies to capitalize on market movements.
🚨 Stay tuned for the latest updates on TradingView to ensure you don’t miss any trading opportunities!
Wishing you successful trades and profitable outcomes! 💪💰

GBPNZD - Channel Boundaries in Play! What’s Next?The weekly chart of GBPNZD shows price action respecting an ascending channel structure. The pair has been moving within a well-defined ascending channel since early 2023.
GBPNZD weekly chart highlights price action within an ascending channel structure with key levels in play. Watch for bullish opportunities near the support zone at 2.1400–2.1800 or bearish continuation if price breaks below this zone. What’s your bias? Let me know in the comments! #GBPNZD #Forex #TechnicalAnalysis
Disclaimer:
This analysis is for informational purposes only and should not be considered financial advice. Forex trading involves significant risk of loss and may not be suitable for all investors.

what is smart money trading psychology ?"Smart money" trading psychology refers to the mindset, strategies, and behaviors of experienced and institutional traders, as opposed to individual retail traders. These traders are often well-funded, have access to more sophisticated tools, and can move the market in ways that less experienced traders cannot. Their approach to trading tends to be more disciplined, patient, and based on a deeper understanding of market dynamics, rather than emotion or speculation.
Here's a breakdown of what smart money trading psychology entails:
### 1. **Patient and Strategic Decision-Making**:
- **Long-Term Focus**: Smart money traders don’t focus on short-term gains or panic-driven decisions. They often look at the bigger picture, using fundamental and technical analysis to identify high-probability setups.
- **Patient Entry and Exit**: They wait for the right conditions and aren't in a rush to make trades. They are less likely to chase the market or make impulsive moves.
### 2. **Risk Management**:
- **Defined Risk**: Smart money traders always know the amount of risk they are taking on a trade. They define stop-loss levels, position sizes, and risk-to-reward ratios before entering a trade.
- **Capital Preservation**: Protecting their capital is a top priority. This is why they use proper risk management techniques like diversification and hedging to minimize losses.
### 3. **Contrarian Mindset**:
- **Market Sentiment**: Smart money often goes against the crowd. While retail traders may react emotionally to market trends, smart money traders look for opportunities when the masses are overly optimistic or pessimistic. This contrarian approach often leads them to buy when others are selling and vice versa.
- **Following Institutional Money**: They are aware of where the bigger players (institutional investors, hedge funds, banks) are positioned and tend to align their trades with these larger market movers.
### 4. **Emotional Control**:
- **No Emotional Trading**: Unlike retail traders who might panic in times of loss or greedily hold onto winning positions for too long, smart money traders maintain composure. They avoid chasing after quick gains or letting fear drive their actions.
- **Objectivity**: Emotions like fear and greed are minimized. Smart money traders follow their plan and strategy and do not allow the market noise to disrupt their decision-making process.
### 5. **Understanding Market Liquidity and Volume**:
- **Liquidity Awareness**: They are mindful of market liquidity, ensuring there’s enough volume in a market to enter and exit trades without significant slippage or price manipulation.
- **Volume Analysis**: Smart money traders often use volume as a key indicator. High trading volume can confirm the strength of a trend, while low volume might signal potential reversals or consolidation.
### 6. **Information Edge**:
- **Access to Research and Data**: Smart money traders typically have access to better information, tools, and research. They use this edge to identify trends or opportunities that other retail traders might miss.
- **Fundamental Analysis**: They often analyze the underlying value of assets (such as stocks, commodities, or currencies) by studying macroeconomic data, company financials, and other relevant factors that influence price movements.
### 7. **Consistency Over Time**:
- **Building Wealth Gradually**: Instead of trying to make quick profits, smart money traders focus on consistency. They aim for steady growth and avoid risky, one-off bets.
- **Refining Strategies**: They continuously learn from past trades, refining their approach over time based on what works and what doesn’t.
### 8. **Market Manipulation Awareness**:
- **Avoiding the "Noise"**: Smart money traders are aware of market manipulation tactics (like "pump and dump" schemes) and don't get caught up in hype-driven rallies or crashes.
- **Understanding Market Cycles**: They have a deep understanding of market cycles and often recognize when prices are being artificially inflated or deflated.
### How to Adopt Smart Money Psychology:
1. **Develop a Trading Plan**: Like the pros, smart money traders always have a clear plan. It includes strategies, risk management techniques, and exit plans. If you lack a plan, it's easy to make emotional decisions.
2. **Keep Emotions in Check**: It can be hard, but detaching emotion from trading is essential. Practice self-discipline, and don't act impulsively.
3. **Use Proper Risk Management**: Define your risk per trade, set stop losses, and calculate risk-to-reward ratios before you enter a position.
4. **Learn Continuously**: Smart money traders are constantly learning and evolving. Stay updated on financial news, trends, and market conditions, and never stop improving your trading skills.
5. **Watch the Bigger Players**: Pay attention to what large institutional traders are doing. You can often find clues in volume patterns, options activity, or reports from major financial institutions.
In summary, smart money trading psychology is all about discipline, patience, risk management, and staying objective. It requires a strategic approach, rather than relying on gut feelings or reacting emotionally to market movements. By adopting these principles, individual traders can better position themselves for long-term success.

what is option chain analysis ?Option chain analysis is the study of the option chain data, which is a listing of all the available option contracts for a particular underlying asset (like a stock, index, or commodity) and their corresponding strike prices, expiration dates, and trading volumes. By analyzing this data, traders can gain insights into market sentiment, potential price movements, and liquidity. It helps investors make more informed decisions about buying or selling options.
Here's how option chain analysis works and what traders typically look for:
### 1. **Components of an Option Chain**
- **Strike Price**: The price at which the option holder can buy or sell the underlying asset.
- **Expiration Date**: The date by which the option must be exercised.
- **Call Options**: These give the holder the right to buy the underlying asset at the strike price.
- **Put Options**: These give the holder the right to sell the underlying asset at the strike price.
- **Open Interest (OI)**: The total number of open (outstanding) option contracts for a given strike price and expiration.
- **Volume**: The number of contracts traded during the day.
- **Implied Volatility (IV)**: A measure of expected price fluctuation in the underlying asset; higher IV suggests higher uncertainty.
### 2. **Key Indicators in Option Chain Analysis**
- **Open Interest**: Higher open interest at a particular strike price often indicates strong support or resistance at that level. A sudden increase can signal growing market interest in that strike.
- **Volume**: High trading volume suggests a lot of activity or interest in a particular strike, which may indicate potential price movement.
- **Put/Call Ratio**: A ratio that compares the trading volume or open interest of put options to call options. A high put/call ratio can indicate a bearish sentiment, while a low ratio can indicate bullish sentiment.
- **In-the-Money (ITM), At-the-Money (ATM), and Out-of-the-Money (OTM)**: These terms describe the relationship of the strike price to the underlying asset's market price.
- ITM: The option has intrinsic value (e.g., for calls, the stock price is above the strike price).
- ATM: The strike price is near the current price of the underlying asset.
- OTM: The option has no intrinsic value (e.g., for calls, the stock price is below the strike price).
- **Implied Volatility (IV)**: High IV typically indicates an expectation of significant price movement in the underlying asset. Traders look for changes in implied volatility to gauge market sentiment.
### 3. **Using Option Chain Analysis for Insights**
- **Identifying Support and Resistance**: By observing where the highest open interest is, traders can determine key support and resistance levels. For example, a large number of open call options at a specific strike price can suggest resistance, while a large number of open put options might indicate support.
- **Predicting Price Movement**: Changes in open interest and volume can signal a potential price move. A rise in call option open interest may suggest bullish sentiment, while an increase in put option open interest may indicate bearish sentiment.
- **Sentiment Analysis**: Traders often use the put-call ratio and the implied volatility to gauge overall market sentiment. A shift in sentiment can indicate possible trend reversals or price movements.
- **Price Targets and Breakouts**: Option chain analysis helps traders spot potential price targets where large numbers of options may be concentrated, signaling potential price breakouts.
### 4. **Example:**
- If you see high open interest in a strike price of a stock's call options, especially at levels close to or above the stock's current price, and there is a lot of trading volume in these contracts, it could indicate that traders expect the stock to move upwards, possibly indicating a bullish sentiment.
- Conversely, if there’s high open interest in put options with a strike price below the current market price of the stock, it could indicate a bearish outlook.
### Conclusion
Option chain analysis is a powerful tool that can give traders valuable insights into potential price movements, market sentiment, and areas of high interest. By carefully studying the data, including open interest, volume, strike prices, and implied volatility, investors can make better decisions when it comes to entering or exiting trades in the options market.
